I gave a 30 minute talk at the Operability.io conference yesterday on the topic of “The Morning Paper meets operability.” In a first for me, I initially prepared the talk as a long blog post, and then created a set of supporting slides at the end. Today’s post is the text of that talk – no new papers therefore, but hopefully a fun reminder of some of the good stuff we’ve looked at over the last couple of years. Plenty of other research I could have mentioned too of course, if only I had more time…!
Abstract
The Morning Paper is a daily blog covering fundamental research and the latest results in computer science. Over the last two years Adrian has covered over 400 papers, and in this talk he will introduce a selection of lessons learned and relevant research results that might help us tame some of the complexities involved in operating modern applications and infrastructure. From failure sketching to pivot tracing, provenance to profiling, expect a rapid-fire succession of ideas and research designed to inspire you never to settle for the status quo.
Introduction
Hi, my name’s Adrian Colyer. I’m a venture partner with Accel here in London where it’s my job to help find and build great technology companies in Europe. Prior to that I held CTO roles at Pivotal, VMware, and SpringSource. I also write a blog called ‘The Morning Paper’ where I post a summary of a computer science research paper every weekday. I’ve just entered my third year of doing this, which equates to over 400 paper write-ups.
When starting to think about this talk, my impression was that the majority of papers (or at least, of the ones that I read) don’t really talk about operational issues. But I was pleasantly surprised, as I looked back through my collection, just how many papers there were that touched on issues relevant to operations. For the next 25 minutes or so I’m going to share some of my personal highlights with you, and I hope that something here catches your interest and inspires you to dig deeper.
Operability starts with design and development
If I could only share one paper with you today, it would be this one: “On designing and deploying internet-scale services” by James Hamilton from LISA ’07. I could easily spend the full half-an-hour just on this. Hamilton reminds us that operability is not something you bolt-on at the end, but is an integral part of the design of a system:
We have long believed that 80% of operations issues originate in design and development… when systems fail, there is a natural tendency to look first to operations since that is where the problem actually took place. Most operations issues however, either have their genesis in design and development or are best solved there.
When you think about it, that’s a powerful argument for DevOps, being made back in 2007. Here’s another quote from the same paper talking about the need for service teams that have shared responsibility for dev and ops:
If the development team is frequently called in the middle of the night, automation is the likely outcome. If operations is frequently called, the usual reaction is to grow the operations team.
Hamilton’s three tenets for operable services will seem very familiar to us today, even so it’s good advice and interesting to see what the most important high level things are in Hamilton’s opinion:
- Expect failures to happen regularly and handle them gracefully
- Keep things as simple as possible
- Automate everything
Beneath these tenets there’s so much advice packed into the paper that I worked through it and turned it into a checklist that I’ve made available as a gist on GitHub.
Perhaps now you can see why we could easily spend the whole half hour just on this one paper! There’s more I want to share with you though.
Figuring out what’s going on – the big picture
I read a collection of papers on the topic of “how hell do I know what is going on in my distributed system / microservices deployment?” One of the classics here is Google’s Dapper paper. In it Google describe how they instrument everything in order to generate trace information, then sample those traces and store the samples in a database with an API on top for querying.
Here are three lessons I took from the paper:
- The system configuration and behaviour has to be inferred – under constant deployments it doesn’t make sense to talk about a central master config file.
Modern Internet services are often implemented as complex, large-scale distributed systems. These applications are constructed from collections of software modules that may be developed by different teams, perhaps in different programming languages, and could span many thousands of machines across multiple physical facilities…. Understanding system behavior in this context requires observing related activities across many different programs and machines.
- Even your best engineers often get it wrong when they’re working from guesses and intuition.
When systems involve not just dozens of subsystems but dozens of engineering teams, even our best and most experienced engineers routinely guess wrong about the root cause of poor end-to-end performance. In such situations, Dapper can furnish much-needed facts and is able to answer many important performance questions conclusively.
- If your tracing infrastructure relies on application developers ‘actively collaborating’ it will become extremely fragile and often broken / out of date. I’ve previously studied the same phenomenon in large commercial software systems during my time working as the lead of the AspectJ project.
Google get around this last issue by having common shared infrastructure components that everyone uses, so they can add instrumentation there. But many companies don’t, including Facebook, so what can they do?
Facebook’s Mystery Machine may hold some of the answers.
… many systems are like the Facebook systems we study; they grow organically over time in a culture that favors innovation over standardization (e.g., “move fast and break things” is a well-known Facebook slogan). There is broad diversity in programming languages, communication middleware, execution environments, and scheduling mechanisms. Adding instrumentation retroactively to such an infrastructure is a Herculean task.
Never fear, the logs are here!
Our key observation is that the sheer volume of requests handled by modern services allows us to gather observations of the order in which messages are logged over a tremendous number of requests.
Log messages are required to have: * request identifier * host identifier * host-local timestamp * a unique event label
The output from all the logs is captured in an UberTrace system, which samples a small fraction for end-to-end tracing.
The Mystery Machine uses the traces generated by UberTrace to create a causal model of how software components interact during the end-to-end processing of a Facebook request. It then uses the causal model to perform several types of distributed systems performance analysis…
- Finding the critical path
- Quantifying slack for segments not on the critical path (this knowledge is later used to improve average latency by making connections with considerable slack lower priority)
- Identifying segments correlated with performance anomalies
You might also be interested in Gorilla, an in-memory TSDB that Facebook built to handle the 1 trillion data points per day gathered by their monitoring system. Gorilla can store 26 hours of data in memory with HBase used for longer-term storage. One of the tools built on top of Gorilla is a time series search that can look for metrics that show a correlation with errors, helping engineers look for root causes.
Facebook’s Mystery Machine needs a request id in log records that can be used to correlate entries in a trace, but what if you don’t even have that?
lprof makes the absolute best out of whatever you do have in your logs, and is capable of inferring causal dependencies to identify individual requests and profile their performance behaviour. It can track service requests across helper threads and remote service invocations.
The information in the logs is sufficiently rich to allow the recovering of the inherent structure of the dispersed and intermingled log output messages, thus enable useful performance profilers like lprof.
The lprof implementation works with Java and combines static bytecode analysis with log statement analysis. The static analysis looks at log printing statements and generates regular expressions to match log statements produced by them, and does dataflow analysis to determine which variables included in a log statement are modified and which aren’t. The ones that aren’t are candidate request identifiers… A temporal analysis (e.g. message A must come before message B) is used to help in the case where there is no unique id per request. It also uncovers communication between threads.
The team analysed HDFS, Cassandra, YARN, and HBase in this way.
Our evaluation shows that lprof can accurately attribute 88% of the log messages from widely-used production quality distributed systems and is helpful in debugging 65% of the sampled real-world performance anomalies.
But what if the information you need isn’t in the logs in the first place? There always seems to be either too much information so that you drown in a sea of irrelevance, or too little in the crucial area where you really need it. Pivot tracing enables dynamically configuring and installing of monitoring at runtime, with low system overhead and causality capture between events across multiple processes and applications. It uses a load-time weaver (similar in spirit to AspectJ) and a custom query language for the information you want to extract. Overheads are low at around 0.3%, and there are some excellent examples of pivot tracing query results being used to solve real bugs in Hadoop.
Narrowing it down
Failure Sketching is a technique for automated root cause analysis of in-production failures.
The greatest challenge is posed by bugs that only recur in production and cannot be reproduced in-house. Diagnosing the root cause and fixing such bugs is truly hard. In [57] developers noted: “We don’t have tools for the once every 24 hours bug in a 100 machine cluster”. An informal poll on Quora asked “What is a coder’s worst nightmare?,” and the answers were “The bug only occurs in production and can’t be replicated locally,” and “The cause of the bug is unknown.”
Let me show you what failure sketching does for you, and then we can talk about how it does it. Here’s an example of an automatically created failure sketch, using the authors’ tool called Gist, for a bug in Apache which is caused by a double free:
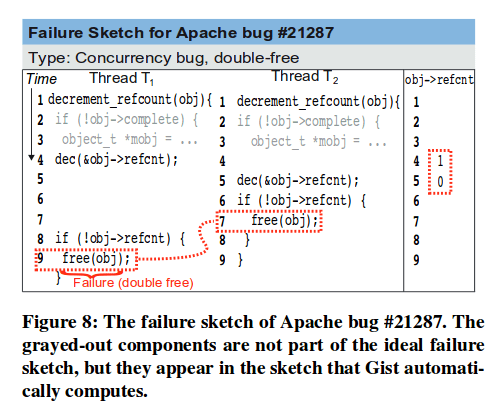
It makes me smile that the authors apologise for the greyed-out statements that do appear in their generated sketch, but would not be part of the ideal sketch. I’d take this kind of help any day!
So how do we get to such a simple thing? The starting point for Gist is the program source code and binary, and a stack trace. So you know where you have a problem, but you don’t know why. With many systems that automatically catch and report exceptions, you can see how easy it would be to automate starting the Gist process…
Gist then performs a static analysis of the program code to figure out what the possible causes might be. If you really want to know, “Gist uses an interprocedural, path-insensitive and flow-sensitive backward slicing algorithm.”
Gist then instructs its runtime (embedded in the operating system) to instrument the program and gather additional traces. Then it sits there and waits. The program continues to execute, and gist observes failing and successful runs and determines the difference between them. From this analysis, it produces the failure sketches for developers to investigate.
Gist uses Intel Processor Trace hardware support to ensure it has incredibly low overhead and can be left in place to monitor all requests while hunting out a bug, thus ensuring it never misses the failure when it does occur. Using Intel PT also means that the software being diagnosed does not have to be changed in any way.
We evaluated our Gist prototype using 11 failures from 7 different programs including Apache, SQLite, and Memcached. The Gist prototype managed to automatically build failure sketches with an average accuracy of 96% for all the failures while incurring an average performance overhead of 3.74%. On average, Gist incurs 166x less runtime performance overhead than a state-of-the-art record/replay system.
That’s really neat, and I hope it makes its way to a system near you soon. But in the meantime, if you don’t have a modified kernel and Intel PT hardware to hand, here’s a handy technique that can help to reduce a failing test case to the minimum needed to reproduce the problem. The base idea has been around a long time, and it’s called delta debugging (simplifying and isolating failure-inducing input) …
It can take a program input (e.g. an HTML page that causes a browser crash, or a program that causes a compiler crash) and automatically reduce it down to just what is essential to reproduce the bug, without any understanding of the meaning of the input text at all.
Take for example this C program that crashed the gcc compiler:
#define SIZE 20

double mult(double z[], int n)
{
  int i, j ;
  i = 0;
  for (j = 0; j < n; j++) {
    i = i + j + 1;
    z[i] = z[i] * (z[0] + 1.0);
  }
  return z[n];
}

void copy(double to[], double from[], int count)
{
  int n = (count + 7) / 8;
  switch (count % 8) do {
    case 0: *to++ = *from++;
    case 7: *to++ = *from++;
    case 6: *to++ = *from++;
    case 5: *to++ = *from++;
    case 4: *to++ = *from++;
    case 3: *to++ = *from++;
    case 2: *to++ = *from++;
    case 1: *to++ = *from++;
  } while(--n > 0);
  return mult(to,2);
}

int main(int argc, char *argv[])
{
  double x[SIZE], y[SIZE];
  double *px = x;

  while (px < x + SIZE)
    *px++ = (px - x) * (SIZE + 1.0);
  return copy(y,x,SIZE);
}
Without understanding anything about the syntax or semantics of C (so for example the minimizer has no understanding about whether or not a change it tries results in a valid C program) this test case was automatically minimized to:
t(double z[],int n){int i,j;for(;;){i=i+j+1;z[i]=z[i]*z[0]+0;}return z[n];}
An 894 line HTML document that crashed Mozilla on printing was reduced down to just “<SELECT>” in the same way. What we’re looking for is a test case in which any single change causes the failure to disappear. For the C and HTML examples, the unit of change is a single character. Delta debugging operates a little bit like a greedy search:
If the failing test case only contains 1 unit of change, then it is minimal by definition. Otherwise we can begin with a binary search…
- Partition the failing input (sequence of changes) into two subsets with similar sizes, lets call them Δ1 and Δ2 ( reducing with n=2 subsets)
- Test Δ1 and Δ2
- If Δ1 reproduces the failure, we can reduce to Δ1 and continue the search in this subset. We can do likewise with Δ2 if that reproduces the failure.
But what if neither Δ1 nor Δ2 reproduces the failure? Perhaps both tests pass, or perhaps they result in input that is not well-formed from the perspective of the program under test and cause the test to be ‘unresolved.’ We have two possible strategies open to us:
- We can test larger subsets of the failing input – this will increase the chances that the test fails, but gives us a slower progression to the 1-minimal solution.
- We can test smaller subsets of the failing input – this has a lower chance of producing a failing test, but gives us faster progression if it does.
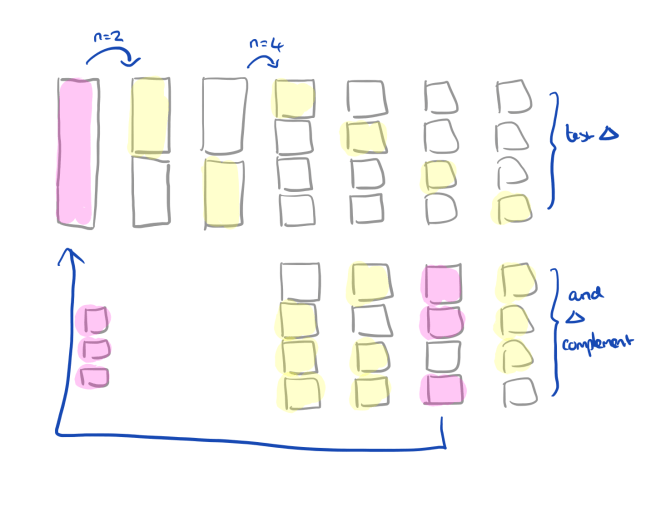
The ddmin algorithm cleverly combines both of these and proceeds as follows:
- Partition the failing input into a larger number of subsets (twice as many as on the previous attempt). Test each small subset Δi, as well as its (large) complement: failing input – Δi. From testing each Δi and its complement we get four possible outcomes:
- If the test of any Δi reproduces the failure, then we can reduce to this subset and continue with this as our new input (reducing with n=2 subsets).
- If the test of any Δi complement reproduces the failure, then continue from this complement and reduce it with n-1 subsets.
- If no test reproduces the failure, and any subset contained more than one change, then try again with finer-grained subsets. Step up to 2n if possible, and if 2n > the number of changes in the input, then just divide into subsets of one change each.
- If no test reproduces the failure, and all subsets contain only one change, we are done – we have a 1-minimal test input.
There’s a variation on delta debugging called Hierarchical Delta Debugging that can exploit structure in hierarchical input sources (HTML, XML, json, programs, etc.) to find minimal test cases more quickly, and to produce minimized versions that look more natural to developers.
For the C program example we just saw, ddmin requires 680 tests to minimize it, whereas HDD can do so with only 86 tests and produces something much easier to read. HDD works by successively finding 1-minimal sets of nodes at each level of the tree, starting at the top level. An HDD implementation in Python is just 150 lines of code.
mult(double *z, int n)
{
  int i;
  int j;
  for(;;) {
    i = i + j + 1;
    z[i] = z[i] * (z[0] + 0);
  }
}
DEMi (the Distributed Execution Minimizer – “Minimizing Faulty Executions of Distributed Systems”) takes this idea and extends it to distributed systems, where the vast state space makes it really hard to track down problems.
DEMi starts with a sequence of events known to cause a failure (for example, generated by a fuzzing tool), and then tries to reduce it to the minimum needed to reproduce the failure. There are three stages:
- Finding the minimal causal sequence of external events such that removing any one of them no longer triggers the fault. DEMi uses a combination of delta debugging and something called Dynamic Partial Order Reduction which prunes commutative schedules from the search space. A number of heuristics described in the paper help to guide the search.
- Minimize internal (in-process) events by searching for smaller schedules that still contain the same external sequence of events, and that still trigger the violation.
- Try to minimize the data payloads of the external messages.
The current DEMi implementation is built on top of Akka and AspectJ. It proved very effective at finding and minimizing failure-inducing execution traces in akka-raft and Apache Spark.
| Bug | found or reproduced? | #events: Total(External) | Minimized #events | time (secs) |
|---|---|---|---|---|
| raft-45 | reproduced | 1140(108) | 37(8) | 498 |
| raft-46 | reproduced | 1730(108) | 61(8) | 250 |
| raft-56 | found | 780(108) | 23(8) | 197 |
| raft-58a | found | 2850(108) | 226(31) | 43345 |
| raft-58b | found | 1500(208) | 40(9) | 42 |
| raft-42 | reproduced | 1710(208) | 180(21) | 10558 |
| raft-66 | found | 400(68) | 77(15) | 334 |
| spark-2294 | reproduced | 1000(30) | 40(3) | 97 |
| spark-2294-caching | reproduced | 700(3) | 51(3) | 270 |
| spark-3150 | reproduced | 600(20) | 14(3) | 26 |
| spark-9256 | found | 600(20) | 16(3) | 15 |
Why oh why
We just looked at some approaches for narrowing down the causes of failures. DBSherlock is a system that can help to explain the causes of performance anomalies. It’s integrated into the DBSeer open source framework and works with transactional databases, although the approach could easily be applied in other domains too.
The starting point for DBSherlock is a performance anomaly captured by the metrics DBSeer is collecting every second. A user can highlight a region of interest and ask “what caused this?”

DBSherlock then looks at all of the time series data that has been gathered and tries to figure out a set of predicates that best separate the abnormal region from normal regions. For example, an anomaly caused by a network slowdown may be explained by:
network send < 10KB
and network receive < 10KB
and client wait times > 100ms
and cpu usage < 5
DBSherlock also includes causal models (which it learns through interaction with users) so that it may be able to give a high-level diagnosis such as “Rotation of the redo log file.”
DB Sherlock starts by discretizing the time series within the ranges of interest

and then labeling the partitions as normal or abnormal:

This will be noisy, so a filling and filtering process helps to find a sharper edge separating normal and abnormal regions:
In the first phase all partitions with a non-empty neighbour of the opposite type are marked and then switched to empty.

In the second phase the gaps are filled, with a configurable bias towards marking partitions as normal.
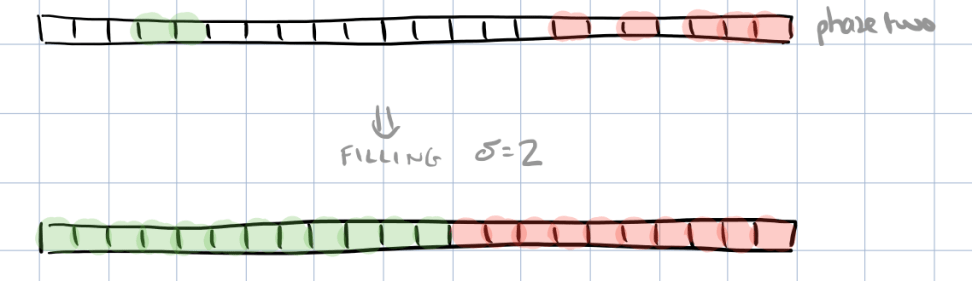
If at the end of this process the average normal and average abnormal values are seperated by more than some threshold, a predicate is generated.
If a DB admin reviews the predicates and after investigation confirms the true cause has a higher level explanation (e.g. the rotation of the redo log file example), then this is added to the system as a causal model and linked with the predicates. For every future diagnosis, DBSherlock calculates the confidence of its causal models and offers them as possible explanations when the confidence is above some configurable threshold.
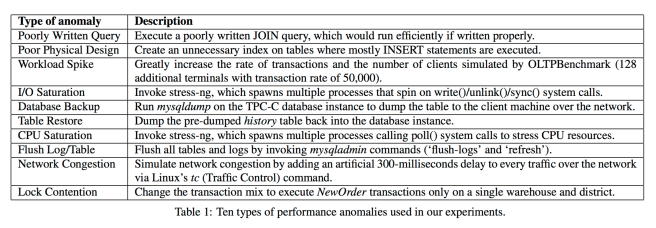
Our extensive experiments show that our algorithm is highly effective in identifying the correct explanations and is more accurate than the state-of-the-art algorithm. As a much needed tool for coping with the increasing complexity of today’s DBMS, DBSherlock is released as an open-source module in our workload management toolkit.
Here are some examples of the types of anomalies explained by DBSherlock in the experiments:
Closing the loop
We started this talk by discussing the value of bringing dev and ops together. In Runtime Metric Meets Developer Cito et al. have an interesting twist on this they call ‘feedback driven development.’
A unifying theme of many ongoing trends in software engineering is a blurring of the boundaries between building and operating software products. In this paper, we explore what we consider to be the logical next step in this succession: integrating runtime monitoring data from production deployments of the software into the tools developers utilize in their daily workflows (i.e., IDEs) to enable tighter feedback loops. We refer to this notion as feedback-driven development (FDD).
They collect operations data and map it onto a source code artefact graph, which is then used to annotated and inform development.
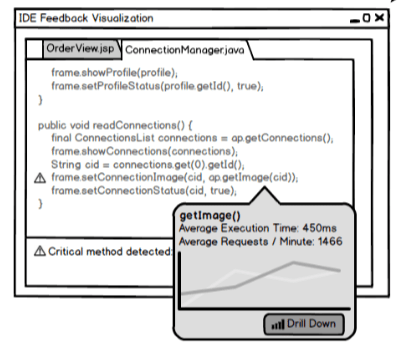
The early examples mostly centre around the display of profiling style information, but based off of operational data, not a locally run profiler. It’s an interesting idea to watch though, and you could easily imagine information about runtime exceptions and so on showing up too.
Timeless advice
We’re almost out of time, so let me close with one last paper – written by a medical doctor but oh so applicable to IT as well, How Complex Systems Fail. It’s packed with great advice and insights, including this one:
The complexity of complex systems makes it impossible for them to run without multiple flaws being present. Because these are individually insufficient to cause failure, they are regarded as a minor factor during operations. Complex systems therefore run in degraded mode as their normal mode of operation.
The path to more robust system performance, says Cook, is designing systems where operators can more easily discern the edge of the envelope between acceptable failures and pending catastrophe, and how their actions move the system performance towards or away from that edge. I hope you go on to check out the paper after this talk, it’s well worth it.
Outro
So that concludes our whirlwind tour through a selection of papers that speak to operational issues: from designing for operability to figuring out what’s going on, narrowing in on root causes, and explaining behaviour.
If you like this kind of thing, you can follow The Morning Paper at https://blog.acolyer.org, or follow me on Twitter (I’m @adriancolyer) where I announce each day’s paper. On the blog you’ll also find an option to subscribe to the mailing list edition if you’d prefer to have the paper write-up delivered straight to your inbox.
Appendix: Paper write-ups referenced in this talk
-
On designing and deploying internet scale services, Hamilton ’07 : https://blog.acolyer.org/2016/09/12/on-designing-and-deploying-internet-scale-services/
-
Dapper: https://blog.acolyer.org/2015/10/06/dapper-a-large-scale-distributed-systems-tracing-infrastructure/
-
Mystery Machine: https://blog.acolyer.org/2015/10/07/the-mystery-machine-end-to-end-performance-analysis-of-large-scale-internet-services/
-
Gorilla https://blog.acolyer.org/2016/05/03/gorilla-a-fast-scalable-in-memory-time-series-database/
-
Pivot tracing https://blog.acolyer.org/2015/10/13/pivot-tracing-dynamic-causal-monitoring-for-distributed-systems/
-
Failure sketching https://blog.acolyer.org/2015/10/12/failure-sketching-a-technique-for-automated-root-cause-diagnosis-of-in-production-failures/
-
Simplifying and isolating failure inducing input https://blog.acolyer.org/2015/11/16/simplifying-and-isolating-failure-inducing-input/
-
Hierarchical delta debugging https://blog.acolyer.org/2015/11/17/hierarchical-delta-debugging/
-
Minimising faulty executions https://blog.acolyer.org/2015/11/18/minimizing-faulty-executions-of-distributed-systems/
-
Runtime metric meets developer https://blog.acolyer.org/2015/11/10/runtime-metric-meets-developer-building-better-cloud-applications-using-feedback/
-
How complex systems fail https://blog.acolyer.org/2016/02/10/how-complex-systems-fail/

3 thoughts on “The Morning Paper on Operability”
Comments are closed.