Delayed impact of fair machine learning Liu et al., ICML’18
“Delayed impact of fair machine learning” won a best paper award at ICML this year. It’s not an easy read (at least it wasn’t for me), but fortunately it’s possible to appreciate the main results without following all of the proof details. The central question is how to ensure fair treatment across demographic groups in a population when using a score-based machine learning model to decide who gets an opportunity (e.g. is offered a loan) and who doesn’t. Most recently we looked at the equal opportunity and equalized odds models.
The underlying assumption of course for studied fairness models is that the fairness criteria promote the long-term well-being of those groups they aim to protect. The big result in this paper is that you can easily up end ‘killing them with kindness’ instead. The potential for this to happen exists when there is a feedback loop in place in the overall system. By overall system here, I mean the human system of which the machine learning model is just a small part. Using the loan/no-loan decision that is a popular study vehicle in fairness papers, we need to consider not just (for example) the opportunity that someone in a disadvantaged group has to qualify for a loan, but also what happens in the future as a result of that loan being made. If the borrower eventually defaults, then they will also see a decline in their credit score, which will make it harder for the borrower to obtain additional loans in the future. A successful lending event on the other hand may increase the credit score for the borrower.
Consequential decisions… reshape the population over time. Lending practices, for example, can shift the distribution of debt and wealth in the population. Job advertisements allocate opportunity. School admissions shape the level of education in a community.
If we want to manage outcomes in the presence of a feedback loop, my mind immediately jumps to control theory. Liu et al. don’t go all the way there in this paper, but they do introduce “a one-step feedback model of decision making that exposes how decisions change the underlying population over time.”
We argue that without a careful model of delayed outcomes, we cannot foresee the impact a fairness criterion would have if enforced as a constraint on a classification system. However, if such an accurate outcome model is available, we show that there are more direct ways to optimize for positive outcomes than via existing fairness criteria.
Fairness criteria
Three main selection policies are used as the basis of the study, and to keep things simple we’ll consider a setting in which the population is divided into two groups, A and B. Group A is considered to be the disadvantaged group (“A” for Advantaged would have made a lot more sense!). An institution makes a binary decision for each individual in each group, called selection (e.g., should this individual be offered a loan).
- In the unconstrained or max profit model a lender makes loans so long as they are profitable, without any other consideration.
- In the demographic parity model the institution maximises its utility subject to the constraint that the institution selects from both groups at an equal rate.
- In the equal opportunity model utility is maximised subject to the constraint that individuals with a successful outcome (e.g. repay their loan) are selected at an equal rate across both groups.
See ‘Equality of opportunity in supervised learning’ for a discussion of the equal opportunity model and why it is preferred to demographic parity.
The outcome curve
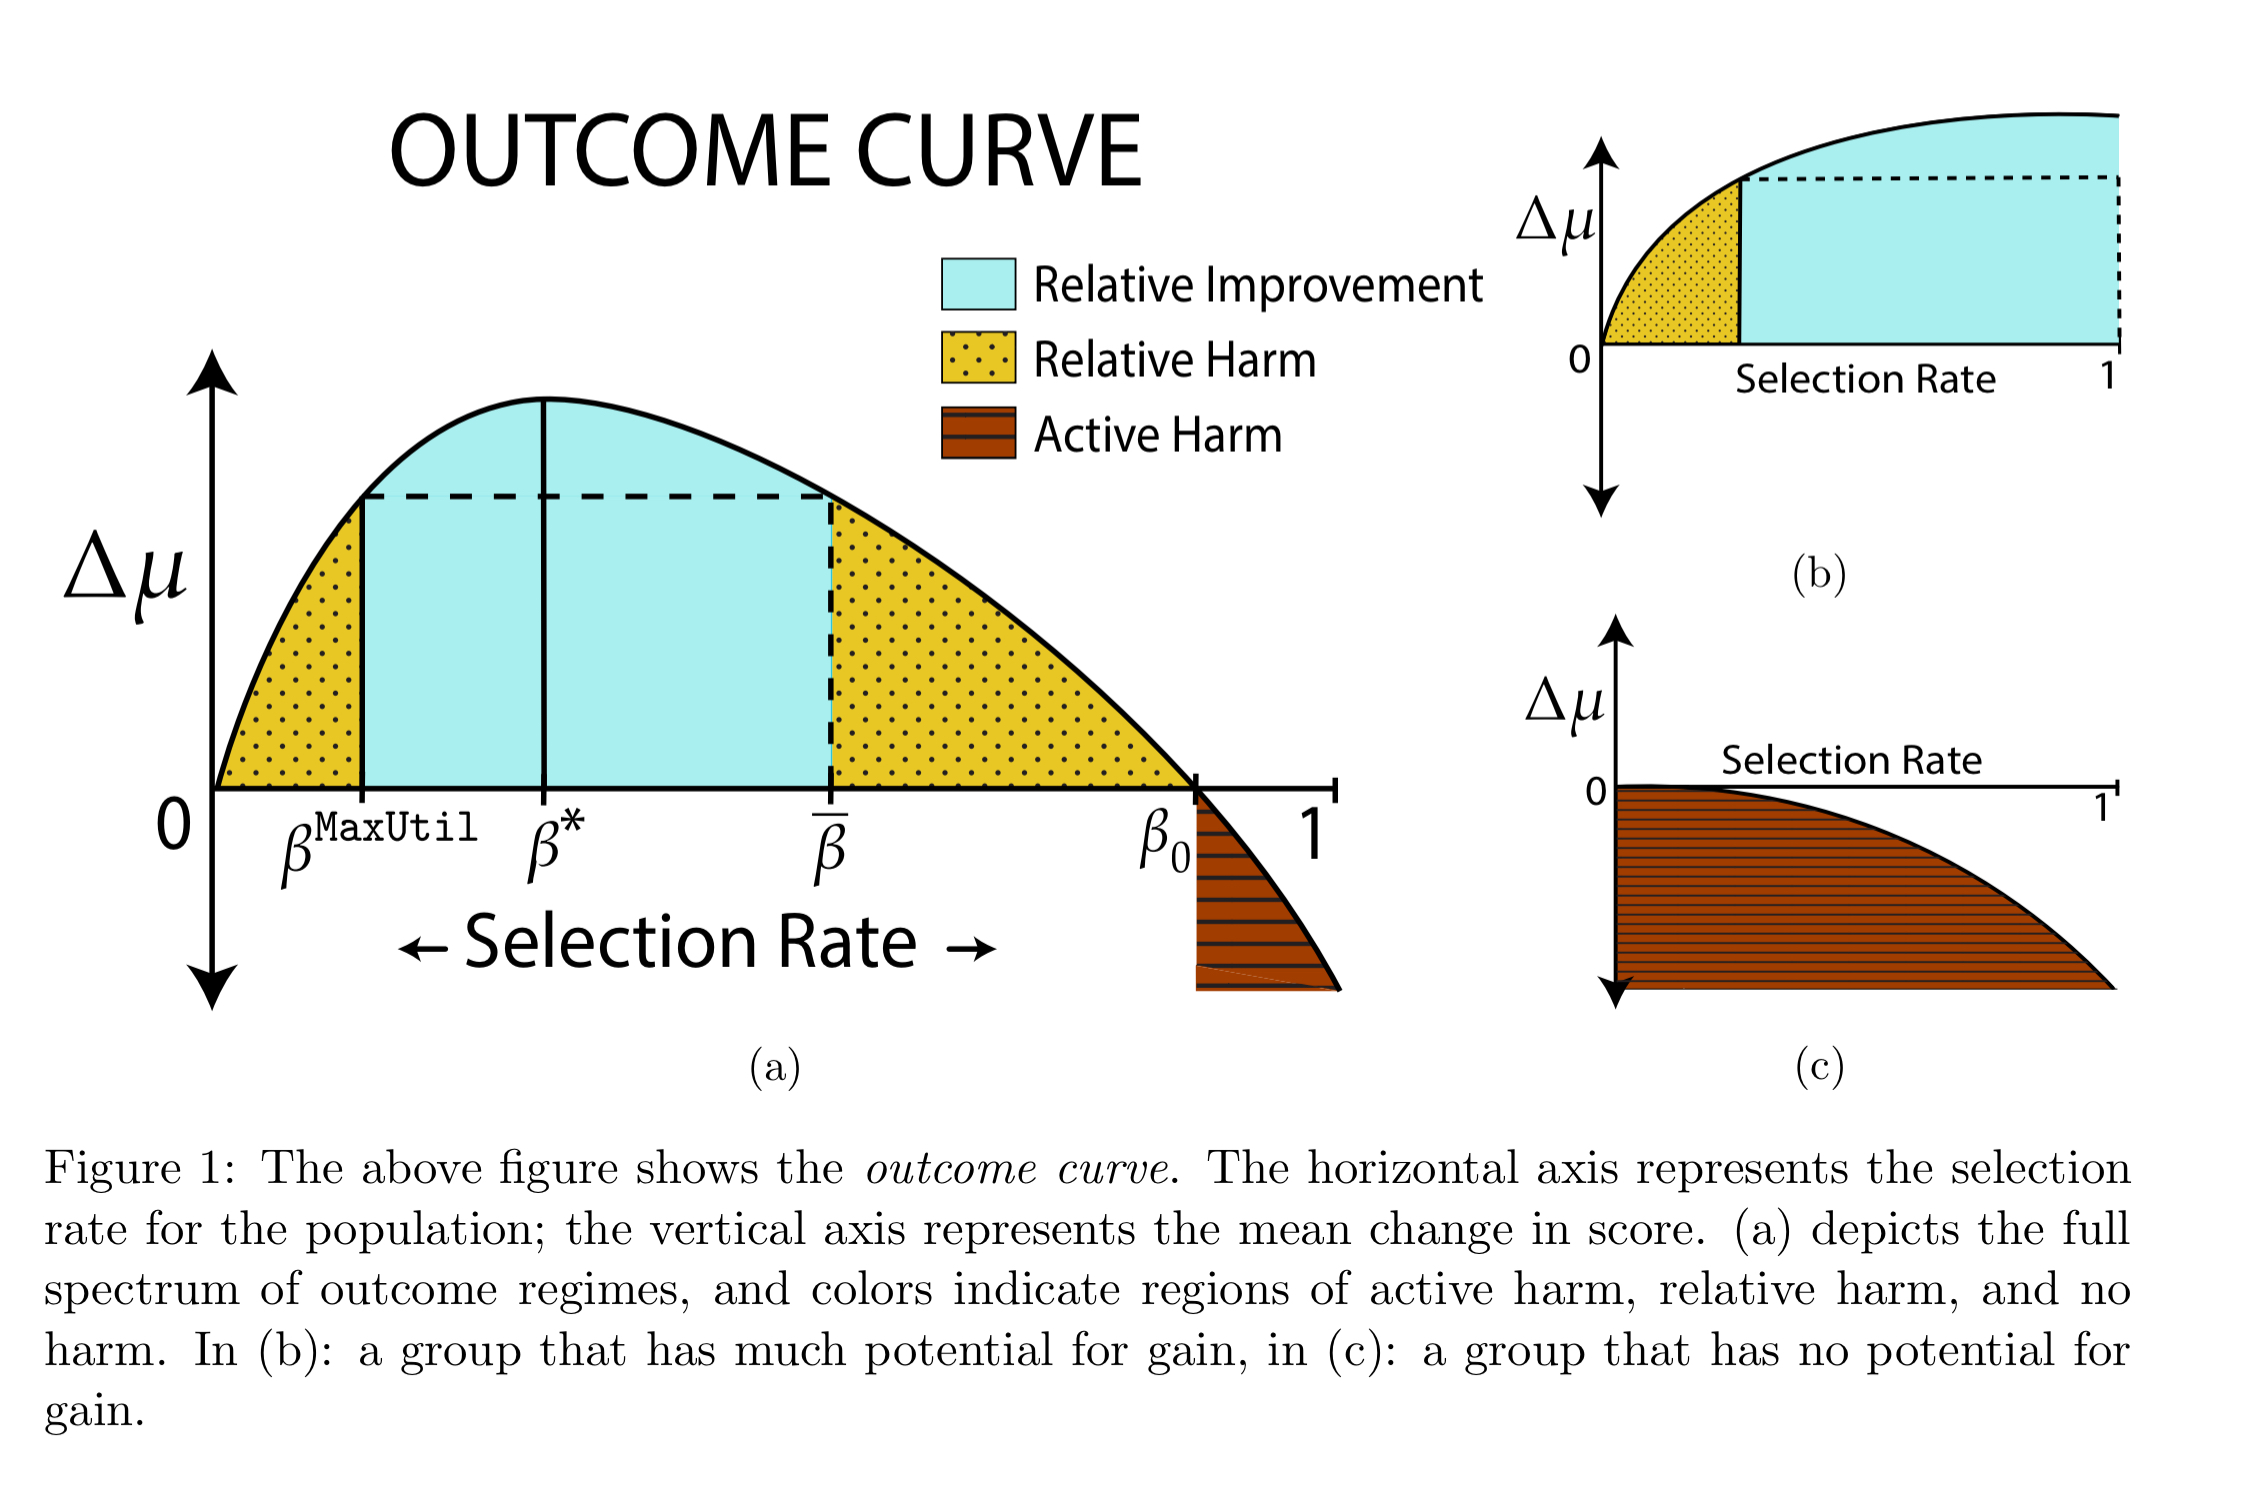
The authors study what happens to the average (mean) score of a group under different selection policies. A policy is said to cause active harm if it causes the average score to go down, stagnation if the average score does not change, and improvement if the average score goes up. It’s also useful to compare a policy to some baseline, for which we’ll use the maximum profit / utility model. Compared to this baseline, a policy does relative harm if the average score under the policy is less than it would be under the maximum utility model, and relative improvement if the average score under the policy is greater than it would be under the maximum utility model.
Given a policy, there is some threshold score above which members of a group will be selected. We can think of the threshold as determining a selection rate, the proportion of a group selected by the policy. As the selection rate varies, so does the impact on the average score over time. We can plot this in an outcome curve.

The outcome curve shows three regions of interest: relative improvement, relative harm, and active harm. If the selection rate for a group under the maximum utility model is , then reducing the selection rate below this does relative harm to the group – i.e., the average score goes down. Intuitively, there are less positive outcomes for the group to drive a positive feedback loop (e.g. people receiving loans and paying them back).
If we increase the selection rate above the maximum utility (from the perspective of the institution remember) point, then to start with the group sees a relative improvement in their average scores. This holds so long as the additionally selected individuals have more positive outcomes than negative. The selection rate at which relative improvement is maximised is denoted by .
If we push the selection rate too high though, then negative outcomes (loan defaults) rise and the average score improves less. If this improvement falls below the maximum utility point, we’re back in a region of relative harm. The rate above which relative improvement switches back to relative harm is denoted by .
Push the selection rate even higher still (beyond , and the impact of the additional negative outcomes can mean that not only does the group see relative harm, but also active harm, i.e., they are worse off in absolute terms.
Killing with kindness?
Under analysis, both demographic parity and equal opportunity fairness criteria can lead to all possible outcomes (improvement, stagnation, and decline). Interestingly, “under a mild assumption, the institution’s optimal unconstrained selected policy can never lead to decline“. So it’s therefore possible to have a fairness intervention with the unintended consequence of leaving the disadvantaged group worse off than they were before. There are also some settings where demographic parity causes decline, but equal opportunity does not. Furthermore, there are some settings where equal opportunity causes relative harm, but demographic parity does not.
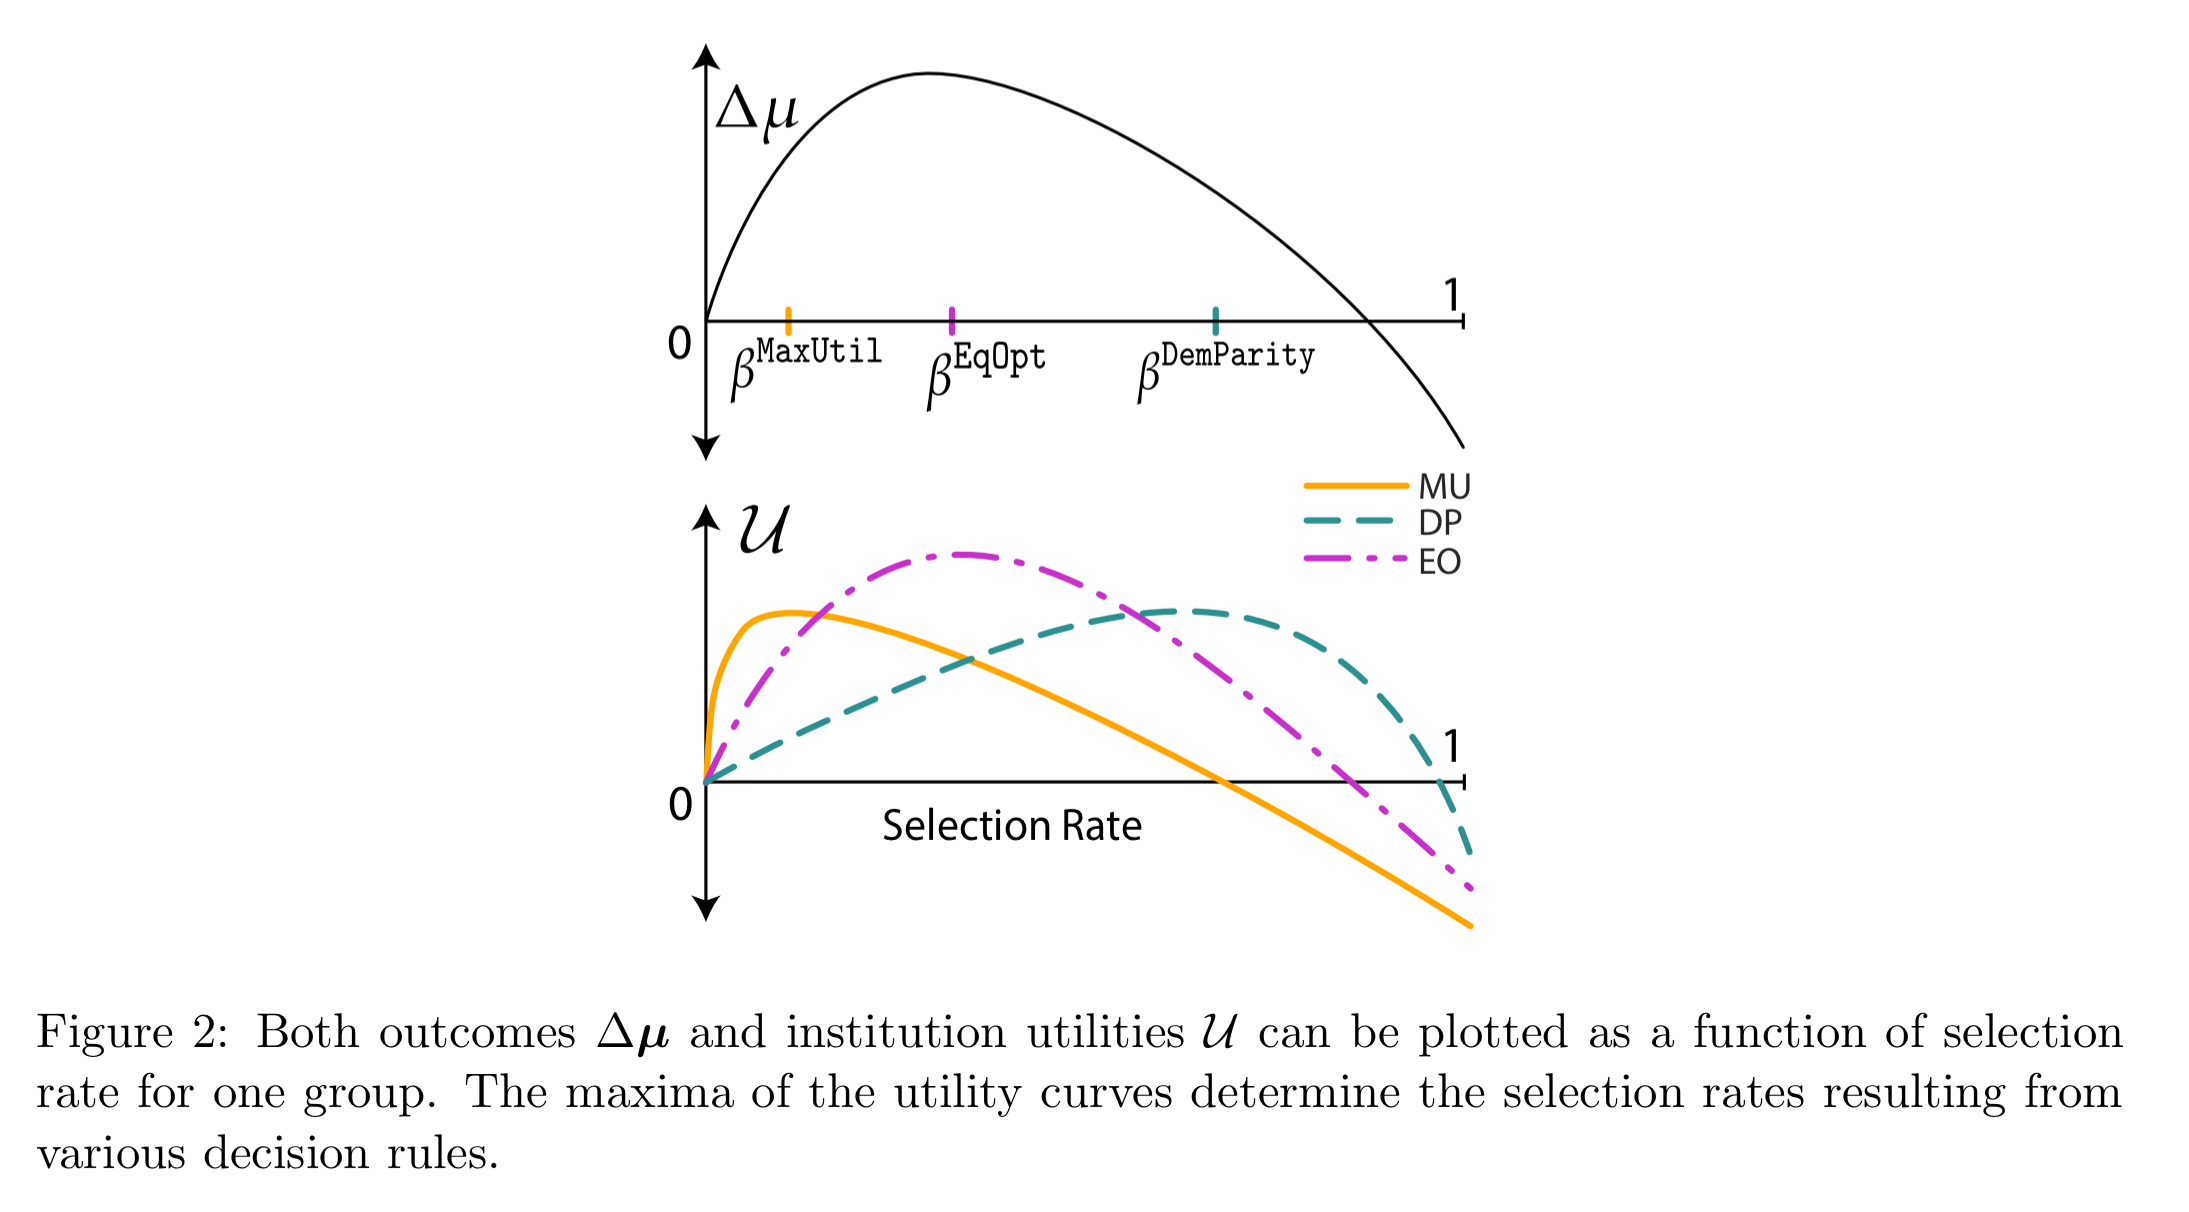
If we assume that under each fairness criteria the institution otherwise maximises utility, then we can determine the selection rates under each policy from utility curves.

Whether the policies show relative harm, relative improvement, or active harm, depends on where the selection rates and
fall with respect to
and
.
Outcome based fairness
…fairness criteria may actively harm disadvantaged groups. It is thus natural to consider a modified decision rule which involves the explicit maximization of [the average score of the disadvantaged group]… This objective shifts the focus to outcome modeling, highlighting the importance of domain specific knowledge.
For example, an institution may decide to set a selection rate for the disadvantaged group that maximises the improvement in their average score, subject to a constraint that the utility loss compared to the baseline is less than some threshold.
A FICO example
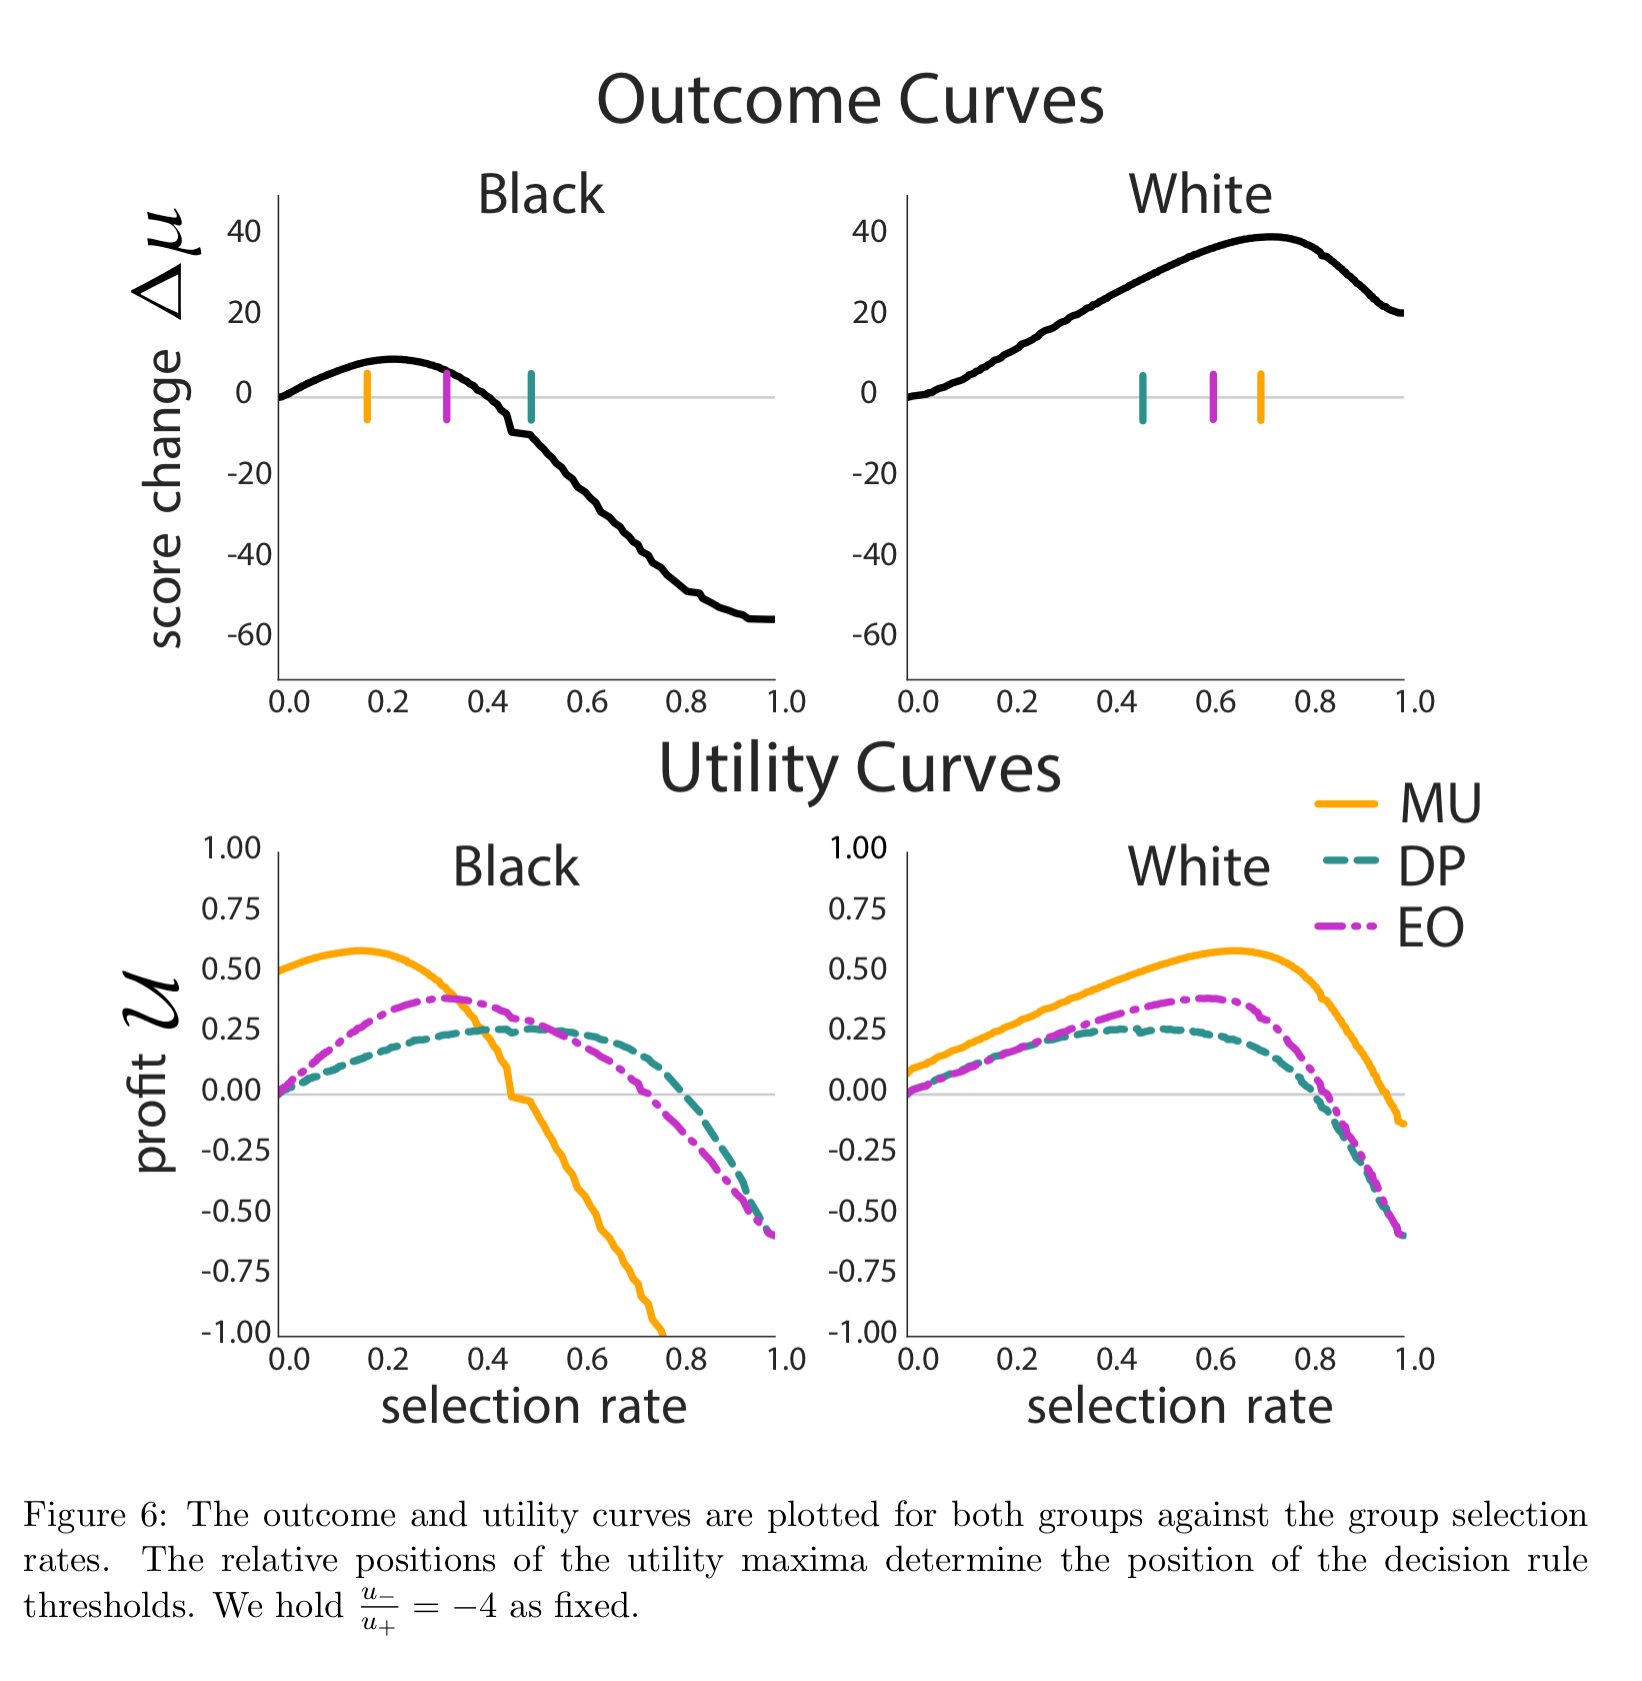
The authors look at the impact of fairness constraints on FICO scores (credit worthiness) using a sample of 301,536 scores from 2003. Individuals were labeled as defaulted if they failed to pay a debt for at least 90 days on at least one account in the ensuing 18-24 month period. With a loss/profit ratio of -10, no fairness criteria surpass the active harm rate. But at a loss/profit ratio of -4, demographic parity overloans and causes active harm.

This behavior stems from a discrepancy in the outcome and profit curves for each population. While incentives for the bank and positive results for individuals are somewhat aligned for the majority group, under fairness constraints, they are more heavily misaligned in the minority group, as seen in the graphs (left) above.