Reducing controversy by connecting opposing views Garimella et al., WSDM 2017
Society is often polarized by controversial issues that split the population into groups with opposing views. When such issues emerge on social media, we often observe the creation of ‘echo chambers’, i.e., situations where like-minded people reinforce each other’s opinion, but do not get exposed to the views of the opposing side. In this paper we study algorithmic techniques for bridging these chambers, and thus reduce controversy.
This is the follow-up to the paper on detecting controversial topics that we looked at yesterday. Suppose we find a controversial topic, and have the partitioned graph showing the two sides of the discussion, what can we do to bring them together? Adding edges (bridges) between users on opposite sides of the debate would reduce the controversy, and we can calculate (by looking at the impact on the RWC score) which edges we can add to have the greatest effect. Recall however that the graph is based on retweets and follows, so to ‘add an edge’ we need not only to make recommendations (e.g., to a recommendation to follow someone on the other side of the debate), but we also need users to act on those recommendations…
Clearly, some bridges are more likely to materialize than others. For instance, people in the ‘center’ might be easier to convince that people on the two extreme ends of the political spectrum. we take this issue into account by modeling an acceptance probability for a bridge as a separate component of the model.
Let’s ignore the acceptance probability issue temporarily so that we can focus on the simpler problem to start with. Graphs of controversial topics often have a structure that resembles star-graphs – a small number of highly popular vertices receiving incoming.

Connecting the centres of the two stars provides the maximum reduction in RWC score. More generally, the controversy reduction algorithm considers only edges between high-degree vertices on each side. For each of these candidate edges, the RWC score is calculated with the edge added. The k edges that lead to the lowest score when added to the graph individually then become the recommendations.
Adding back in the notion of acceptance probability, we need to calculate the expected RWC score for adding an edge, under some probabilistic model providing the probability the edge will be accepted once recommended.
We build such an acceptance model on the feature of user polarity [that we looked at yesterday]. Intuitively, this polarity score of a user, which takes values in the interval [-1,1], captures how much the user belongs to either side of the controversy… We employ user polarity as feature for our acceptance model because, intuitively, we expect users from each side to accept content from different sides with different probabilities, and wes assume these probabilities are encoded in, and can be learned from, the graph structure itself.
Let 


That is, the fraction of times a user with polarity ~

So how do we calculate the polarity 


Let 


Now ![P_u = \rho^{X}(u) - \rho{Y}(u) \in [-1,1]](https://s0.wp.com/latex.php?latex=P_u+%3D+%5Crho%5E%7BX%7D%28u%29+-+%5Crho%7BY%7D%28u%29+%5Cin+%5B-1%2C1%5D&bg=eeeeee&fg=666666&s=0&c=20201002)
We can compute the top-k edges under this model using Fagin’s algorithm: create two ranked lists of edges (u,v), one ranked by decreasing RWC as per the simplified algorithm, and one ranked by decreasing probability of acceptance. “Fagin’s algorithm parses the two lists in parallel to find the edges that optimize the expected decrease E(u,v).”
Instead of having to recompute RWC from scratch each time we want to calculate how much it will decrease when adding an edge, the authors show a way to incrementally compute it – this provides an order of magnitude speed-up in the algorithm runtime.
Case study
In order to provide qualitative evidence on the functioning of our algorithms on real-world datasets, we conduct a case study on three datasets… We can verify that the recommendations we obtain are meaningful and agree with our intuition for the proposed methods…
In the table below, the ROV row represents the recommendations without acceptance probability taken into account, and ROV-AP the recommendations that do consider acceptance probability.
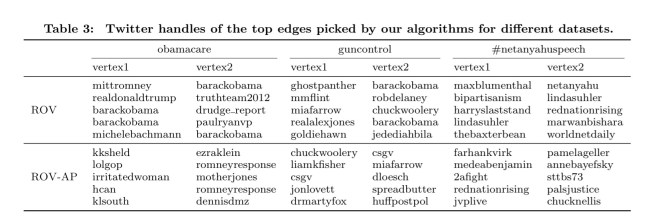
For example, for obamacare ROV recommends edges from mitromney to barackobama, and from barackobama to paulryanvp. Even though these edges indeed connect opposing sides, they might be hard to materialize in the real world. This issue is mitigated by ROV-AP which recommends edges between less popular users, yet connects opposing viewpoints.
Dear Twitter
Dear Twitter,
You have it in your power to truly differentiate your platform and make the world a better place by implementing controversial topic and filter bubble detection (per the paper we looked at yesterday), together with letting users see their polarity score (per today’s paper) and making controversy reducing / filter-busting follower recommendations (also per today’s paper). This would be something new and unique in the world of mass media consumption, and could help to make Twitter great again.
How about it?
Regards, Adrian.

“Adding edges (bridges) between users on opposite sides of the debate would reduce the controversy”
Hmm, quite a big assumption being made there!
My gut reaction is “Twitter, how about if you stop being quite so eager to police my Twitter feed?” Twitter management is controversial enough without this sort of thing; I question whether flagging “controversial” tweets and complaining to users that their feed is too one-sided will be received as helpful.
In practical terms, if the service decides to suggest bubble-busting recommendations (or if an individual, aware of being in a bubble, wants to find some new people to follow), it might be more useful to take non-controversial tweets into account, and look for users who have commonalities in these areas but are very different in the controversial areas. This is because if you have some commonalities with someone, you’re less likely to dismiss disagreement out of hand.
For example, if you’re interested in computer science and current politics, and you find yourself in a politics bubble, I suspect you’re more likely to accept different information from someone who also is interested in computer science—whose topics and retweets overlap with yours in this area—and who also has a very different political profile. If your interests in CS coincide, you’ll probably have a more open mind when considering political tweets where you disagree.
There’s also the question of how deep into the blue or red this person falls when considering their controversial areas. If you’re in one area, you’re more likely to be receptive to someone at the near fringes of the other. (That is, people in a bubble will be more receptive to users in the purple areas, because they’re less different than themselves. Too different, and they’re likely to dismiss the other user as a kook.)
You’re most likely to listen to the other side of a controversy if it comes from someone who:
– has some overlapping interests and attitudes
– isn’t so far away in opinion, in controversial areas, that you can’t listen
The polarity score is likely to partly capture this, but I think it will be more useful to separate the two aspects of overlapping non-controversial interest and controversial extreme-ness. If you are presented with a user who is an expert in, say, dog shows and also has extreme political views, they may well have a low polarity score (because of the dog shows), but they don’t have anything in common with a computer scientists who hates dogs, and their politics may be too extreme to allow connection with someone on the other side.
tl;dr: Twitter users generally tweet about various topics, so why not use the non-controversial topics to find connections that will get users out of the bubble?
I don’t think this is in any way related to this paper but BuzzFeed just announced something similar – read about it here: https://www.engadget.com/2017/02/17/all-opinions-are-equal-in-buzzfeed-s-new-comment-system/
The feature is called »Outside Your Bubble«, an example is here: https://www.buzzfeed.com/alexkantrowitz/twitter-is-now-temporarily-throttling-reach-of-abusive-accou?utm_term=.wo0qwbLA8#.qbLZOvj3A
I think they are curating this manually but it’s nice that someone is reacting to this concerning phenomenon.
To close, thanks Adrian for all the effort you put into your paper write-ups – I’ve been reading every single one for the last 6 months.
This is great computer science, but your follow-on idea to bring people together using these approaches is naive in the extreme. See https://medium.com/@joshuatauberer/so-you-want-to-reform-democracy-7f3b1ef10597#.tyrf5rh88.