RedQueen: An online algorithm for smart broadcasting in social networks Zarezade et al., WSDM 2017
Update: see also this very helpful project page by the authors: RedQueen.
Ssshh, don’t tell the folks in marketing ;). This paper starts out with a simple question “when’s the best time to tweet if you want to get noticed?,” detours through some math involving “solving a novel optimal control problem for a system of jump stochastic differential equations (SDEs),” and pops out again on the other side with a simple online algorithm called RedQueen.
The problem of being noticed is quickly translated into the proxy problem “how to stay at the top of followers’ feeds for as long as possible.”
… recent empirical studies have shown that stories at the top of their followers’ feed are more likely to be likely to be noticed and consequently liked or shared. Can we find an algorithm that helps a user decide when to post to increase her chances to stay at the top?
Testing against previous recommendations for optimal posting times and historical Twitter datasets shows tweets posted according to the RedQueen algorithm last up to 3.5x longer towards the top of follower’s feeds.
Modelling the problem
Consider a tweeting user (a broadcaster in the terminology used in the paper). Such a user can be modelled by a temporal point process, which is a fancy way of saying a stochastic process generating a sequence of discrete events (tweets) over time. If we just care about the number of tweets a user makes, we can simplify further and use a counting process representation: let 


The intensity function used in the paper has two terms: the first term 
The second term makes the intensity dependent on history and a stochastic process by itself.
The combination of a counting process
A collection of broadcasting users is a vector 

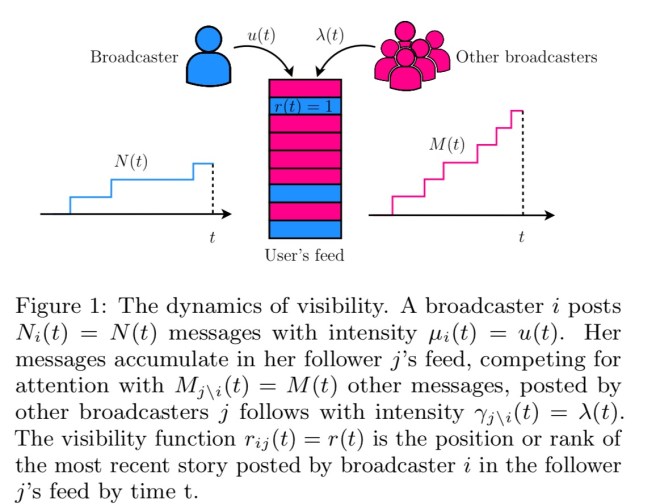
Given a broadcaster i and one of her followers j, we define the visibility function rij(t) as the position or rank of the most recent story posted by i in j’s feed by time t, which clearly depends on the feed ranking mechanism in the corresponding social network. Here, for simplicity, we assume each user’s feed ranks stories in inverse chronological order.
Given this simplifying assumption, the rank of a tweet is given simply by the number of tweets from other broadcasters that appeared in the feed after it.
Given a broadcaster i and her followers N(i), our goal is to find the optimal conditional intensity μi(t) = μ(t) that minimizes the expected value of a particular nondecreasing convex loss function of the broadcaster’s visibility on each of her follower’s feeds and the intensity itself, μ(t)…
Still following?
At this point section 4 in the paper shows how to break this problem down into smaller sub-problems using Bellman’s principle of optimality and the HJB equation. It all gets a bit hairy (for my abilities), but the authors end up showing that: “The optimal intensity for the when-to-post problem defined by Eq. 6 with quadratic loss and penalty functions is given by 
When to post – RedQueen
What the equation we just saw tells us is that the optimal intensity depends only on the position of the most recent post by user i in her follower’s feed. This means determining the best time to post can be done via sampling.
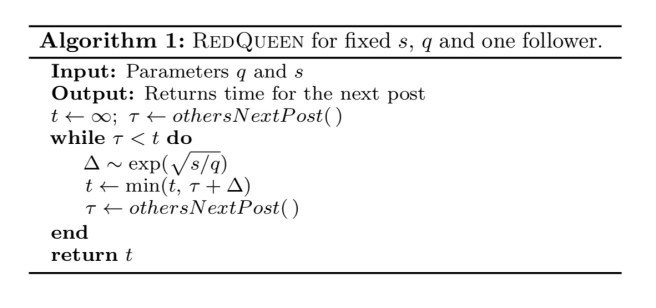
Algorithm 1 summarizes our (sampling) method, which we name RedQueen. Within the algorithm, othersNextPost() returns the time of the next event by other broadcasters in the followers’ feeds, once the event happens. In practice, we only need to know if the event happens before we post. Remarkably, it only needs to sample M(tf) times from a (exponential) distribution (if significance is constant) and requires O(1) space.
In the above, 


The algorithm as defined above only deals with a single follower. To deal with n followers simply sum the 
Experiments
An evaluation was conducted on a dataset of 1.7B tweets by 52 million users, with 1.9B directed follow links between them. For each broadcaster, equal significance was assigned to each follower, and q was tuned to match the number of tweets made by the broadcaster (with tolerance of 10%) during the two month period the dataset covers.
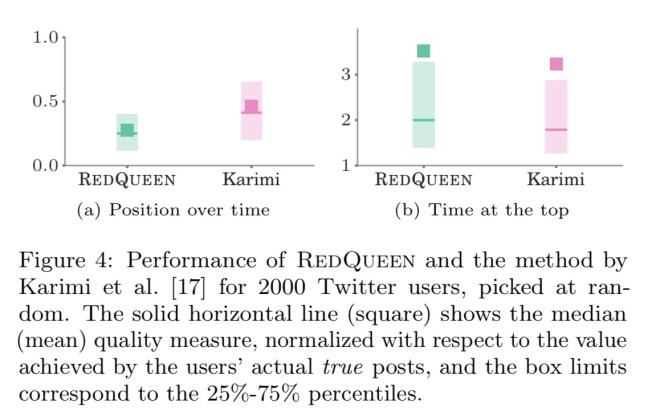
Figure 4 summarizes the results by means of box plots, where position over time and time at the top are normalized with respect to the value achieved by the broadcasters’ actual true posts during the two month period. That means, if y = 1, the optimized intensity achieves the same position over time or time at the top as the broadcaster’s true posts. In terms of position over time and time at the top, RedQueen consistently outperforms competing methods by large margins and achieves 0.28× lower average position and 3.5× higher time at the top, in average, than the broadcasters’ true posts – in fact, it achieves lower position over time (higher time at the top) for 100% (99.1%) of the users.
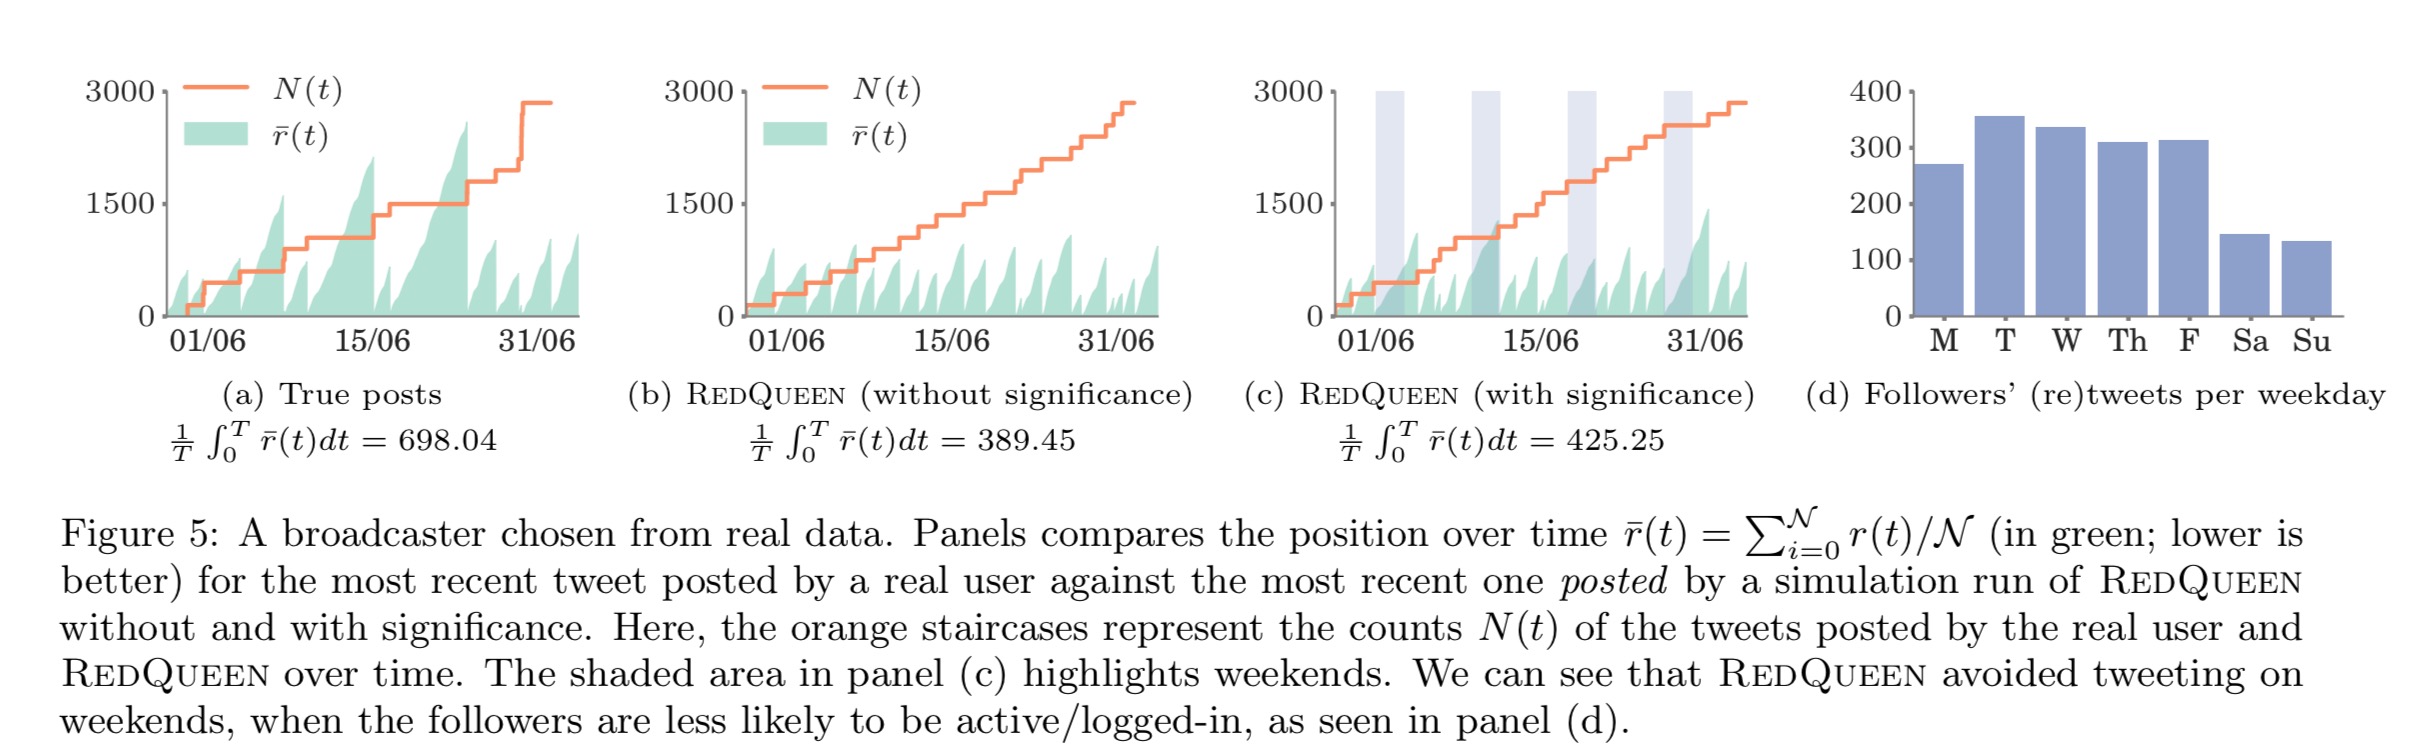
The authors also picked an individual user, and looked at the position over time of their most recent ‘real’ tweet against the most recent one posted by a simulation run of RedQueen.
without significance information, RedQueen posts at nearly an even pace. However, when we supply empirically estimated significance, RedQueen avoids tweeting at times the followers are unlikely to be active, i.e., the weekends, denoted by the shaded areas in panel (c) of Figure 5. Due to this, the average position (maximum position) falls from 389.45 (1085.17) to 425.25 (1431.0), but is still lower than 698.04 (2597.9) obtained by the user’s original posting schedule.
(Click on image for larger view).

Second callout: “makes the intensity *dependent* on history…” (not “dependency”)
Fixed, thank you!