Quantifying controversy in social media Garimella et al. WSDM 2016
Last week I had the pleasure of dropping in on WSDM (Web Search & Data Mining) 2017 for the conference start-up day in Cambridge (UK). This week I’ll be bringing you a selection of papers from the conference, but to kick things off I’m going back to WSDM 2016…
A couple of weeks ago I realised that since Trump’s election, my twitter feed had been composed entirely of negative tweets about Trump. Asking on twitter “how bad is my filter bubble?” led to some recommendations for additional people to follow to add some balance. Even if you don’t agree with the opposing position, the first basis for moving forward is to acknowledge and attempt to understand it – and you can’t do that if you never even see it! In such a blatant case, it was easy to spot there must be a filter bubble effect, but how often does the news bias go unnoticed? In “Quantifying controversy in social media,” Garimella et al. give us a method for identifying topics around which there is controversy, which is the first step in realising there might be another side to the story.
… we assume that controversial and polarized topics induce graphs with clustered structure, representing different opinions and points of view. This assumption relies on the concept of “echo chambers” which states that opinions or beliefs stay inside communities created by like-minded people, who reinforce and endorse the opinions of each other. This phenomenon has been quantified in many recent studies.
The research is carried out in the context of Twitter, but in theory can be applied to any social graph structure. A topic is simply defined as a query, often a hashtag. Given a query, we can build a conversation graph with vertices representing users, and edges representing activity and interactions between users. Using a graph partitioning algorithm, we can then try to partition the graph in two. If the partitions separate cleanly, then we have a good indication that the topic is controversial and has polarised opinions.
Our findings on controversy have many potential applications on news-reading and public-debate scenarios. For instance, quantifying controversy can provide a basis for analyzing the “news diet” or readers, offering the chance for better information by providing recommendations of contrarian views, deliberating debates, and connecting people with opposing opinions.
There are three stages in the process: (i) building the conversation graph so that it includes features useful for detecting controversy, (ii) partitioning the graph, and (iii) determining a controversy measure from the resulting partitions. In the paper, the authors explore several alternatives for graph construction and controversy measures – I’m going to focus just on the ones that proved to work the best!
Graph building
Twitter hashtags are used as seed queries (e.g. #beefban), but we can’t define a topic just by a single hashtag…
For instance, the opposing sides of a controversy might use different hashtags, as the hashtag itself is loaded with meaning and used as a means to express their opinion. Using a single hashtag may thus miss part of the relevant posts… Given a seed hashtag, we define a topic as a set of related hashtags, which co-occur with the seed hashtag.
Unweighted co-occurrence will tend to pick up popular (but neutral to the topic) hashtags such as #ff. A topic is therefore defined by the seed hashtag and the top-k co-occurring hashtags as scored by a weighted similarity measure (k=20 in the experiments).
Specifically, we compute the document frequency of all hashtags on a random 1% sample of the Twitter stream, and normalize the original similarity score between two hashtags by the inverse document frequency.
Here are the top-20 hashtag topic clusters for #baltimoreriots and #netanyahuspeech:
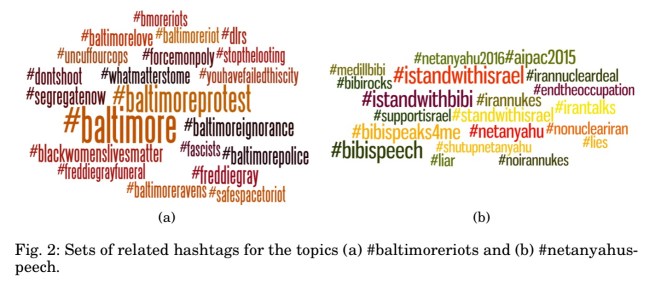
Even inspecting these hashtag clusters gives a sense of the controversy within those topics.
From the tweets containing these hashtags we build a graph where each tweeting user is represented by a vertex. Edges are created between users based on two criteria:
- If user A retweets user B, then this is seen as signalling an endorsement of the opinion expressed in the original tweet by propagating it further. Note that user A does not need to be following B in order to retweet a tweet from user B.
- If user A and user B both employ a given hashtag (from the topic cluster), and A follows B, then an edge is created from A to B. “We stress that the graph G built with this approach is topic-specific, as the edges in G are constrained to connections between users who discuss the topic that is specified as input to the pipeline.“
The authors also experimented with created edges based on content similarity (e.g. posting links to the same URL), but these were found not to be reliable predictors of controversy in the evaluation.
Graph partitioning
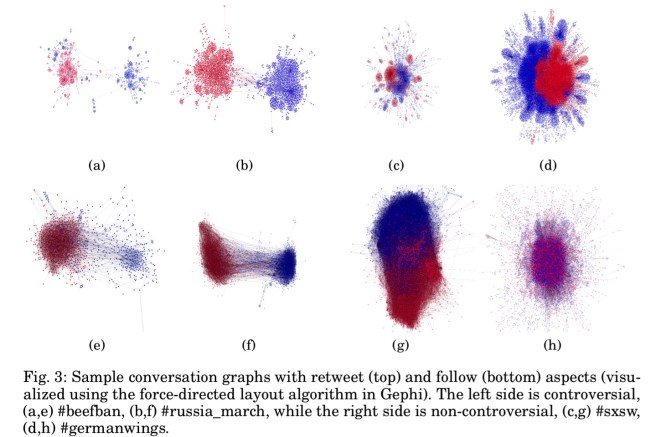
No need to introduce any novelty here. The authors use the standard METIS algorithm and ask it to create two partitions. Here are visualisations of the results for: #beefban, #russia_march (both controversial) and #sxsw and #germanwings (not controversial). The top row shows these partitioned on retweets, and the bottom row by followers, indicating that both of these contribute to the predictive power.
Controversy scores
Of several evaluated measures to determine an overall controversy score, random walk based measures were found to work the best. In a controversial discussion, there are likely to be authoritative users on both sides, as evidenced by a large degree in the graph. A large (high) degree means that a user has received a large number of endorsements on the topic. The random walk controversy measure captures how likely it is that a given user will be exposed to authoritative content from the other side. Let the two partitions created by METIS be called X and Y.
We define the Random Walk Controversy (RWC) measure as follows. Consider two random walks, one ending in partition X and one ending in partition Y, RWC is the difference of the probabilities of two events: (i) both random walks started from the partition they ended in and (ii) both random walks started in a partition other than the one they ended in.

RWC will be close to one when the probability of crossing sides is low, and close to zero when the probability of crossing sides is comparable to that of staying on the same side. We can therefore view it as the probability that the topic is controversial (polarising).
RWC can be calculated using Monte Carlo sampling, but collecting a large number of samples (e.g., 10,000) is computationally expensive. A variant of RWC called random walk with restart was found to have the same predictive power as RWC, while being much cheaper to compute. RWC with restart (RWR) avoids the problem of getting stuck in dangling vertices (which are common in the star-like graphs created when a few authoritative users generate information that spreads through the graph). A walk that starts in X will be restarted from a random vertex in X when it reaches a dangling vertex (a vertex with no outgoing edges). Moreover, high-degree vertices have all of their outgoing edges removed so that walks restart upon reaching them.
In tests, RWR and RWC gave almost identical results, but RWR is up to 200 times faster.
It is also possible to define a controversy score for an individual user, in the range -1 to 1. 0 represents a balanced user, and scores of +/- 1 represent the extremes for both sides. Two measures for this are proposed – both based around the idea of starting random walks at the user and seeing either which partition the walk ends up in, or how long it takes to hit high-degree vertices on either side.
Quantifying controversy in the wild
There is a good evaluation in the paper on previously available datasets which enables comparisons with alternative methods (RWC/R does better). The authors also use the system on live Twitter data:
To check whether our system works in a real-world setting, we deploy it in the wild to explore actual topics of discussion on Twitter and detect the ones that are controversial. More specifically, we obtain daily trending hashtags (both US and worldwide) on the platform for a period of three months (June 25 – September 19, 2015). Then, we obtain all tweets that use these hashtags, and create retweet graphs. Finally, we apply the RWC measure on these conversation graphs to identify controversial hashtags. The results can be explored in our online demo.
Most hashtags are not controversial. Controversial hashtags identified by the system include #whoisburningblackchurches, #communityshield, and #nationalfriedchickenday (the latter being a debate between meat lovers and vegetarians).
Application
Now that we know how to detect controversy, wouldn’t it be great if tweets in your timeline with a controversy score over some threshold were automatically flagged as such? And furthermore, if your feed is then dominated by tweets only from one partition of a topic over some time window, a filter bubble warning is shown? This would handle the awareness part of the problem. The second part of the problem is introducing balance back into your feed. Tomorrow we’ll look at some follow-on work from WSDM 2017 that can help with that…

“but we can’t define a topic just be a single hashtag…”: should this be “…just to be a single” or “just by a single hashtag”? Understandable as it is, but with a little work.
Yes it should, typo fixed, thanks!