Preemptive intrusion detection: theoretical framework and real-world measurements Cao et al, HotSoS 2015
Phuong Cao (the first author of this paper) got in touch following my review of DeepDive to say “Thanks for the review on DeepDive. I was inspired by that paper to apply factor graph on detecting intrusions at an early stage…” Preemptive intrusion detection details the results.
AttackTagger is a factor-graph based framework for preemptive detection of system attacks (i.e., before any system misuse has actually occurred). The evaluation was performed against the logs from real attacks on NCSA over a six-year period. AttackTagger detected the 74% of the attacks, the majority before the point at which system misuse occurred.
The problem
Attacks on a computer system take place in a number of stages. For example, in 2008 attackers logged onto a gateway node at NCSA using comprised account credentials, they downloaded an executable, compiled it and escalated to root privileges by exploiting a kernel bug on the compromised node. They then injected credential-collecting code into SSHd and forced it to restart. The credentials of anyone logging into the gateway node were subsequently leaked to the attackers.
Not all of these activities were captured in the system logs, but some were:

Many Intrusion Detection Systems (IDSs) use per-event classifiers, which use rules or signatures to identify malicious users based on individual events. AttackTagger reasons about the stages of an attack collectively, which gives it greater predictive power. For example, in the scenario above, a remote login by itself is not enough to tag the corresponding user state as malicious, but we might tag it as ‘suspicious.’ Later activities can then be tagged differently for ‘suspicious’ users than for ‘benign’ users.
The goal is to identify malicious users as soon as possible, and ideally before any damage is done.
A quick factor graph recap
The family of probabilistic graphical model techniques for modelling graph-based dependencies among random variables includes Bayesian Networks, Markov Random Fields, and Factor Graphs. In section 3 of the paper Cao et al. compare these three approaches and show that Factor Graphs are both simpler and more expressive for their use case.
A Factor Graph has two types of nodes: variable nodes, and factor nodes. The factor nodes represent functions identifying functional relationships between variables. An edge connects a factor node and a variable node if that variable is used by the factor function.
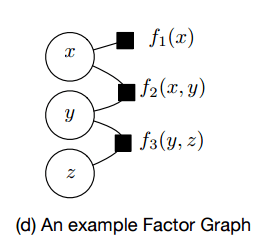
The factor functions can be used to represent causal or non-causal relations. AttackTagger uses factor functions to capture the relations between a user state and events, between a user state and earlier events or states, and between a user state and a user profile:
- event-state factor nodes f<sub>e</sub>(s,e) capture the relation between an event e and the hidden state variables s
- state-state factor nodes f<sub>s</sub>(e<sup>t-1</sup>,e<sup>t</sup>,s<sup>t-1</sup>,s<sup>t</sup>) capture the relation between hidden states now (t) and earlier (t-1), and previous events (t-1) and an event now (t).
- user-state factor nodes f<sub>u</sub>(U, e<sup>t-1</sup>, s<sup>t-1</sup>) capture the relation between a user profile U, an event, and a hidden state.
A user state may be benign, suspicious, or malicious.
A factor graph model of an attack looks something like this:

Variable nodes (circles) correspond to either observed variables (U, e) or hidden variables (s).
Examples of user profile attributes and events include:

How AttackTagger works
We’ll talk about how AttackTagger builds factor graphs, and what factor graphs it builds in just a moment. For the moment, let’s just assume we have one.
To identify malicious users, AttackTagger infers the most probable values of the user state in the sequence S<sup>t</sup> using the constructed factor graph. Specifically, is the user state s<sup>t</sup> = suspicious, then the user is allowed to operate in the target system under close monitoring (e.g. logging network traffic of the user or logging user commands); if the user state s<sup>t</sup> = malicious, the user is identified as an attacker and actions are taken to disconnect the user from the target system (e.g. terminating the user’s active network connections or disabling the user account). Our inference is based on the join probability distribution on the Factor Graph.
You can use a brute-force approach to calculate the values of the hidden variables (their probabilities) but this is costly. Instead, as was done in DeepDive, AttackTagger uses Gibbs sampling, which can produce results in near real-time.
A Gibbs sampler runs over N iterations. It starts with a random user state sequence at iteration 0. At iteration 1, it samples a new user state, starting at user state s<sup>0</sup>. That sampling process is conditioned on the value of the previous user state sequence and the Factor Graph. In the next step, this sampling process is repeated for the next user state s<sup>i</sup> and so forth, until it reaches the last user state s<sup>n</sup>. That concludes the sampling process for a user state sequence at iteration 1. The Gibbs sampler repeats the iteration process and stops when it reaches one of two termination conditions: i) N iteration, or ii) the user state sequence convergences.
So that’s the heart of the system. Now let’s look at the overall flow.

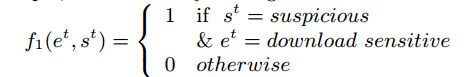
Events are extracted from user logs, and then experts define the set of factor functions to be used for the system in question. For example, we might define event-state factor functions of the form “if e happens then s“, such as “if a user downloads a file with a sensitive extension then the user is suspicious.” That would look like this:
Given a sequence of user events E and a defined set of factor functions F, a Factor Graph is automatically constructed for the user, namely per-user factor graph. Each factor connects its corresponding user events and user states.
As events are observed, the factor graph evolves over time:
Given a per-user Factor Graph, a possible sequence of user states S is automatically evaluated through a summation of the weighted factor functions F… The sequence of user states that has the highest score represents the most probable sequence corresponding to the event sequence observed until that point.
Comprised users are determined when the user state at the time of an observation is malicious.
Using our framework, security analysts can quickly examine user states to identify the transition of a user from benign to suspicious and malicious, without having to manually examine a large amount of raw logs. As a result, security analysts have more time to respond to security incidents or to increase additional monitoring of suspicious users to uncover potentially unauthorized activities.
Detecting attacks on the NCSA
AttackTagger was evaluated using data from 116 real-world security incidents observed at NCSA between 2008 and 2013. The incidents included tampering with system services to steal credentials, misusing systems to build botnets, send spam etc., and remote exploitation to gain system shells. Most attacks were multi-staged and spanned 24 to 72 hours. The constructed factor graphs were dense with many edges, since the factor functions link all of the events in the user event sequence. The weights for all factor functions were just set to 1, no training was performed to tune them. Despite this use of equal factor weights, the model still performed well:
Our model was able to detect most of the malicious users (74.2%) relatively early (i.e. before system misuse). More importantly, our model uncovered a set of six hidden malicious users, which had not been discovered by NCSA security analysts.
Here’s an example of how user states progressed during detection of an attack:

16 out of 62 malicious users were not detected by AttackTagger – mostly due to a lack of events being observed in the logs. 13 out of 1,253 users were wrongly recorded as malicious (false positives). AttackTagger took 530ms on average to classify an event.

One thought on “Preemptive intrusion detection: theoretical framework and real-world measurements”
Comments are closed.