REPT: reverse debugging of failures in deployed software Cui et al., OSDI’18
REPT (‘repeat’) won a best paper award at OSDI’18 this month. It addresses the problem of debugging crashes in production software, when all you have available is a memory dump. In particular, we’re talking about debugging Windows binaries. To effectively understand and fix bugs, a developer wants to be able to follow the path leading up to the point of failure. Not just the control flow, but also the data values involved. This is known as reverse debugging. What’s so clever about REPT is that it enables reverse debugging without the high overheads of record/replay systems (typically up to 200%). It combines low overhead hardware tracing (Intel PT) to record a programs control flow, with a novel binary analysis technique to recover (a very good percentage of) data flow information. Evaluated on 16 real-world bugs in software such as Chrome, Apache, PHP, and Python, REPT enabled effective reverse debugging for 14 of them, including 2 concurrency bugs.
REPTs offline binary analysis and reverse debugging is integrated into WinDbg, and the Windows Error Reporting service (WER) is enhanced to support REPT so that developers can request Intel PT enriched memory dumps.
We have received anecdotal stories from Microsoft developers in using REPT to successfully debug failures reported to WER. The very first production bug that was successfully resolved with the help of REPT had been left unfixed for almost two years because developers could not reproduce the crash locally… With the reverse engineering enabled by REPT, the developer was able to step through the function based on the reconstructed execution history and quickly find out the root cause and fix the bug. In summary, a two-year-old bug was fixed in just a few minutes thanks to REPT.
Reverse debugging and Intel PT
To be practical for production deployment REPT needs to:
- Impose a very low runtime performance overhead
- Recover execution history accurately and efficiently
- Work with unmodified source code/binaries
- Apply to broad classes of bugs including e.g. concurrency bugs
To address the first requirement REPT uses the per-thread circular buffer mode of Intel PT to capture traces (whole execution tracing introduces too much performance overhead). When a traced process fails, its final state and the recorded Intel PT traces are saved in a single memory dump. The overhead of Intel PT in this mode has been shown to be below 2% for a range of applications.
Starting from this memory dump which gives us the control flow and final memory state the main task of REPTs offline analysis is now to recover the data flow. Working solely from the memory dump avoids the need for any modifications to existing programs. Performing analysis on instructions at the binary level means REPT is agnostic to programming languages and compilers.
Recovery challenges
In an ideal world, given the final memory state and the instruction sequence we would simply walk backwards over the instructions and recover previous states. In practice, things aren’t quite so simple.
- Many instructions are irreversible (e.g.
xor rax, rax) since they destroy information. - Many destination addresses for memory writes cannot be determined statically.
- It’s not always possible to infer the order of concurrent shared memory accesses.
REPT has to overcome all of these hurdles.
Reversing instructions
Some instructions are reversible, so we can move backwards through the instruction sequence and recover state based on them. For example, if we have state { rax=3, rbx= 1} and the instruction add rax, rbx then the state immediately prior to execution of that instruction must have been { rax=2, rbx=1}.
Many instructions are irreversible. But if we have been able to recover some state earlier in the instruction sequence we may be able to work forwards from that. REPT combines these two ideas, working iteratively backward and forward through the instruction sequence to recover data values, until no new values can be recovered.
Consider the following example:
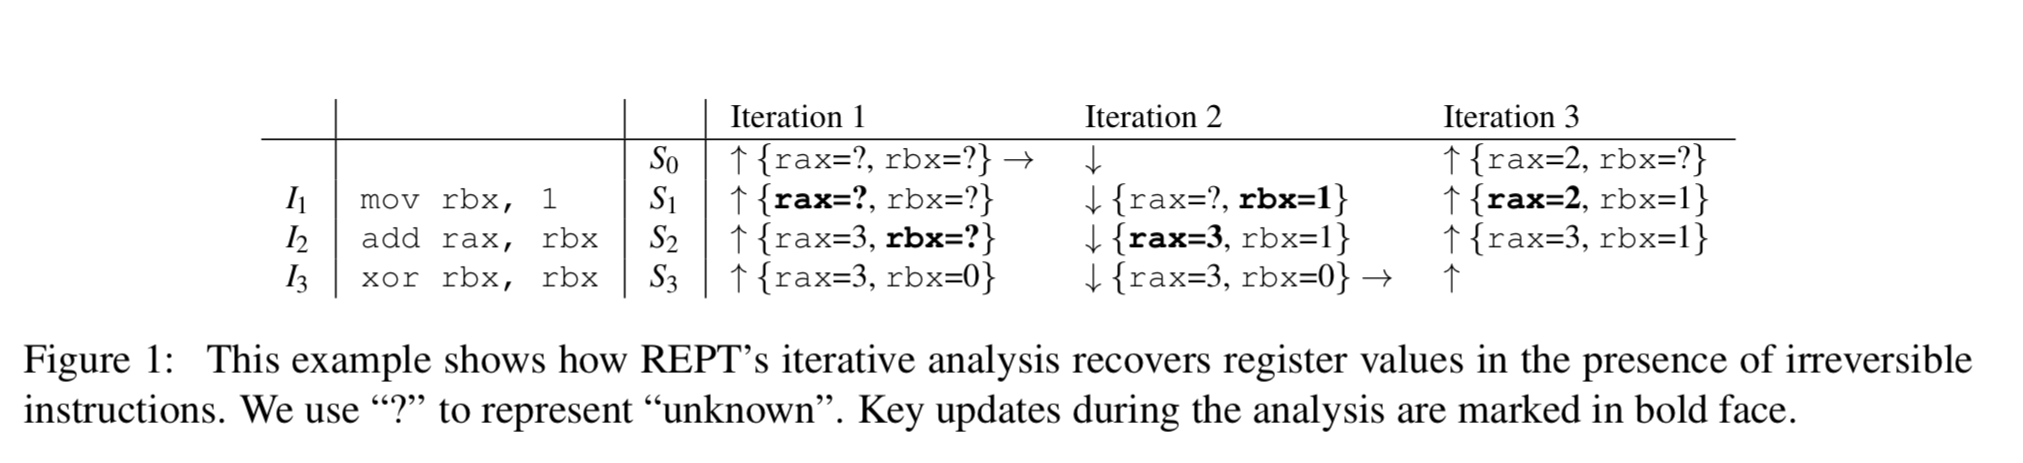
In iteration 1 we start with the state {rax=3, rbx= 0} and work backwards through the instruction sequence, filling in what we can infer (e.g., that rax had value 3 after the execution of 
Iteration 2 begins at the start of the instruction sequence and works forward. Here we can deduce that rbx must be 1 after the execution of instruction 
Iteration 3 works backwards again, and this time we’re able to fill in another gap in our knowledge and deduce that rax must be 2 after the execution of
Recovering memory writes
So far we’ve been dealing with instructions that don’t access memory. Things get a little more complex with memory accesses in the picture.
For a memory write instruction whose destination is unknown we cannot correctly update the value for the destination memory. A missing update may introduce an obsolete value, which would negatively impact subsequent analysis.
REPT uses error correction to help figure out write destinations. It uses memory values that are possibly valid (assuming they haven’t been overwritten) to infer other values using the procedure we just examined. If the inferred values later turn out to be invalid based on conflicts then we start an error correction process. Consider the following example, where ‘g’ represents the memory address of a global variable:
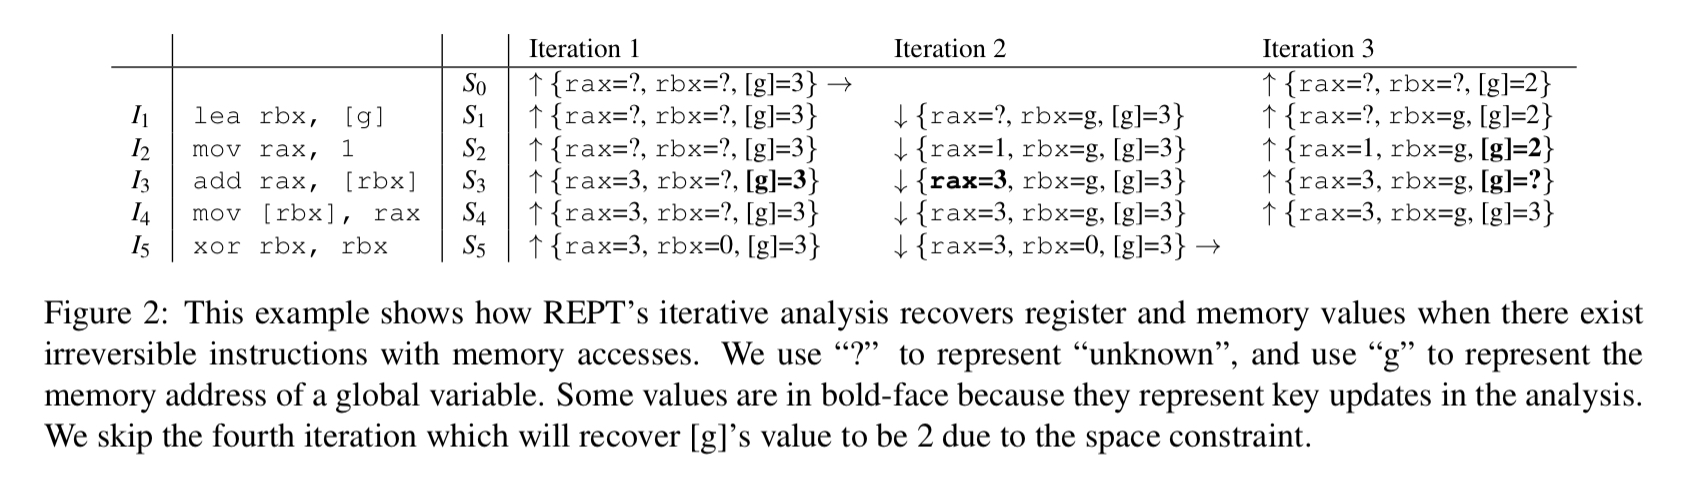
In the first iteration we work backwards as before, and since we don’t know the value of rbx for 
In the second iteration we do the forward analysis and uncover that rax must be 1 after rax after instruction 
Our analysis keeps the original value of 3 because it was inferred from the final program state which we assume is correct. In the third iteration of the backward analysis, based on
rax’s value before and after the instruction[g]’s value to be 2.
While performing the forward and backward analysis, REPT maintains a data inference graph capturing everything we know about registers and memory locations accessed by instructions. There are separate nodes in the graph for reading from an address/register (use nodes) and for writing (def nodes). A value edge from node A to node B means that REPT’s uses A’s value to infer B’s. An address edge from node A to node B means that A’s value is used to compute B’s address.
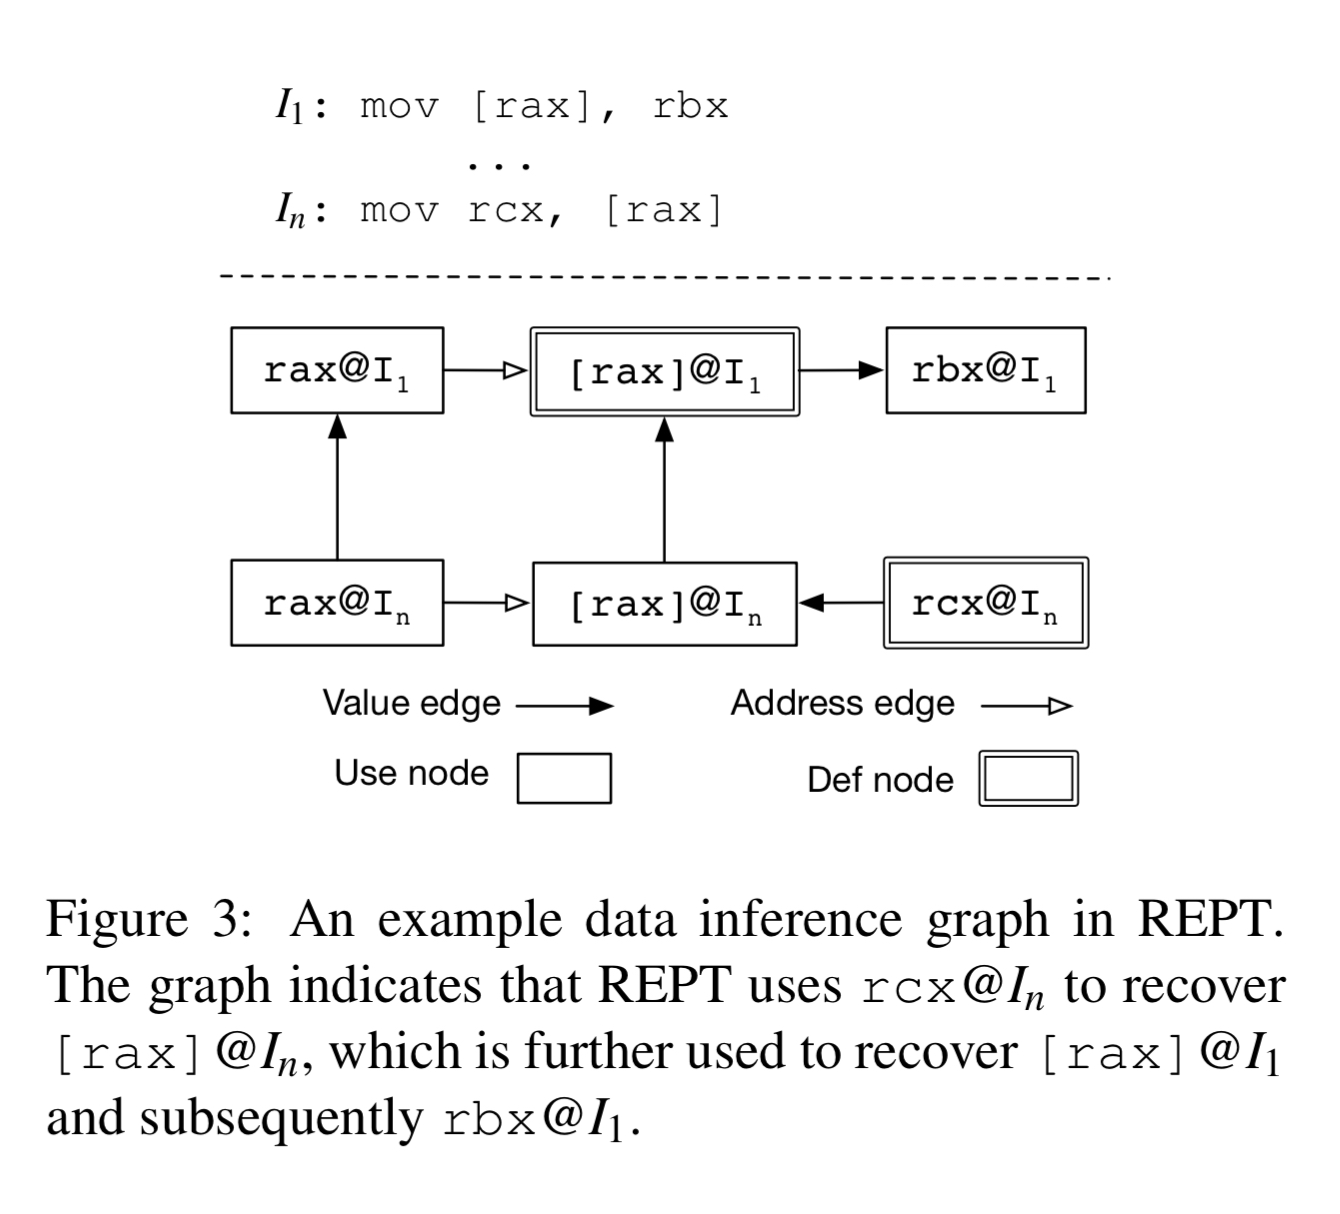
Within the graph, value conflicts occur when an inferred value does not match the existing value (the example we just walked through). An edge conflict occurs when a newly identified def node of a memory location breaks a previously assumed def-use relationship. When either type of conflict is detected the invalidation process is run. Starting from the initial node we propagate ‘unknown’ (see section 3.3.2 in the paper for details) to remove incorrect assumptions, and then we get back to our forward and backward analysis phases again.
Handling concurrency
We have yet another issue when multiple instructions sequences are executed simultaneously on multiple cores, because there are a very large number of ways to order those instructions.
The timing information from Intel PT is pretty good, and we can use that to establish a partial order among instructions sequences (if one subsequence’s start time is after another subsequence’s end time we can infer their relative execution order). That may still leave us with a (smaller) set of concurrent subsequences.
Given multiple instruction sequences executed simultaneously on multiple cores, REPT first divides them into subsequences, then merges them into a single conceptual instruction sequence based on the inferred orders. For two subsequences whose order cannot be inferred, REPT arbitrarily inserts one before the other in the newly constructed sequence.
The arbitrary selection can only matter if there are writes, in which case REPT removes inference edges in the constructed graph to limit the use of the uncertain memory accesses during inference.
Our observation is that REPT’s analysis works as long as there are no two separate concurrent writes such that one affects the inference of another’s destination. We acknowledge that this possibility exists and depends on the granularity of timing information. Given the timestamp granularity supported by modern hardware, we deem this as a rare case in practice.
Evaluation
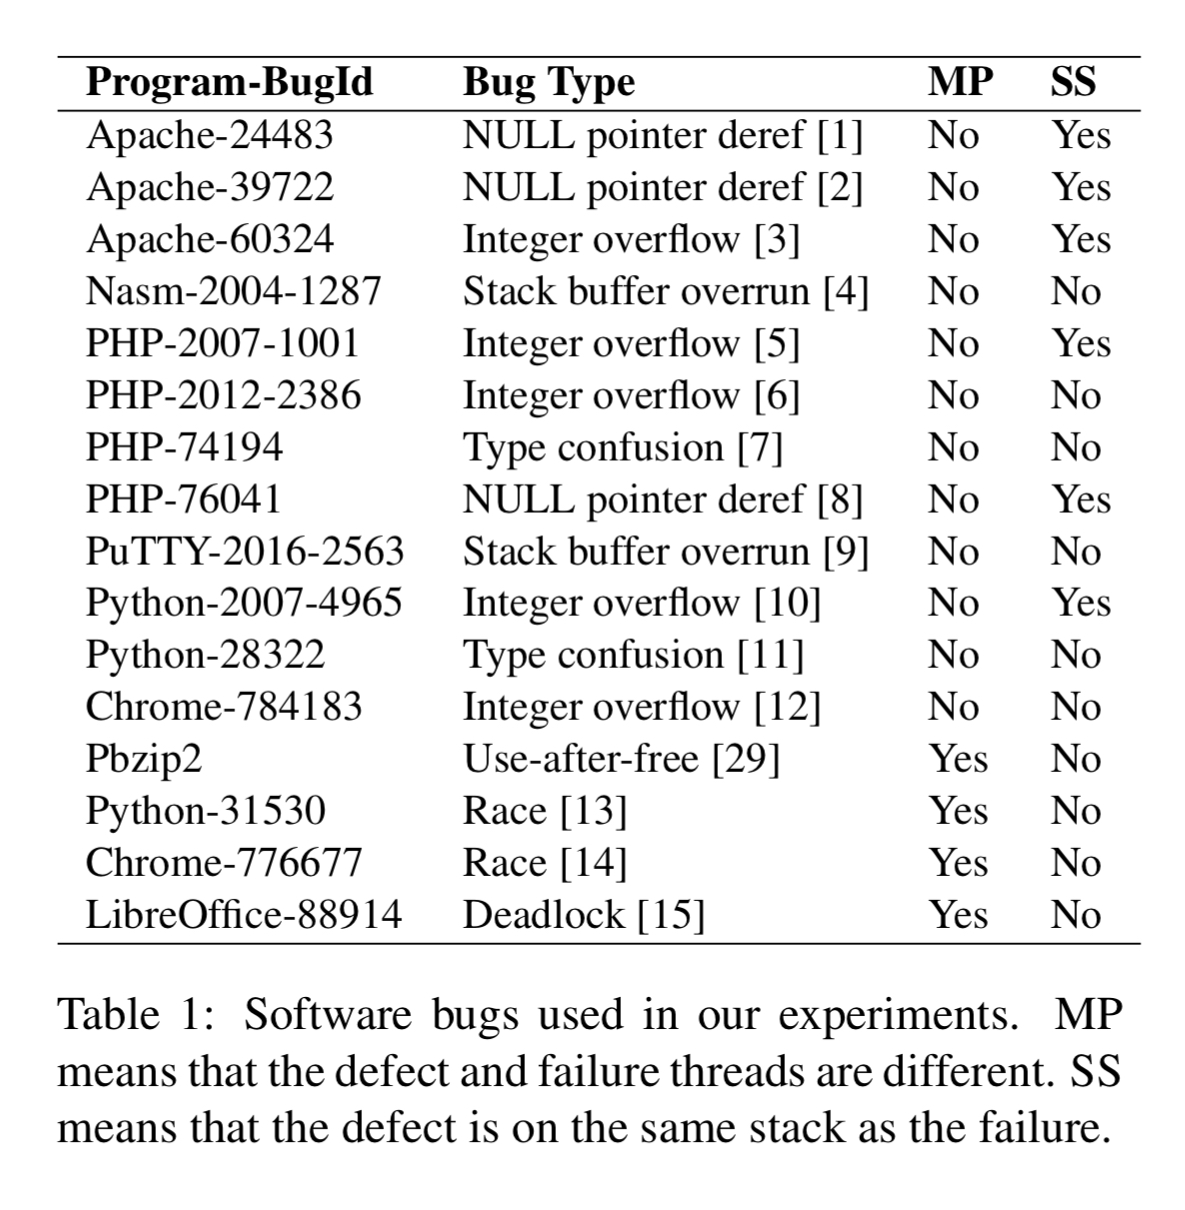
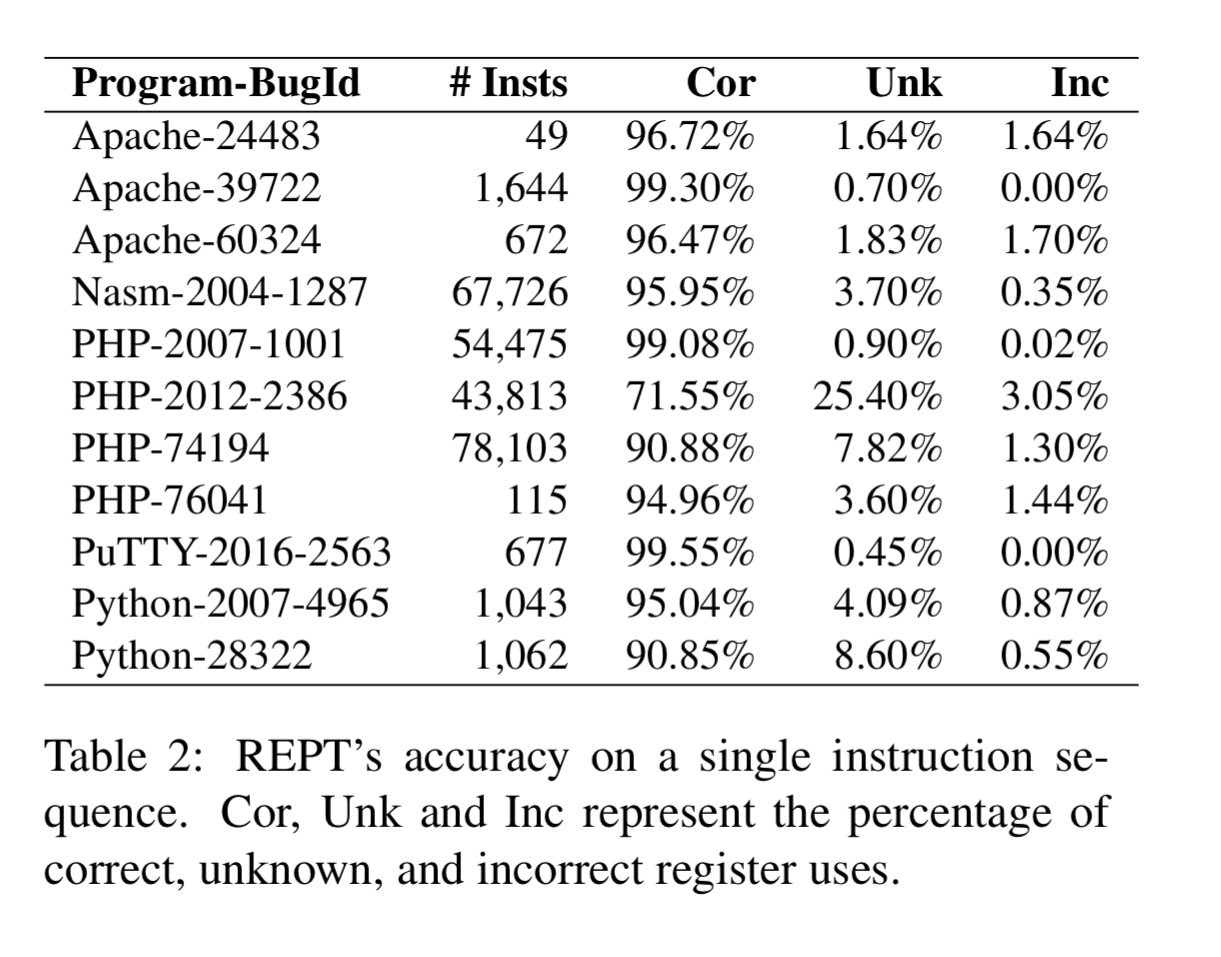
REPT is evaluated on failures caused by 16 real-world bugs as shown in the table below.
Intel PT was configured at the most fine-grained timestamp logging level, and a circular buffer of 256K bytes per thread. Where applicable, Time Travel Debugging (TTD) was used to capture and establish ground truth of data values.
Starting with experiments on a single thread, REPT is able to correctly infer values with high accuracy (above 90% for tens of thousands of instructions). PHP-2012-2386 is an outlier here as it involves a large number of memory allocations right before the program failure.
REPT is then evaluated on two race condition bugs (Pbzip2 and Python-315330) to test multi-thread accuracy. For Pbzip2 95.33% of values between the defect and the failure are recovered correctly. For Python-315330 only 75.72% of values are recovered. This lower score is attributed to the large number of instructions (over half a million) between the defect and the failure in the Python case.
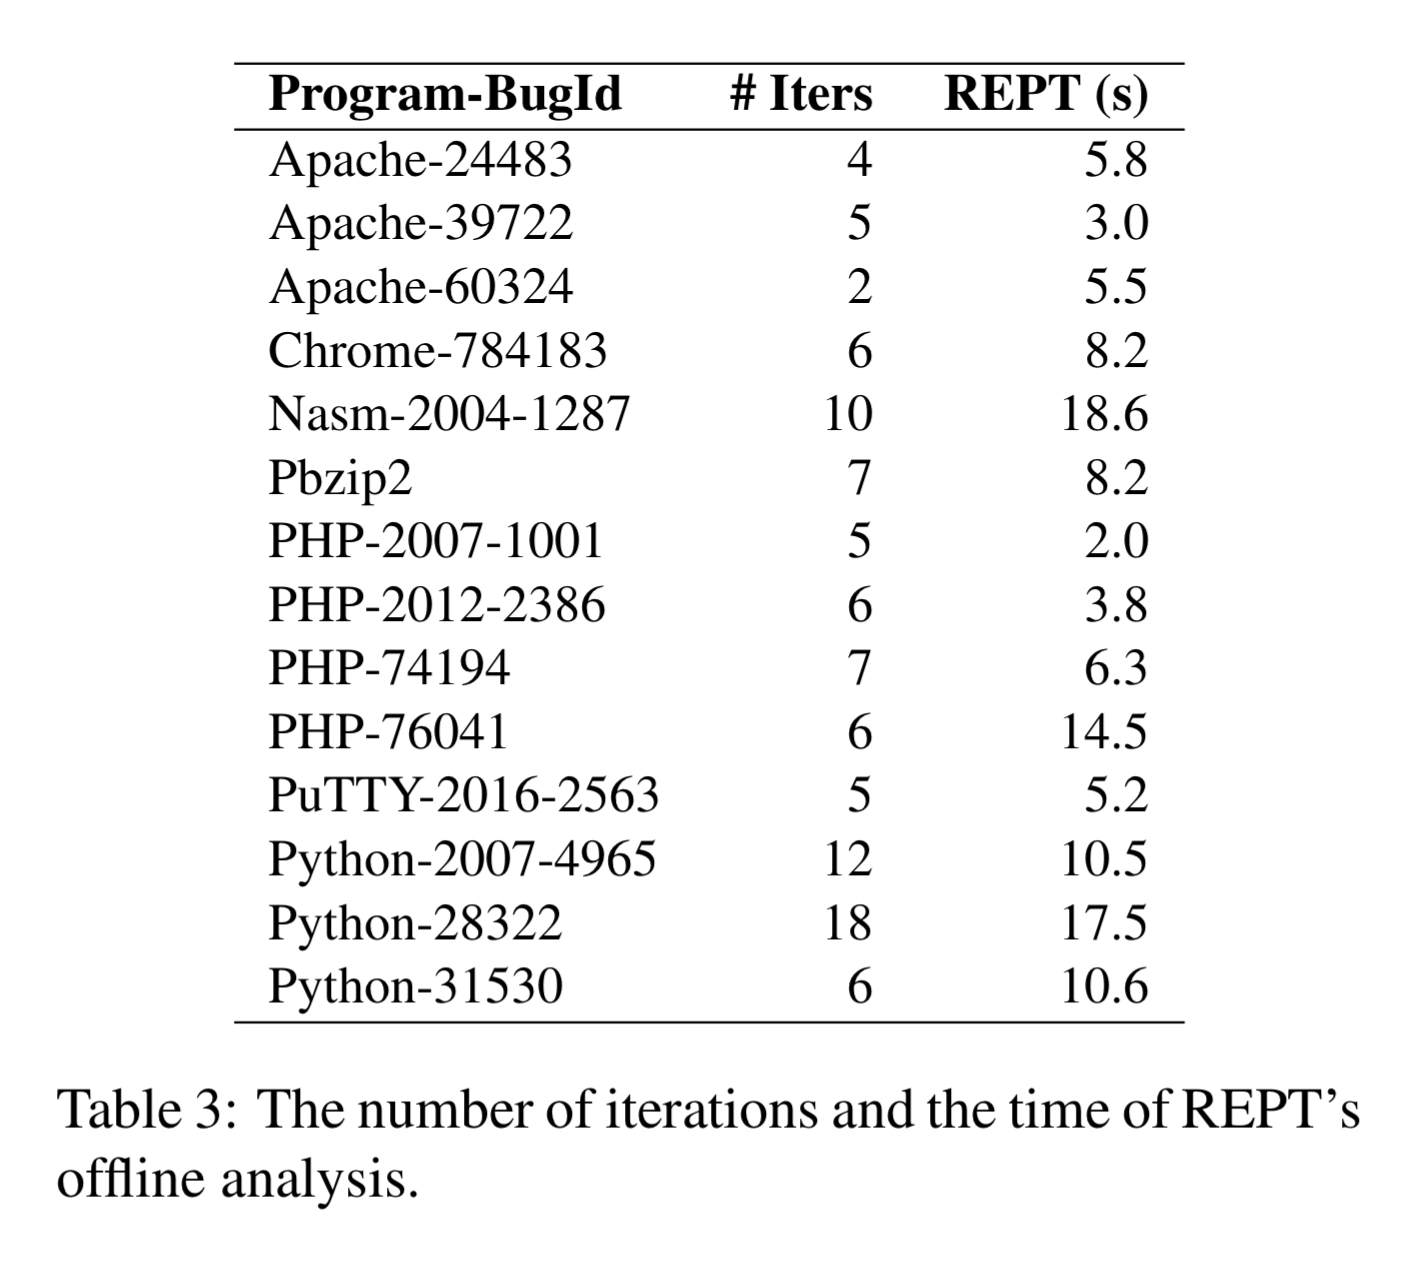
The runtime overhead of Intel PT is below 2%. The offline analysis running on a single quad-core machine with 16GB RAM completes in under 20 seconds for all 14 bugs that REPT can successfully address.
There are 2 out of the 16 bugs were REPT is unsuccessful. REPT doesn’t work for Chrome-776677 because the collected trace contains an in-place code update for jitted code which fails Intel PT trace parsing. REPT doesn’t work for LibreOffice-88914 because it is a deadlock bug triggering an infinite loop that fills the circular buffer and causes the prior program history to be lost.
In addition to reverse debugging, we believe one can leverage the execution history recovered by REPT to perform automatic root cause analysis. The challenge is that the data recovery of REPT is not perfect, so the research question is how to perform automatic root cause analysis based on the imperfect information provided by REPT.

This looks fantastic. Any idea how close this technology is to being available outside the research group?
Hi Thanks for the paper,
I was under the impression you could already do reverse debugging through gdb with Intel PT. I even think I saw some patch to support reverse debugging on core dumps with Intel PT (which I think are available on Linux of asked ?). Some info (2015) on the introduction of Intel pt in the Linux kernel https://lwn.net/Articles/648154 and ecosystem.
Great tech, and interesting that AMD doesn’t have such tech yet.