Capturing and enhancing in situ system observability for failure detection Huang et al., OSDI’18
The central idea in this paper is simple and brilliant. The place where we have the most relevant information about the health of a process or thread is in the clients that call it. Today the state of the practice is to log and try to recover from a failed call at the client, while a totally separate failure detection infrastructure is responsible for figuring out whether or not things are working as desired. What Panorama does is turn clients into observers and reporters of the components they call, using these observations to determine component health. It works really well!
Panorama can easily integrate with popular distributed systems and detect all 15 real-world gray failures that we reproduced in less than 7s, whereas existing approaches detect only one of them in under 300s.
Panaroma is open source and available at https://github.com/ryanphuang/panorama.
Combating gray failures with multiple observers
Panaroma is primarily design to catch gray failures, in which components and systems offer degraded performance but typically don’t crash-stop. One example of such a failure is a ZooKeeper cluster that could no longer service write requests event though the leader was still actively exchanging heartbeat messages with its followers. Detecting gray failures typically requires observing a component from multiple perspectives.
In this paper, we advocate detecting complex production failures by enhancing observability (a measure of how well component’s internal states can be inferred from their external interactions)… when a component becomes unhealthy, the issue is likely observable through its effects on the execution of some, if not all, other components.
In the ZooKeeper incident example, even though the ZooKeeper heartbeat detectors did not uncover the partial failure, the request time-outs in the client Cassandra process were certainly noticed!
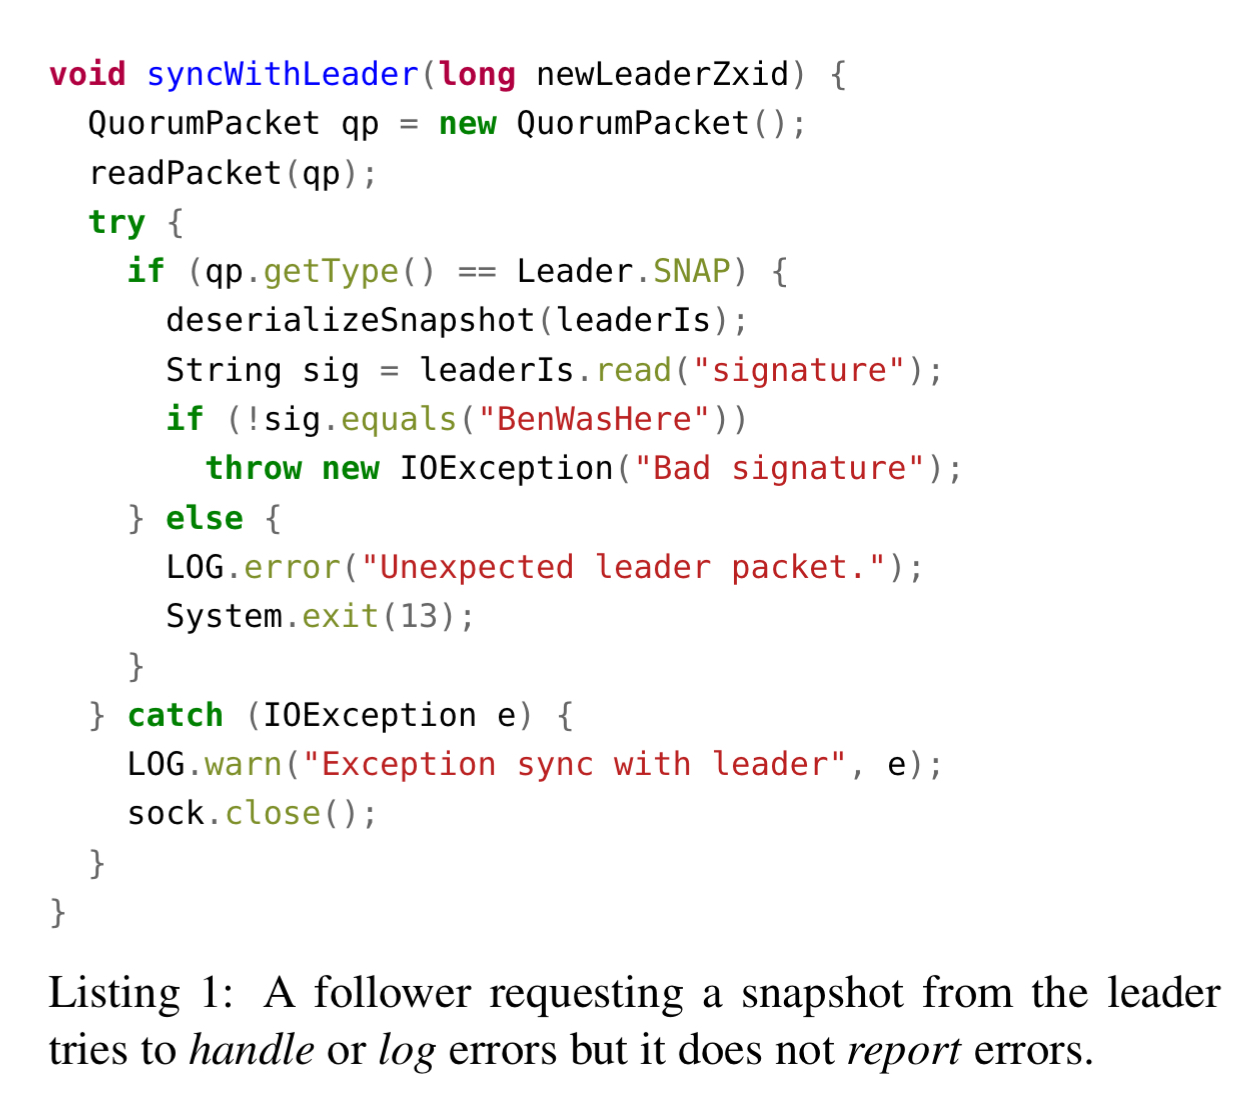
Client processes are well placed to observe issues in providers, but their exception handling code typically looks something like the fragment below, handling an error (or at least logging it!), but not reporting it to any health management system.
Collaborative failure detection is not a new idea, but detection is normally done within peers or layers.
Panorama pushes the detection scope to an extreme by allowing any thread in any process to report evidence, regardless of its role, layer, or subsystem. The resulting diverse sources of evidence enhance the observability of complex failures.
Panorama’s high-level design
Instead of separate monitoring code measuring superficial signals, Panaroma enhances existing client code that lies near the boundaries between components (i.e., inter-thread and inter-process calls). Based on a static analysis, applications are instrumented to capture and report health observations, which are stored in a co-located local observation store (LOS). A local decision engine in the LOS makes judgements about the status of observed components’ status. Then a central verdict server allows easy querying of judgements and arbitrates amongst the decentralised LOSes.
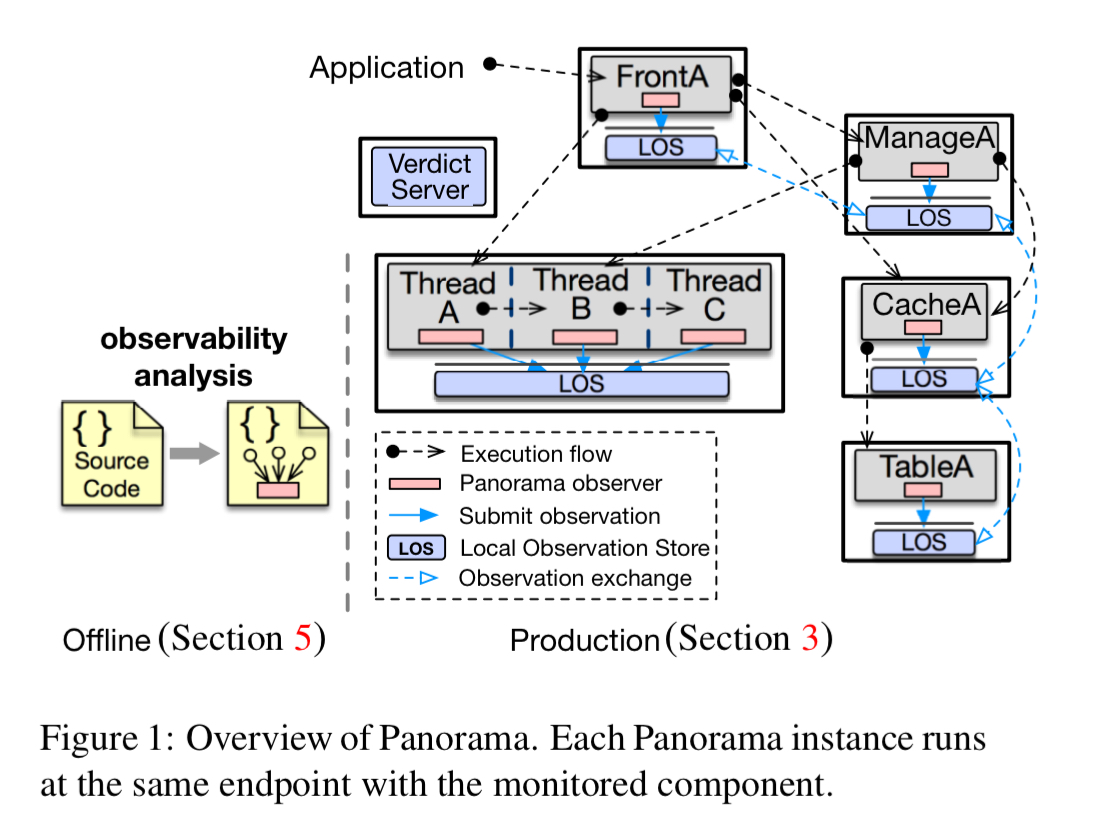
Components using Panorama register with a local Panorama instance and receive a handle to be used for reporting. The Panorama LOS maintains a watch list of subjects being observed by its reporters. Observations about a subject are stored locally in a dedicated table, and also propagated to all LOSes with that subject in their watch list.
The local decision engine analyses the observation log for a subject (which will include both local and remote observations) and records a verdict in the verdict table. The verdict is not propagated because the verdict algorithm is deterministic.
The decision process groups observations about a subject by observer, and then inspects the observations in each group starting with the most recent. For each context (think capture point) in the group a status will be assigned, which is unhealthy if the latest status is unhealthy or the healthy status does not have a recent majority. The summaries across all observers are then aggregated and status decided using a simple majority.
Because these reports come from errors and successes in the execution paths of requestor components instead of artificial, non-service signals, our experience suggests that a simple decision algorithm suffices to detect complex failures.
The status of a component can be HEALTHY, DEAD, and a few levels of UNHEALTHY. It can also be PENDING, which arises when indirection and asynchrony interject between a requestor and provider…
Dealing with indirection and async calls: observability patterns
Say a provider responds immediately to a request, and then goes on to do work in a background thread which crashes. The scheme as discussed so far won’t cope with that scenario. In fact, the simple synchronous request-response pattern is only one of four communication patterns the Panorama team need to deal with:
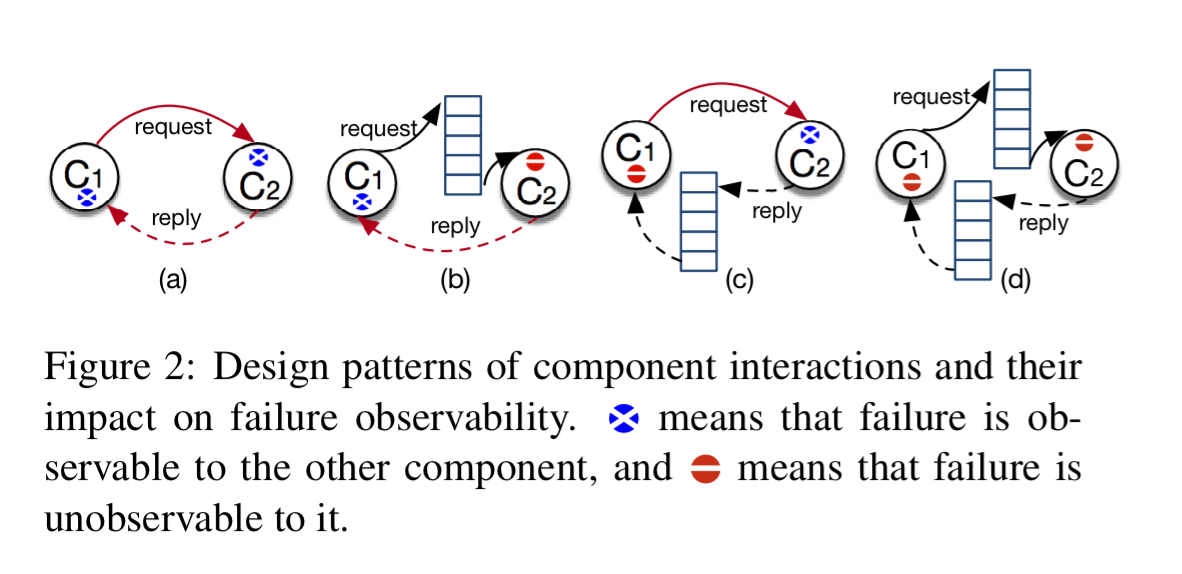
(a) synchronous request response
(b) indirect request, direct reply
(c) direct request, indirect reply
(d) indirect request and reply
Each of these patterns have a different effect on observability. “Placing observation hooks without considering the effects of indirection can cause incompleteness (though not inaccuracy) in failure detection.”
Instrumentation
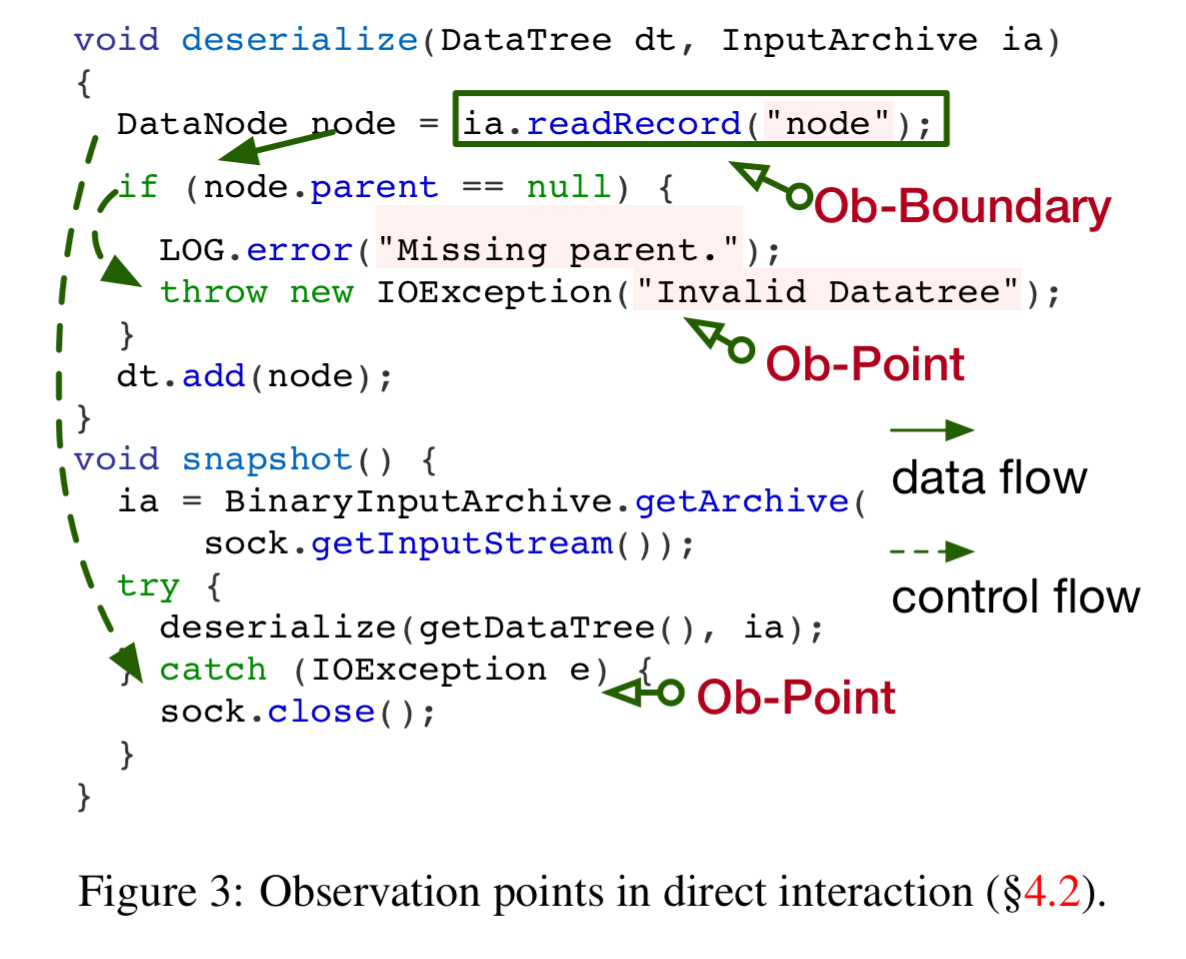
Panorama includes an offline tool that statically analyses a program’s source code (using Soot), finds critical points for observation capture, and injects hooks for reporting observations (using AspectJ – yay!). A typical example of an observation point would be an exception handler invoked when an exception occurs at an observation boundary. We also need positive (i.e. success) observations too of course. Observations are reported to the Panorama library where they are buffered and then sent in one aggregate message.
The indirection patterns are handled by instrumenting both the origin and the sink of split requests.
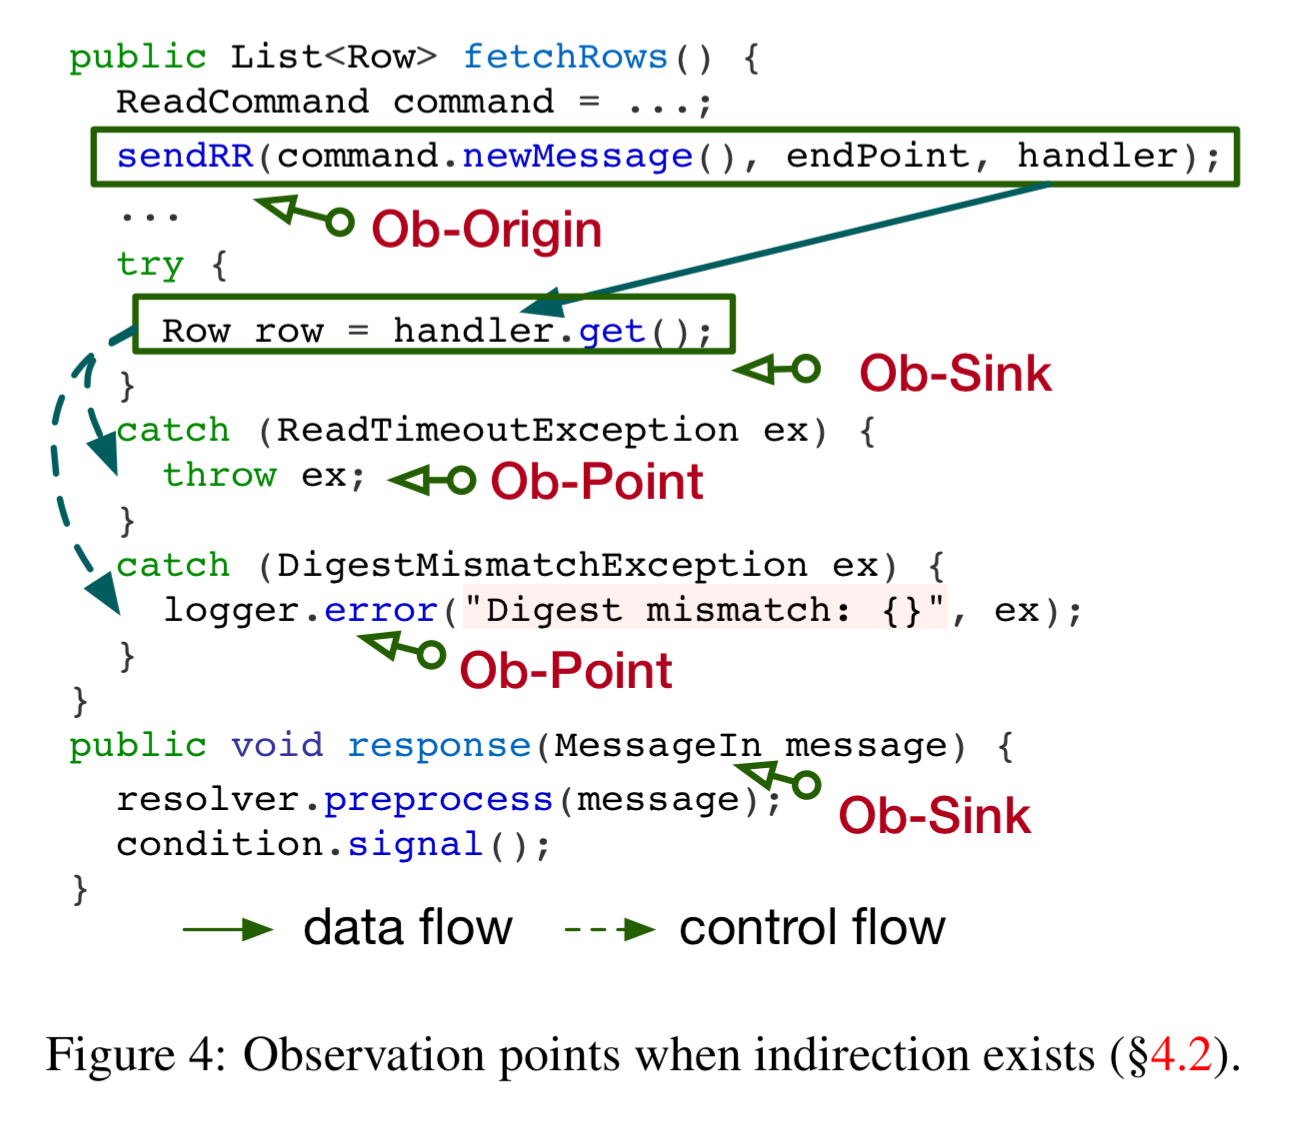
When we have an observation at an origin, but not yet a corresponding sink, this gives rise to the PENDING status we saw earlier. We the sink receives positive evidence a HEALTHY observation will follow.
We find that the ob-origin and ob-sink separation is useful in detecting not only issues involving indirection but also liveness issues.
Evaluation
Panorama was applied to ZooKeeper, HDFS, HBase, and Cassandra, at both the process and thread level. The integration required minimal changes.
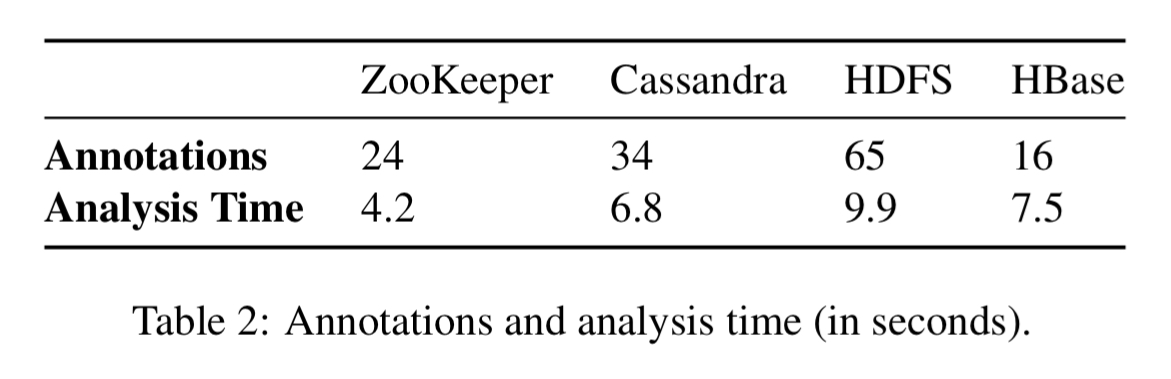
In applying the analyzer to a system, we need annotations about what boundary-crossing methods to start with, what methods involve indirection, and what patterns it uses. The annotation effort to support this is moderate (see Table below). HDFS requires the most annotation effort, which took one author about 1.5 days to understand the HDFS source code, identify the interfaces and write the annotation specification.
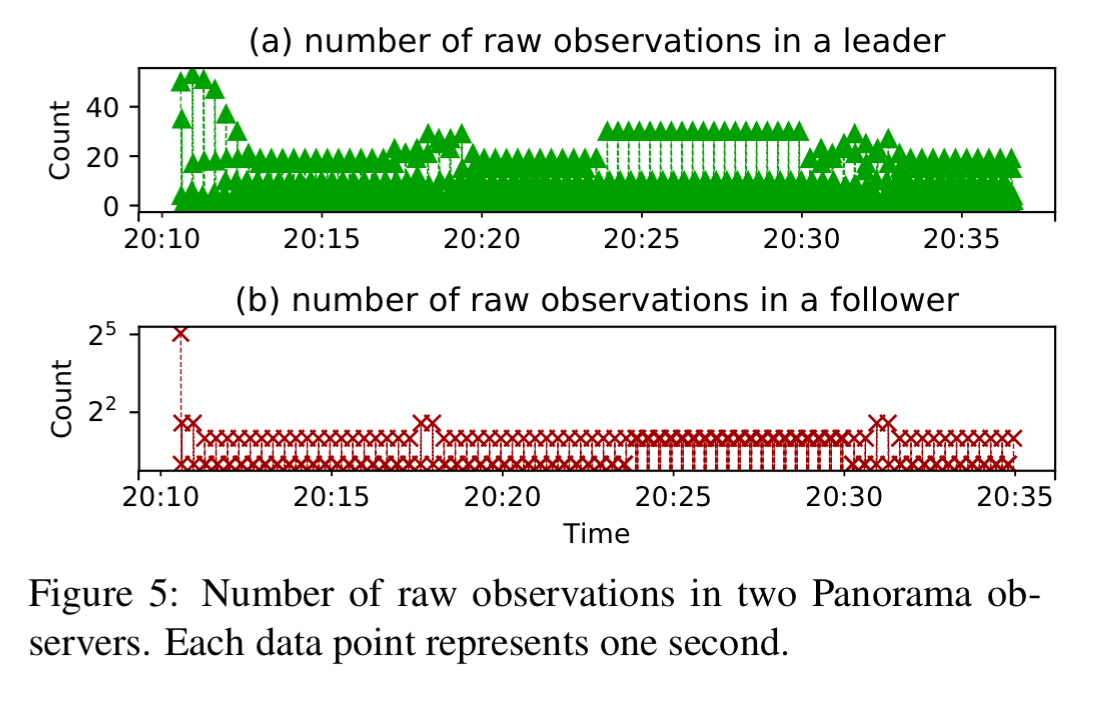
The following figure shows the number of raw observations reported over time from two instrumented processes in ZooKeeper.
Detecting crash failures
Panorama is designed to detect complex failures, not just fail-stop errors, but it had better be able to detect fail-stop issues as well! The authors injected a number of fail-stop faults and measured how long it took Panorama to report them compared to the detection time of the relevant system’s built-in fault detection.
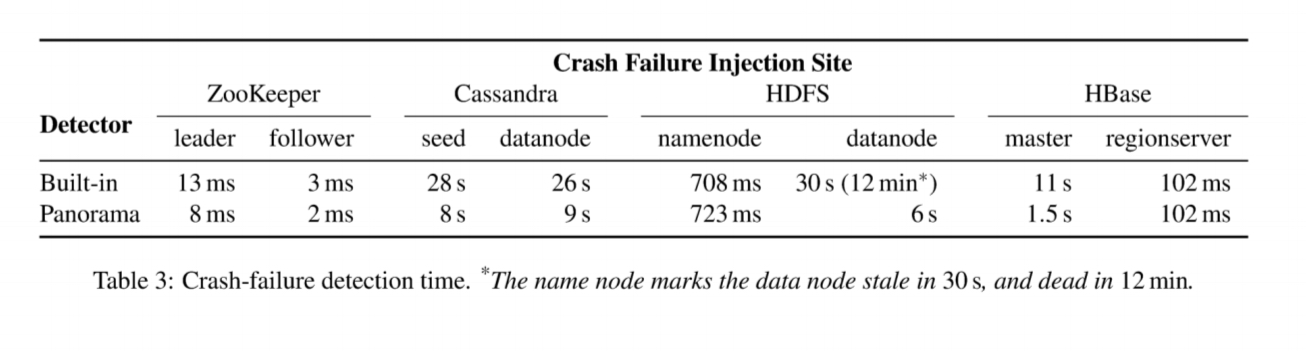
Panorama is always competitive with the built-in detection, and sometimes much faster.
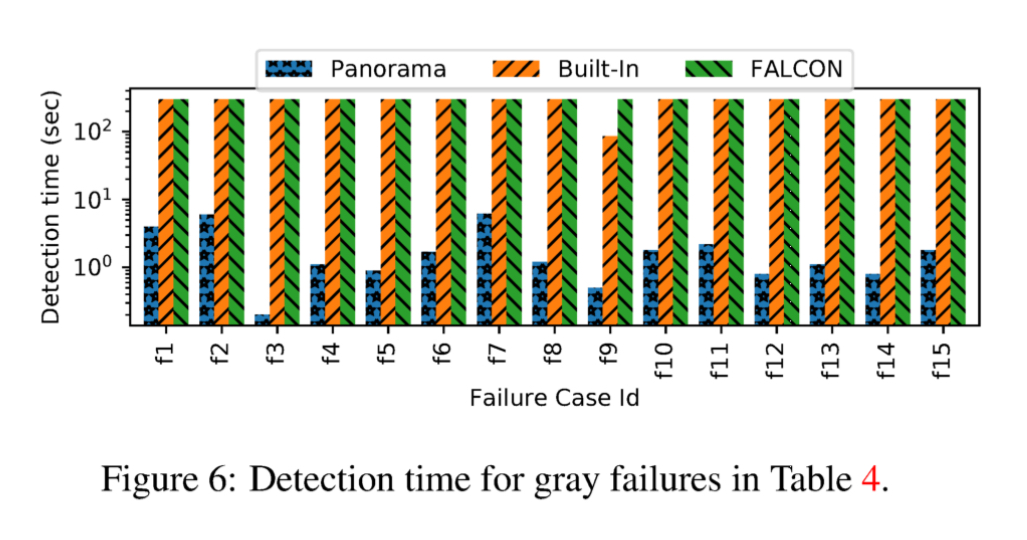
Detecting gray failures
For gray failure testing, the authors reproduced 15 real-world production gray failures across all four systems. Each of these caused severe service disruption when they originally occurred, and in each case the system was still perceived as healthy so no recovery actions were taken.
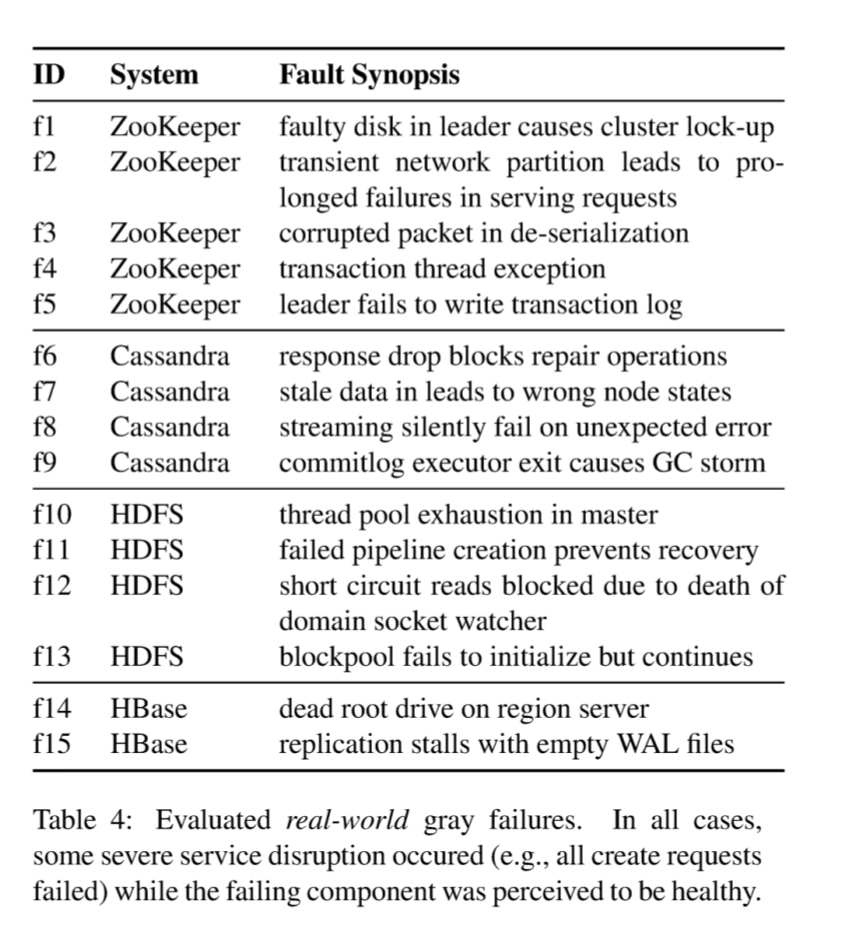
Panorama detects the gray failure in all 15 cases, with detection times between 0.2s and 7s, and most less than 3s.
In addition to detecting the gray failures, Panorama also does a great job of pinpointing the cause of the problem with detailed context and observer information.
False positives?
Because Panorama can gather observations from any component in a system, there is a potential concern that noisy observations will lead to many false alarms. But, empirically, we find that this does not happen….
An observed ZooKeeper ran for 25 hours with multiple clients running a variety of workloads non-stop. In total 797,219 verdicts were generated, of which all but 705 (0.8%) were HEALTHY. All of the negative observations were made during the first 22 seconds of the run when the system was bootstrapping and unstable, the remainder of the 25 hours saw no reported faults.
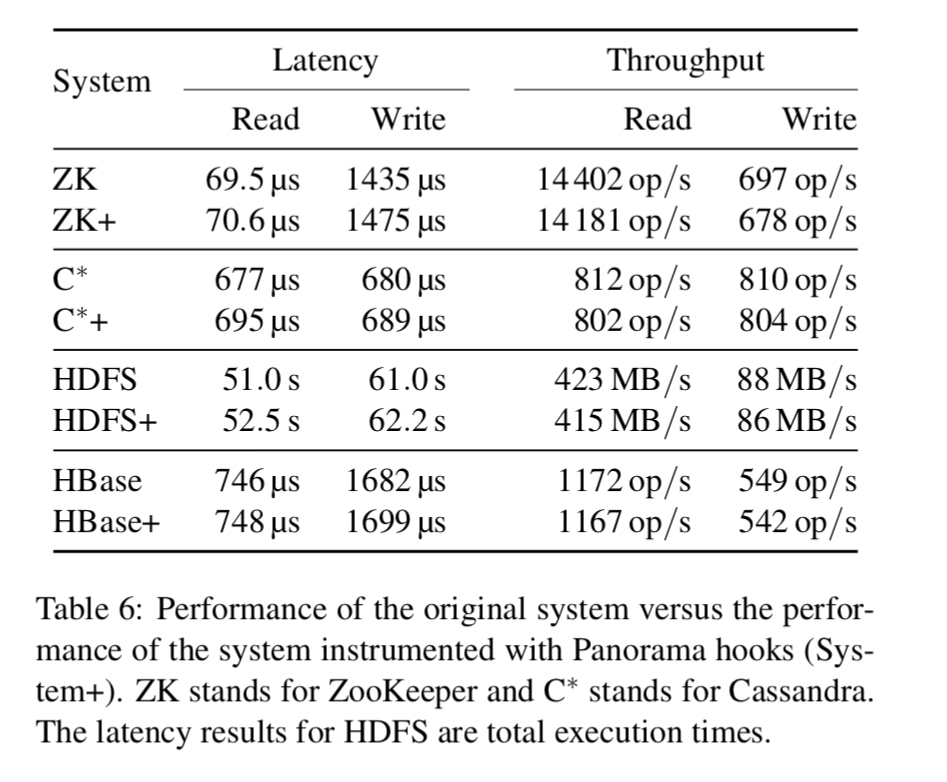
Overheads
When a Panorama instance is active, it consumed about 0.7% of CPU on average, and up to around 50MB of memory for a highly active instance. The latency increase and throughput decrease for each instrumented system is below 3%.
The last word
Panorama proposes a new way of building a failure detecting service by constructing in-situ observers. The evaluation results demonstrate the effectiveness of leveraging observability for detecting complex production failures.
Panorama looks to be the perfect complement to any chaos engineering initiative.

This is an interesting paper, mostly by moving the focus of reporting “failures” out to the requester, using some decision logic and reporting on them. The tooling for statically inserting the reporting points is also interesting.
It really does not address one of the key issues of “gray failures” however, in “detecting” components that are becoming “performance challenged” for whatever reasons. The methods they are using only detect problems with an actual failure (error or timeout).
It would be interesting to marry the reporting technology they describe with the technology I developed using event counters to detect and report on components becoming saturated. I describe the techniques here:
https://billduncan.org/shades-of-grey/
..and decided to call the technique “Saturation Factor” and describe some possible use cases here:
https://billduncan.org/realtime-component-request-deficit/
This simple technique is unmatched for identifying saturation (grey failures) of components with a very high signal to noise ratio, immediately.