Automatic discovery of tactics in spatio-temporal soccer match data Decroos et al., KDD’18
Here’s a fun paper to end the week. Data collection from sporting events is now widespread. This fuels an endless thirst for team and player statistics. In terms of football (which shall refer to the game of soccer throughout this write-up) that leads to metrics such as completed passes, distance covered, intercepts, shots-on-goal, and so on. Decroos et al. want to go one level deeper though, and use the data to uncover team tactics. The state of the art today for tactical analysis still involves watching hours of video footage.
This paper focuses on the problem of detecting tactics from professional soccer matches based on spatio-temporal data.
Now when I think of tactics, a key component in my mind is the team shape and movement of players off the ball. Unfortunately Decroos et al., don’t have the data available to analyse that. So they have to do what they can based on more limited information.
Our dataset consists of event data for the English Premier League for the 2015/2016 season. This event data was manually collected by humans who watch video feeds of the matches through special annotation software. Each time an event happens on the pitch, the human annotates the event with, amongst others, a timestamp, the location, an appropriate type (e.g. foul, pass, or cross) and the players who are involved. Depending on the type of the event, additional information is available, for example, the end location and type of a pass or the outcome of a tackle.
Overall the dataset contains 652,907 events with 39 different event types.
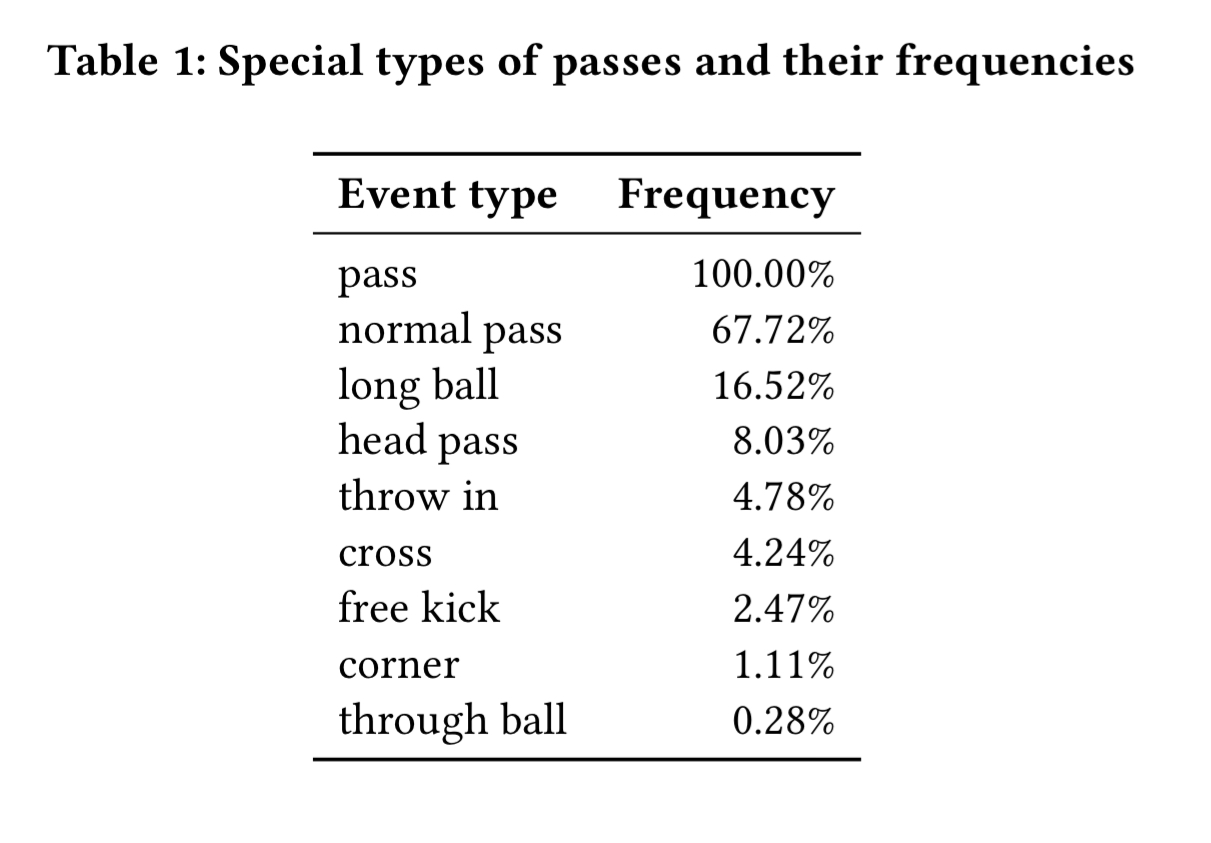
A match is represented as a sequence of such events. Can we do anything useful with those event streams to gain insights into the way a team plays?
The approach taken by the authors has five key steps:
- The event stream for a match is divided into a series of phases of play.
- The phases are then clustered based on their spatio-temporal component
- The clusters are ranked, with input from the analyst as to which features are of most importance to them
- Pattern mining is then applied to the clusters to discover frequent sequential patterns
- The discovered patterns are ranked
Determining phases of play
A phase is simply a sequence of consecutive events. A new phase starts whenever one of the following two conditions is met:
- There is a pause of at least 10 seconds between events, or
- Possession switches from one team to the other
Here’s an example phase from a Manchester City game:
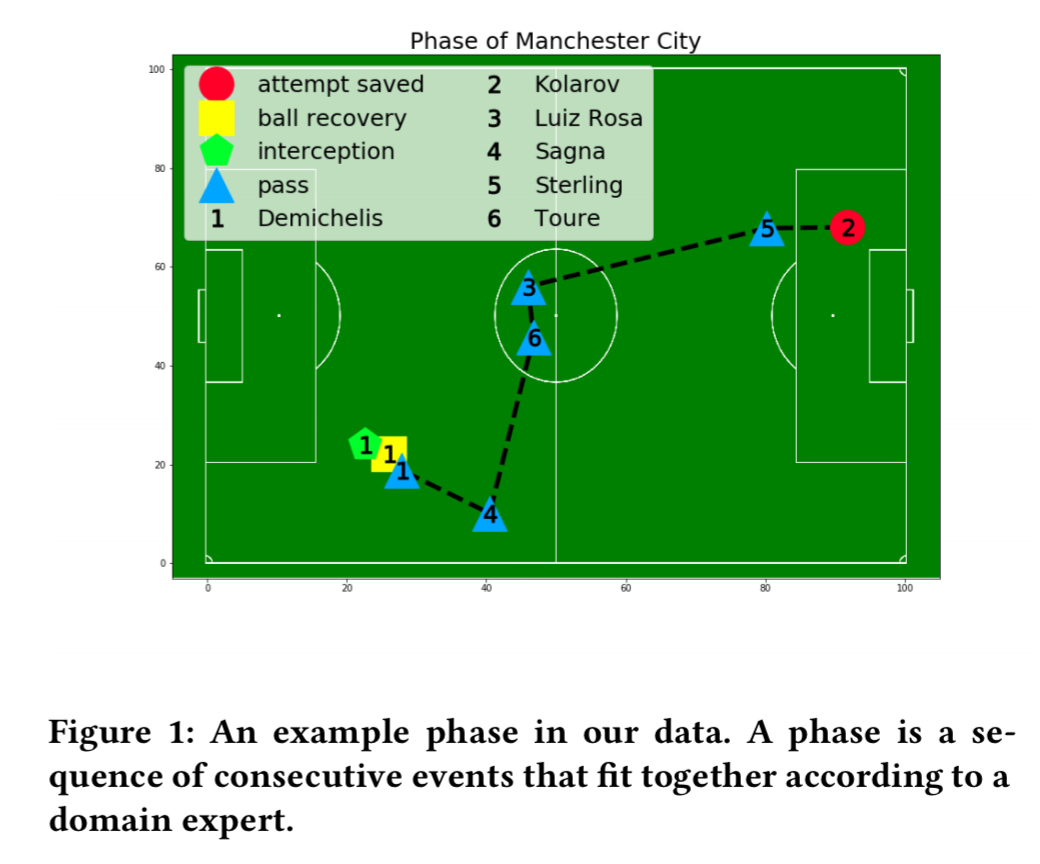
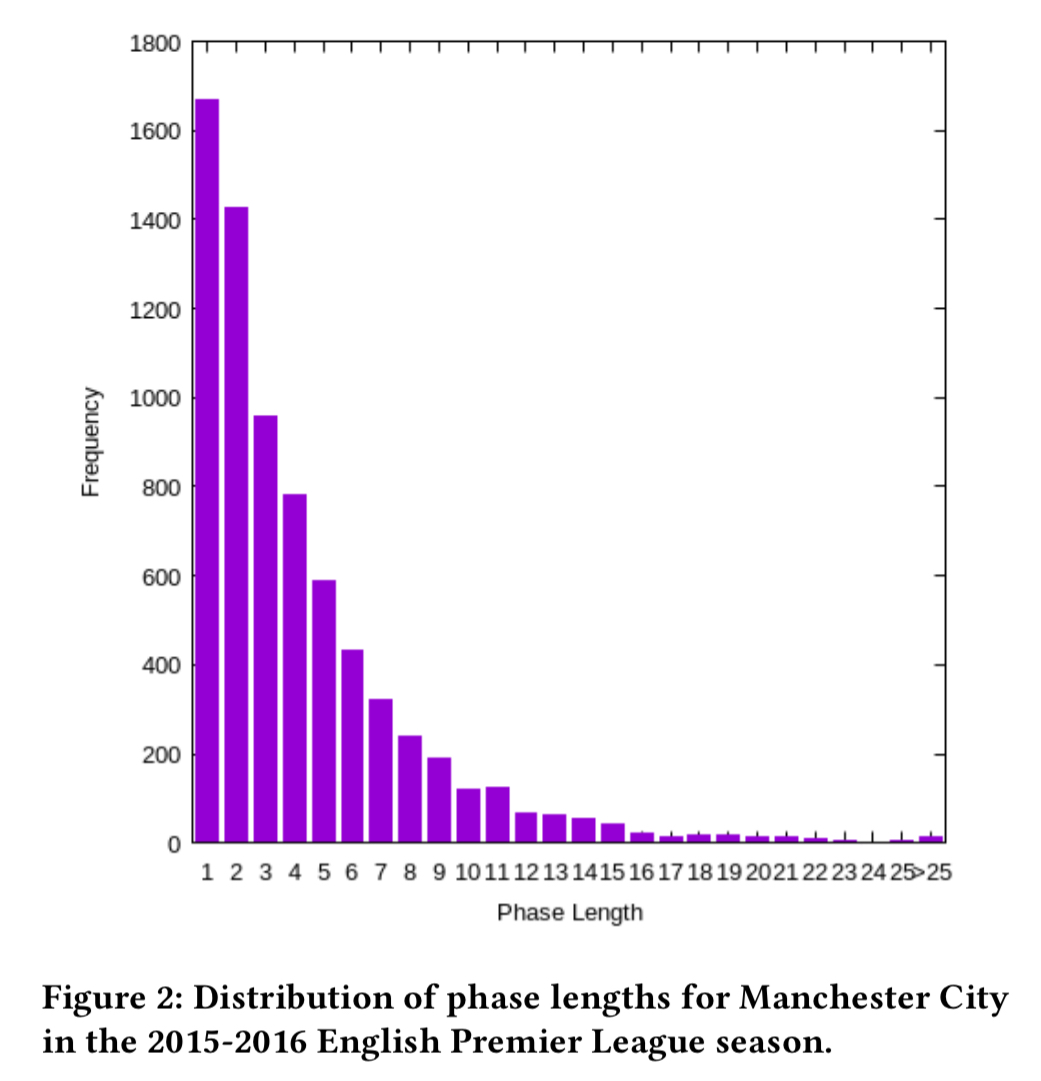
And this chart shows the distribution of phase lengths. The follow-on analysis only considers phases with at least three events in them.
Clustering phases
The goal of the second step is to identify similar spatio-temporal phase via clustering. We do this for two reasons. One, this helps reduce the space of possible patterns that we need to search in step four. Two, a team is likely to employ multiple different attacking tactics, such as corners, attacking through the middle, down the flank, each of which will be characterized by different spatial characteristics. Clustering gives us a natural way to divide the data along these lines.
It’s a standard clustering algorithm in which each element starts out in a cluster of one, and then clusters are iteratively merged together until a stop criteria is met. In each iteration the two closest clusters are combined, where the distance between two clusters is taken as the distance between the two elements (one from each cluster) that are furthest away from each other.
The interesting twist is what to use as the distance function between event sequences? We’re interested in similar sequences of events, for which dynamic time warping (DTW) is a standard approach. It’s not a true distance function as it doesn’t satisfy the triangle equality, but it seems to work well enough for this purpose.
Ranking clusters
Typically, the quality of clusters is judged by statistics such as average pairwise distance, maximal pairwise distance and minimal pairwise distance. However, these evaluation functions are less likely to be relevant to a domain expert. (For example,) a soccer coach might be most interested in a cluster with phases that frequently lead to shots and goals.
In the current work, clusters are ranked based on the number of shots they contain.
Mining for patterns
Having identified clusters of similar sequences it’s now time to look for patterns within them.
We employ the CM-SPADE pattern miner, which is a more conventional sequential pattern mining algorithm found in the SPMF toolbox. This pattern miner is more restrictive in the type of learned patterns, but offers better scalability in terms of speed and memory.
Before we can hand a sequence of to the pattern miner we need to convert the sequence of events into a sequence of itemsets (unordered sets). Most pattern miners like to work with discrete data, so the x and y location of an event causes difficulties. The solution is to discretise the location information, which is done in a very coarse manner as follows:
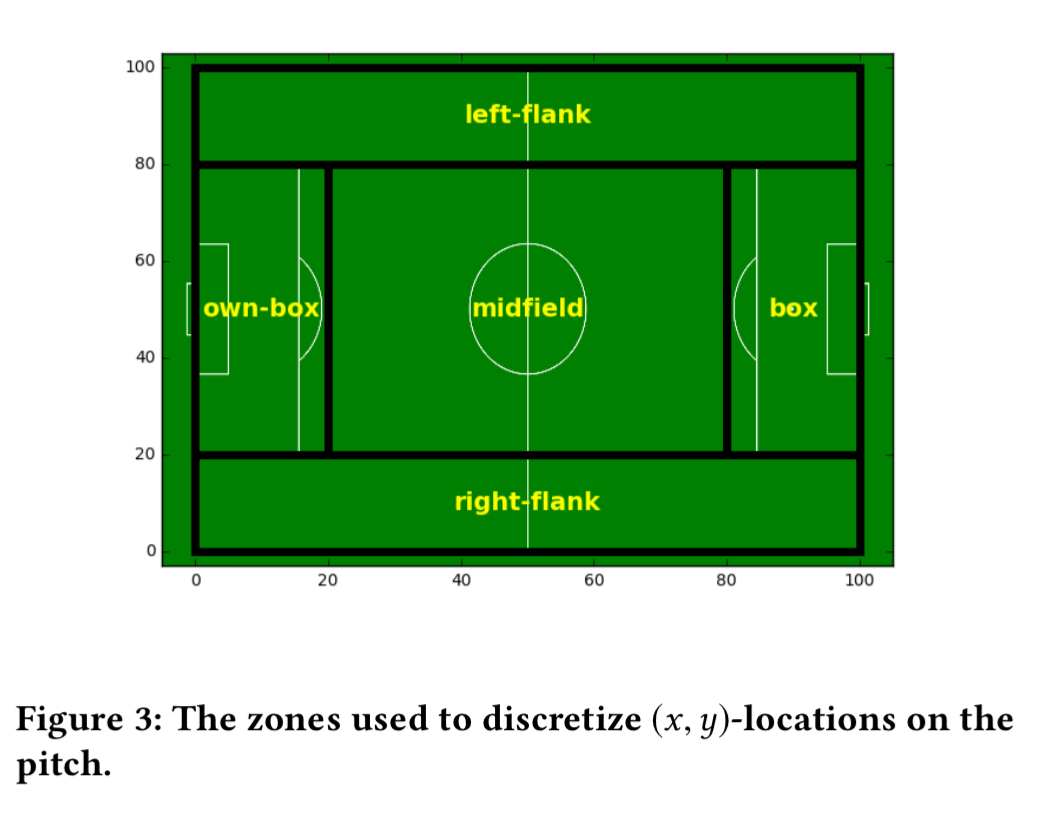
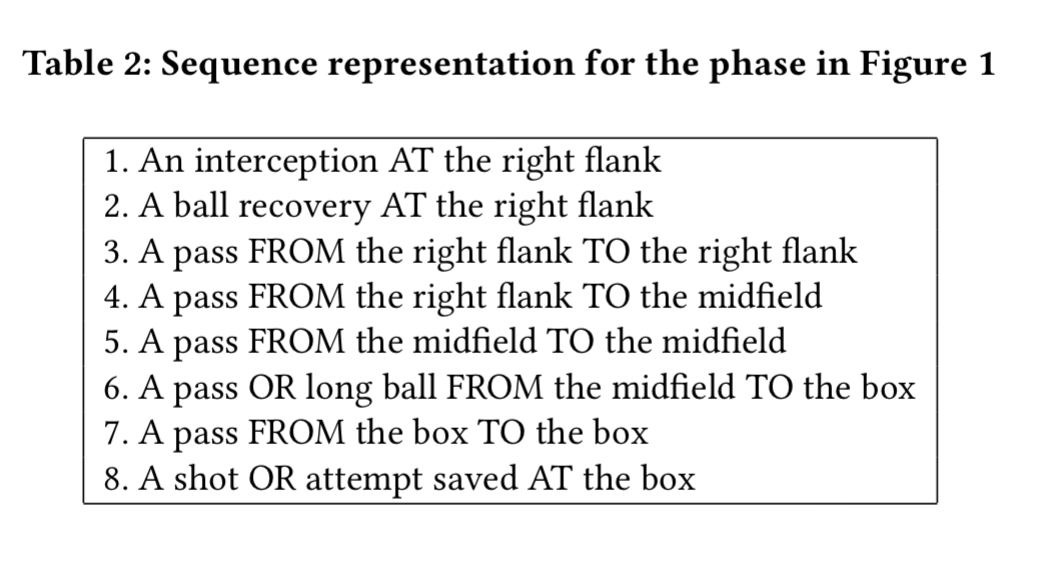
Itemsets are constructed by combining the event type representation and discretised location. That gives human interpretable representations such as following for the Manchester City phase of play we saw earlier:
Ranking patterns
Final ranking of patterns is done by assigning a weight to each event type indicating its relative importance (e.g. shots on goal have a larger weight) and then ranking by considering the types of events in the pattern, the length of the pattern, and the pattern’s support. Shots have weight 2, passes have weight 0.5, and every other event has weight 1.
Does it work?
The evaluation is based on data from all 38 matches of the 2015/16 season. The top 10 clusters for each team are then mined for patterns.
Here’s an example of clusters found for Manchester City.
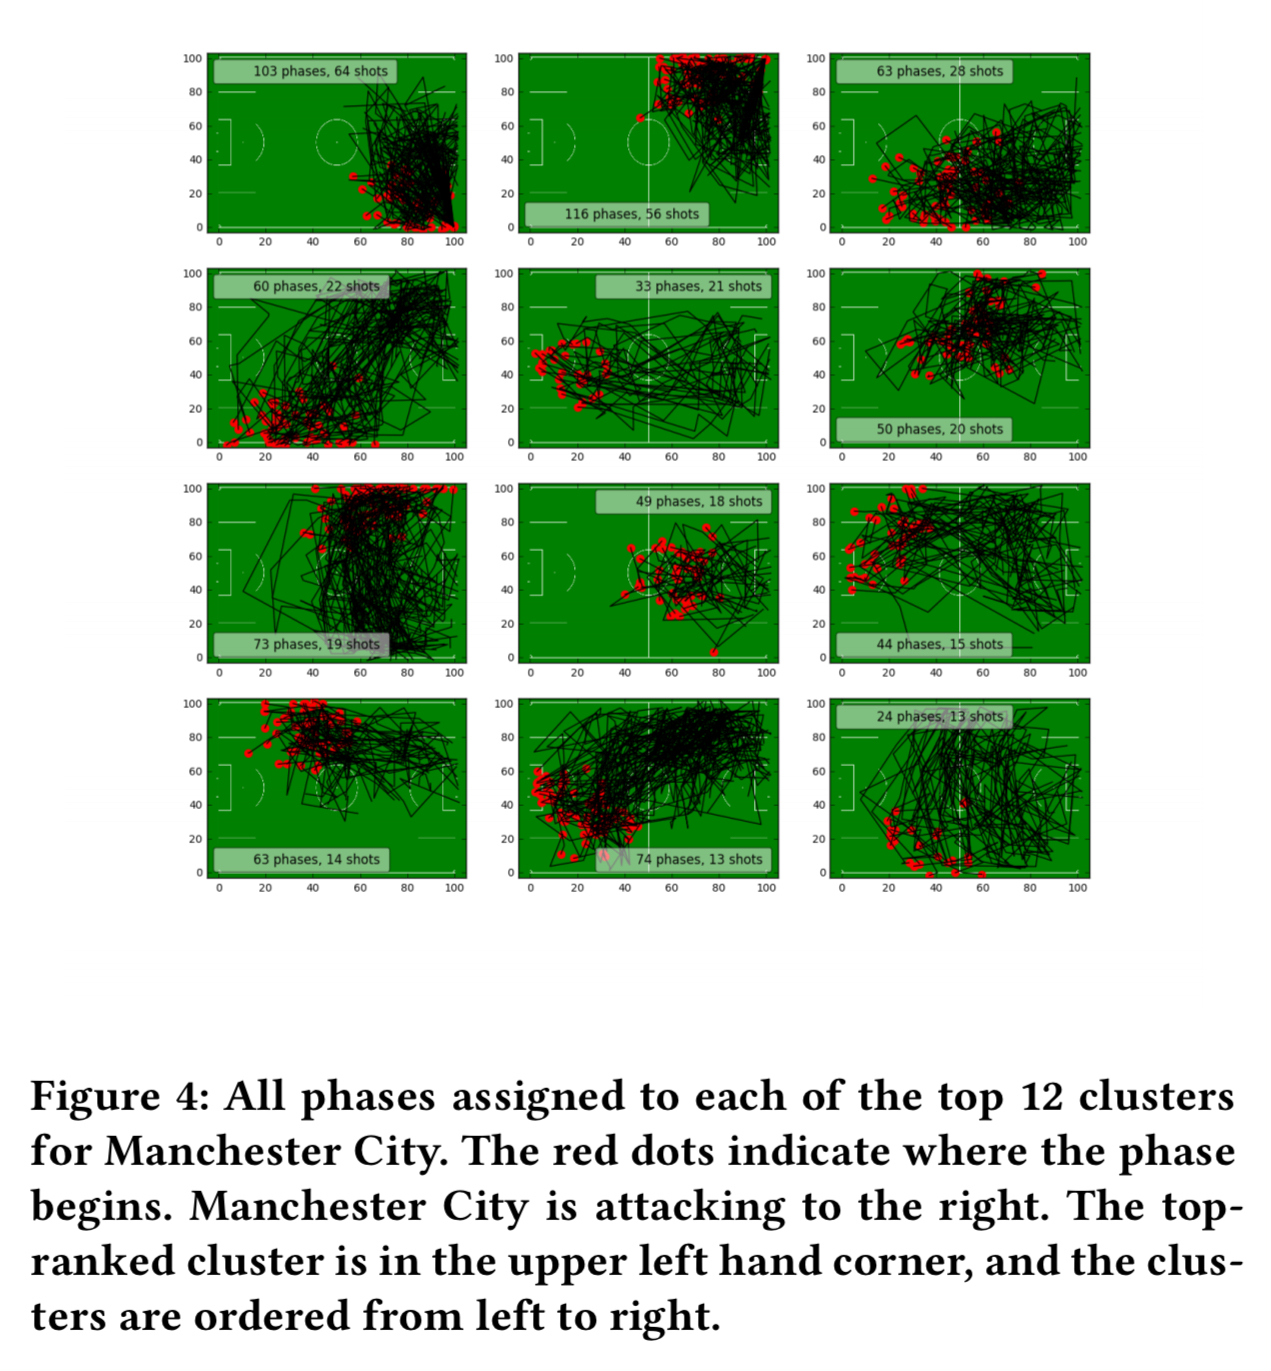
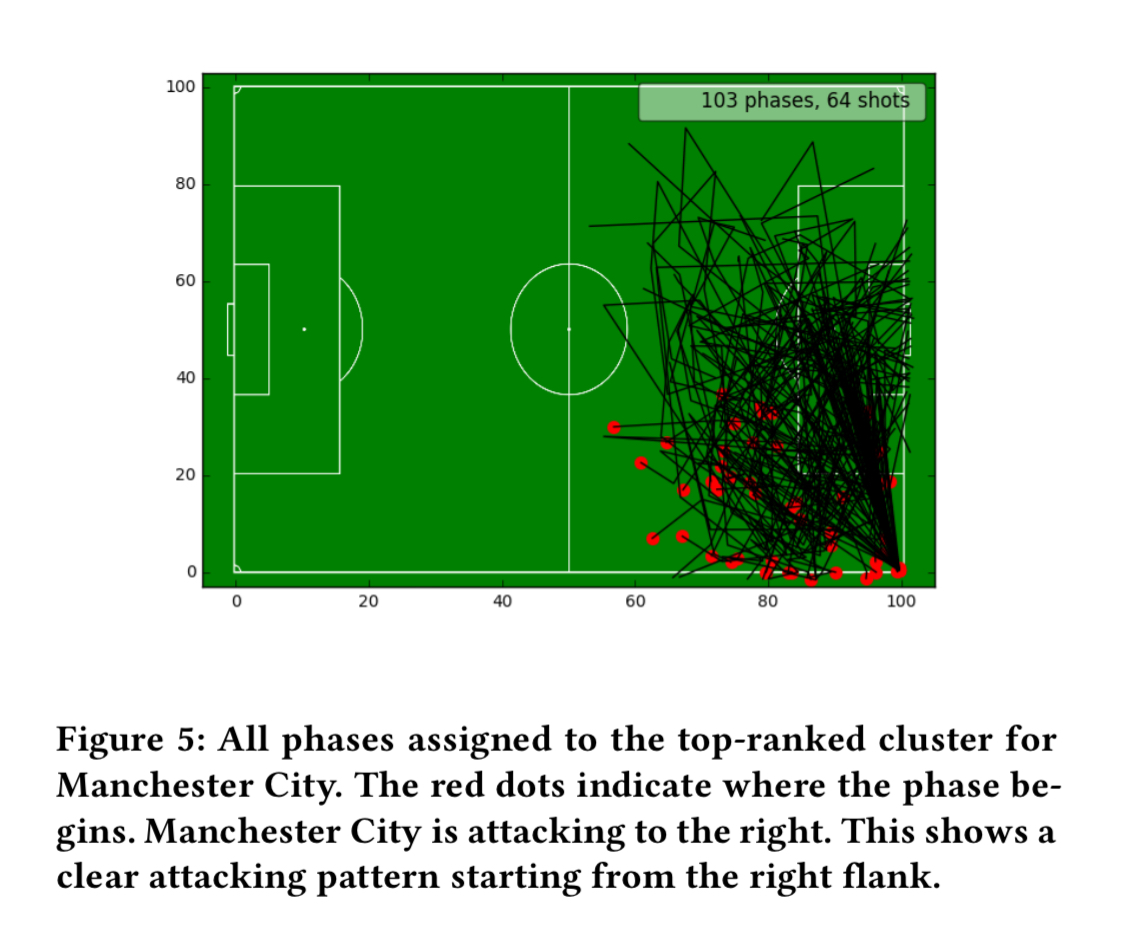
A closer look at one of these clusters shows a clear attacking pattern starting from the right flank.
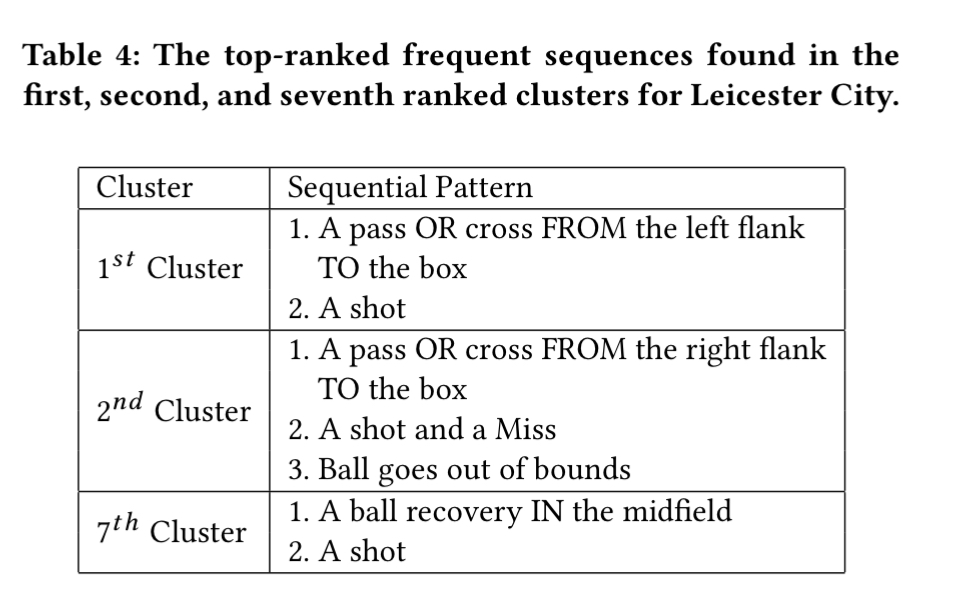
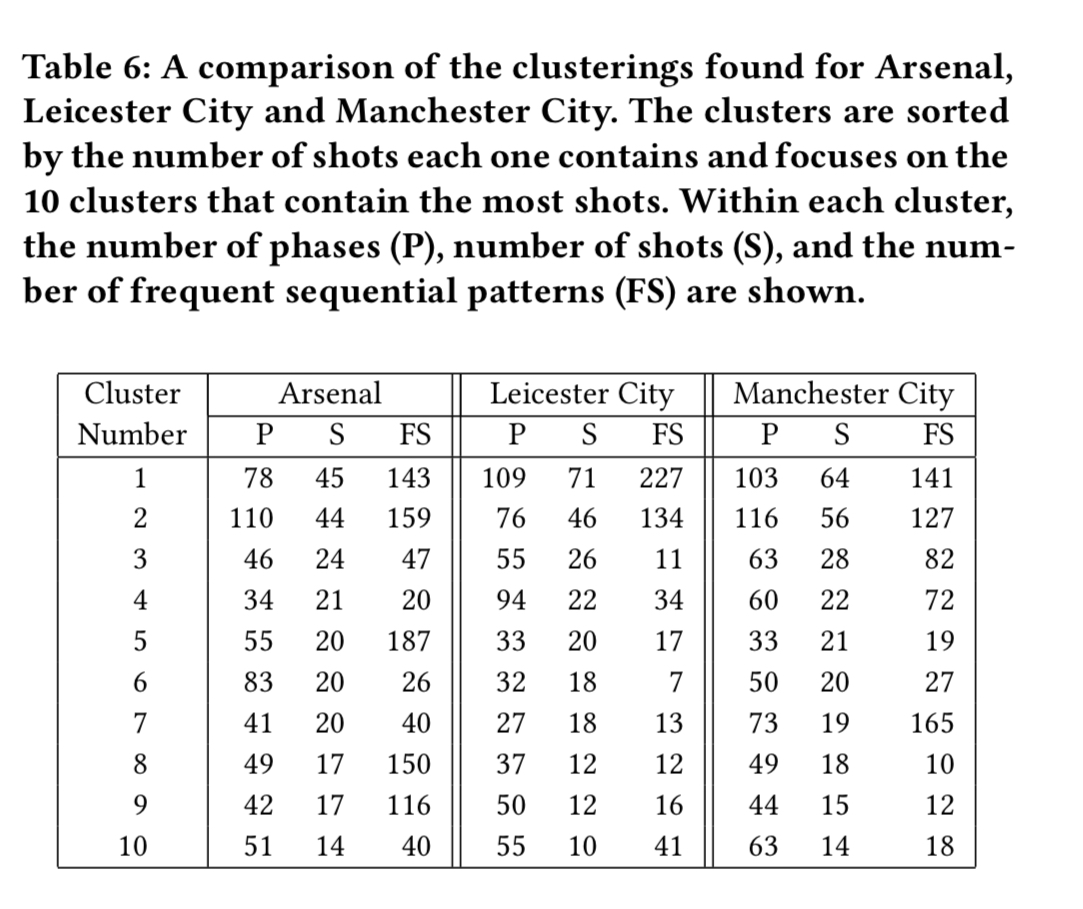
Zooming in on three teams, Arsenal, Leicester City, and Manchester United the technique is sufficient to highlight differences in their play. For example, Leicester City generate many more shots from the left flank than the right flank, and very few top ranking sequences that start with a goal kick. They also have a number of clusters where the phase of play starts in the opponent’s half of midfield, and these generate 64 shots between them. “This indicates a direct counter-attacking style with shorter sequences.”
Arsenal’s play involves long sequences of passing the ball around, with lots of action through the midfield:
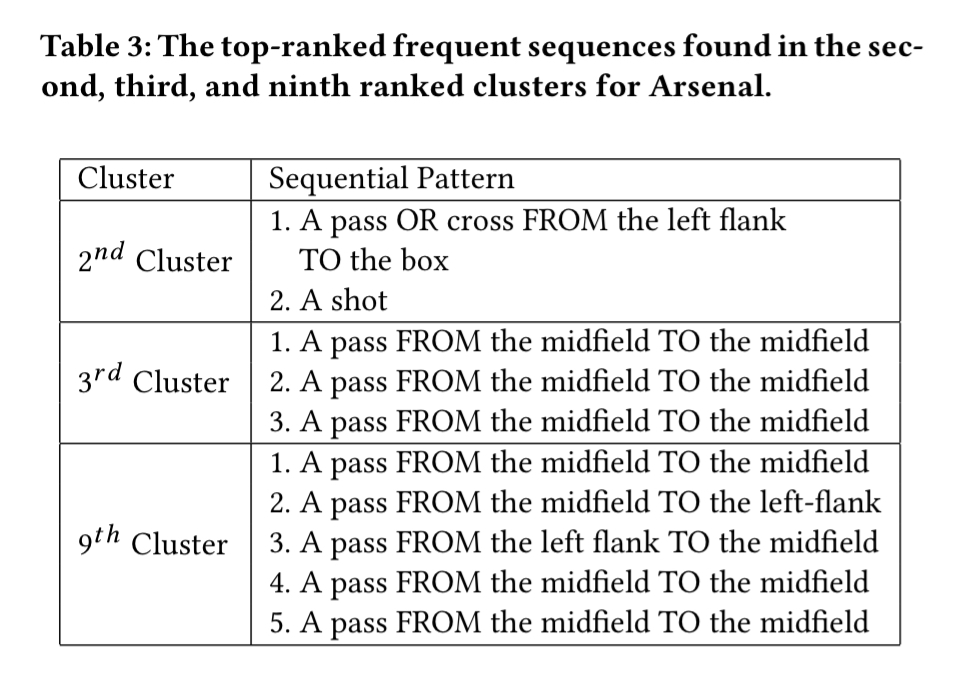
Manchester City’s style falls somewhere between the two:
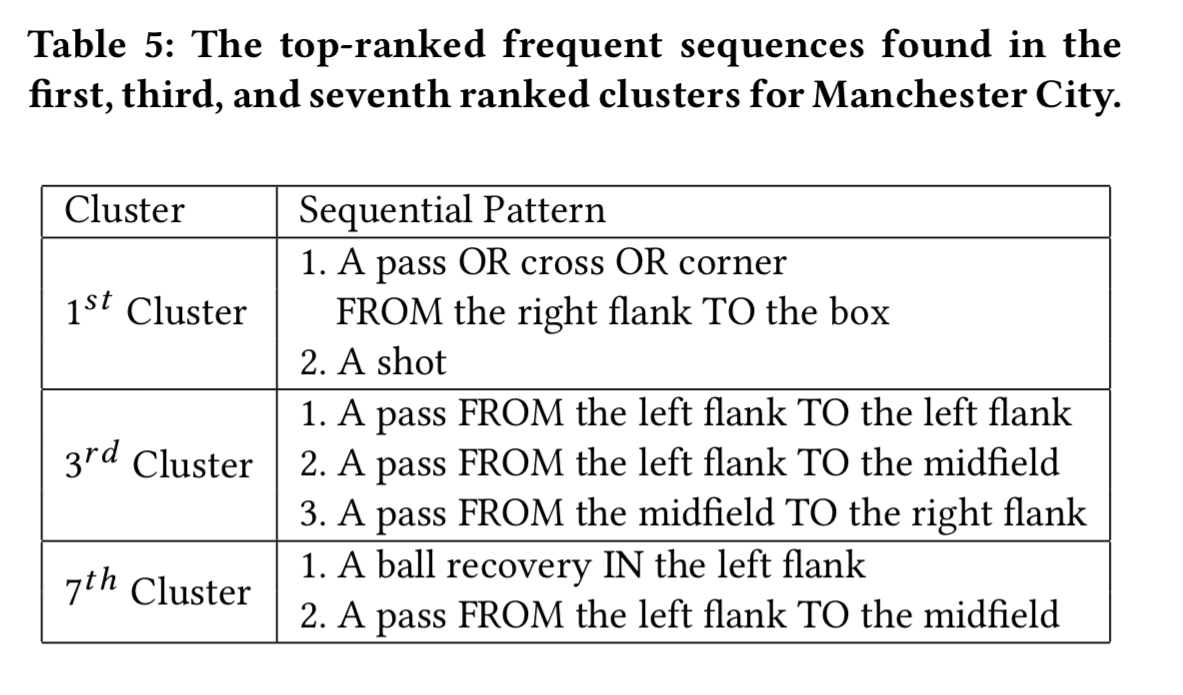
The following table compares the top 10 clusters for each team:
The patterns generated by our approach were presented to a company that provides data-driven advice to soccer clubs and soccer associations with respect to player recruitment and opponent analysis. The company has expressed an interest in building a product based on this approach and implementing it in the near future to be included in their services.
Regarding my comments at the start of this write-up on the movement of players on and off the ball being a key part of tactics (think e.g. of the formation of a defensive line, how high up the pitch a team forms that, how quickly they press-up, etc.), the authors have the following to say: “it would be interesting and much more informative to have full optical-tracking data for all players and the ball. However, tackling such a setting would require radically different techniques.” I’m sure such data will eventually be forthcoming, and I look forward to seeing what can be done with it. E.g., could we build a predictive model for the behaviour of each individual player? And could we then combine those in a multi-agent environment and use reinforcement learning to discover effective tactics against them? Now that would be interesting!
Hi,
looked at this a while go when too busy to study it Looking at it again as I am working on something similar. Interesting work… well done! I did comment on twitter. hope to get in touch later when I have done some work on mine. I may send it to you for a review if that’s oke with you.
Cheers,
Gianni