Algorithmic glass ceiling in social networks: the effects of social recommendations on network diversity Stoica et al., WWW’18
(If you don’t have ACM Digital Library access, the paper can be accessed either by following the link above directly from The Morning Paper blog site, or from the WWW 2018 proceedings page).
Social networks were meant to connect us and bring us together. This paper shows that while they might be quite successful at doing this in the small, on a macro scale they’re actually doing the opposite. Not only do they reinforce and sustain disparities among groups, but they actually reinforce the rate at which disparity grows. I.e., they’re driving us apart. This happens due to the rich-get-richer phenomenon resulting from friend/follow recommendation algorithms.
… we find that prominent social recommendation algorithms can exacerbate the under-representation of certain demographic groups at the top of the social hierarchy… Our mathematical analysis demonstrates the existence of an algorithmic glass ceiling that exhibits all the properties of the metaphorical social barrier that hinders groups like women or people of colour from attaining equal representation.
Organic growth vs algorithmic growth
“In the social networks now governing the knowledge, jobs and deals one can seek, what matters most today is one’s position in the graph of advantageous connections.” It takes time and effort to build and maintain your connections. One of the key tools that social networks provide to help with this is algorithm recommendation of connections. I.e., “people you may know” on Facebook, “who to follow” on Twitter, and “suggested accounts” on Instagram. Unsurprisingly, and by design, these suggestions influence the networks that people end up building.
Homophily — a tendency of individuals to favour interactions with similar peers — influences even organic connection growth (i.e., connections that are built up in the absence of algorithmic recommendations). When we combine homophily with algorithmic connection growth (i.e., connections that are built up in the presence of algorithmic recommendations), the advantage of the majority group is exacerbated.
We build on a growing body of evidence that online services (including Twitter, TaskRabbit, and Airbnb) can reproduce well-know prejudices against historically under-represented groups. Issues raised include disparate treatment and evidence of a metaphorical glass ceiling. The latter denotes an invisible barrier preventing given demographics (most commonly females) from reaching superior levels of recognition.
The conditions for declaring the presence of a glass ceiling impacting a given demographic group are:
- The chances of advancement to a higher level are uneven for members of that group
- The disparity is not explained by task-relevant characteristics
- The inequality increases for higher and higher levels.
Consider the following chart, concentrating just on the blue circles to start with.
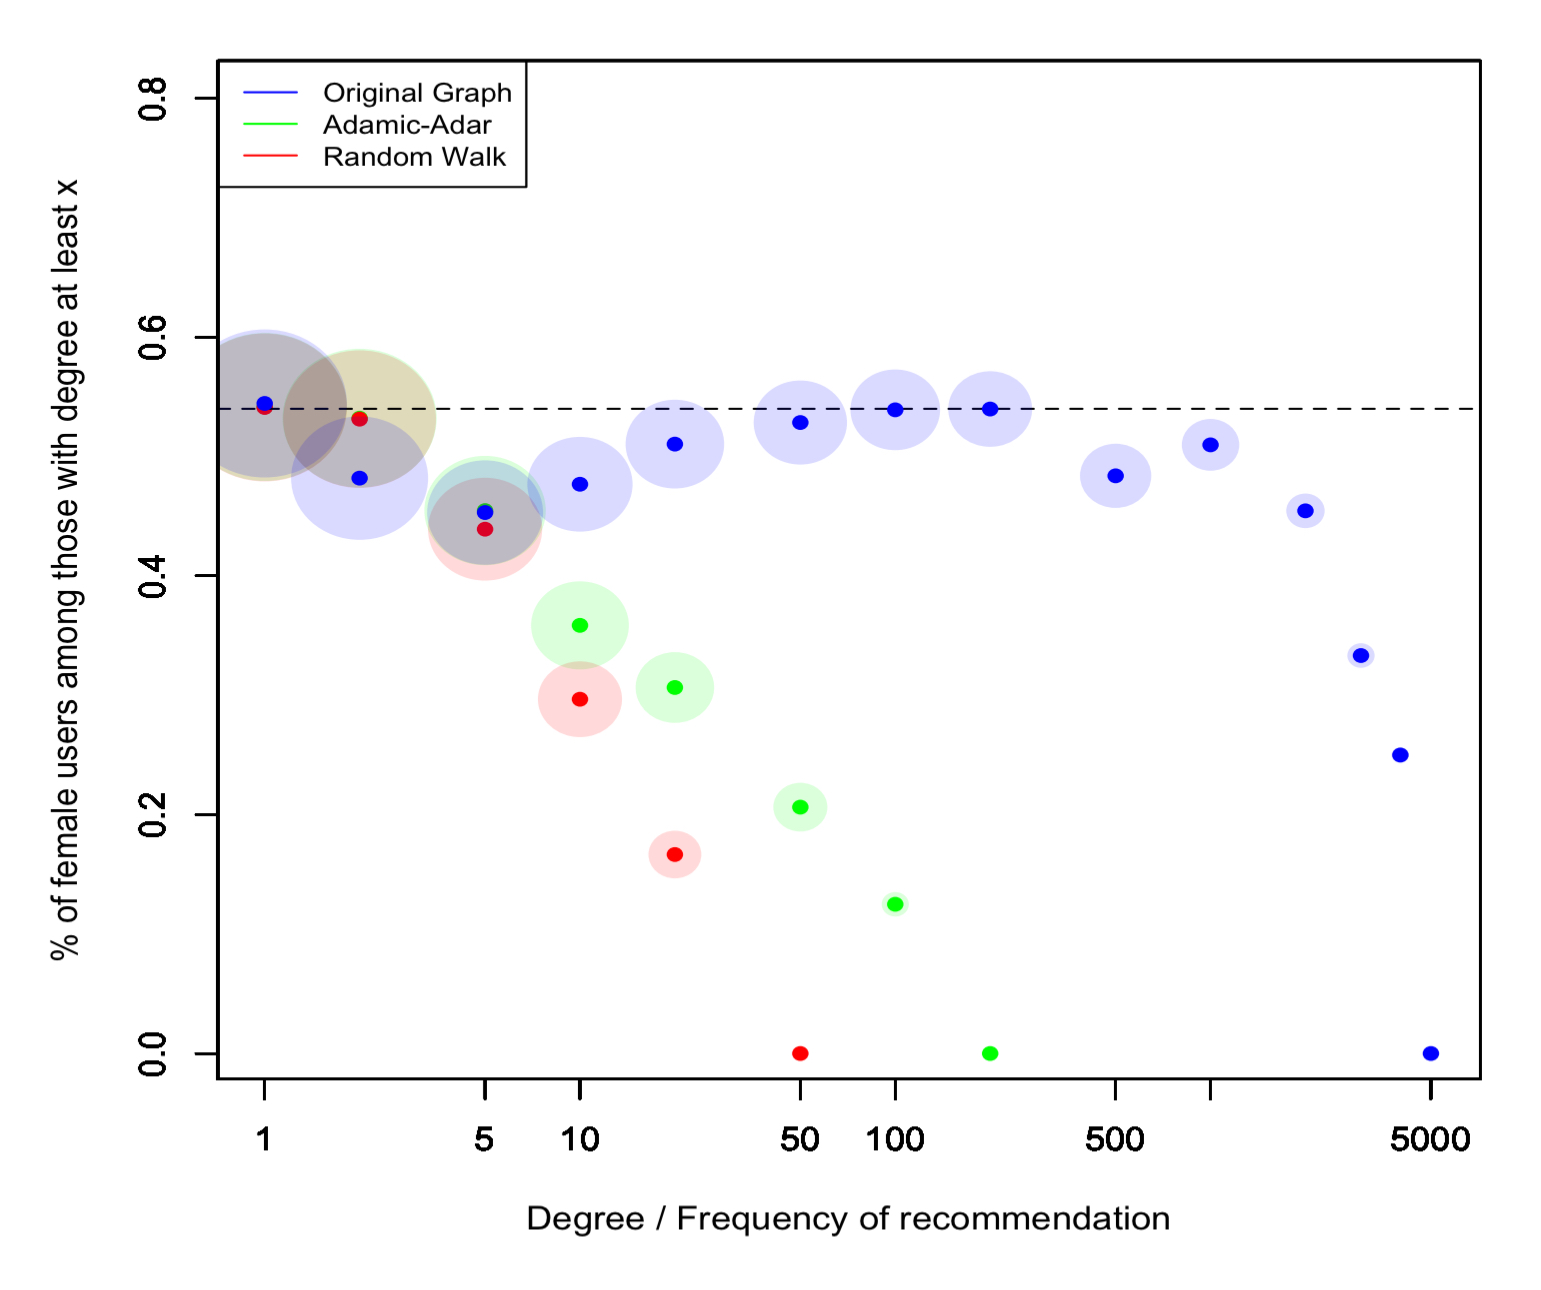
You’re looking at Instagram data collected over multiple months of 2014 and 2015, before Instagram’s “suggested accounts” feature was introduced. That is, it’s the result of organic growth. The horizontal dashed line shows the fraction of female users in the overall dataset (54.43%). On the x-axis we have increasing degree, and on the y-axis the percentage of female users among nodes with that degree. Women appear under-represented at the top of the hierarchy, but they are not completely excluded. The paper just rolls straight past this factual observation, since the authors are mostly interested in the comparison to algorithmic growth, but it’s worth pausing for a moment to think about what’s causing this result: it’s not what you’d expect from a straightforward ‘rich get richer’ model. It’s due to differential homophily between men and women. Men show a stronger bias towards connecting to other men than women do for connecting to other women. This happens even when controlling for content productivity.
Now take a second look at the chart, this time focusing on the blue and green circles. The x-axis is now representing the frequency with which a node is recommended as a connection, under approximations to two common recommendation strategies (the Adamic-Adar index and a random walk of length 2). There’s a much sharper drop-off for recommendations of female users under these algorithmic growth conditions. You can see it even more clearly in this log-log scale plot:
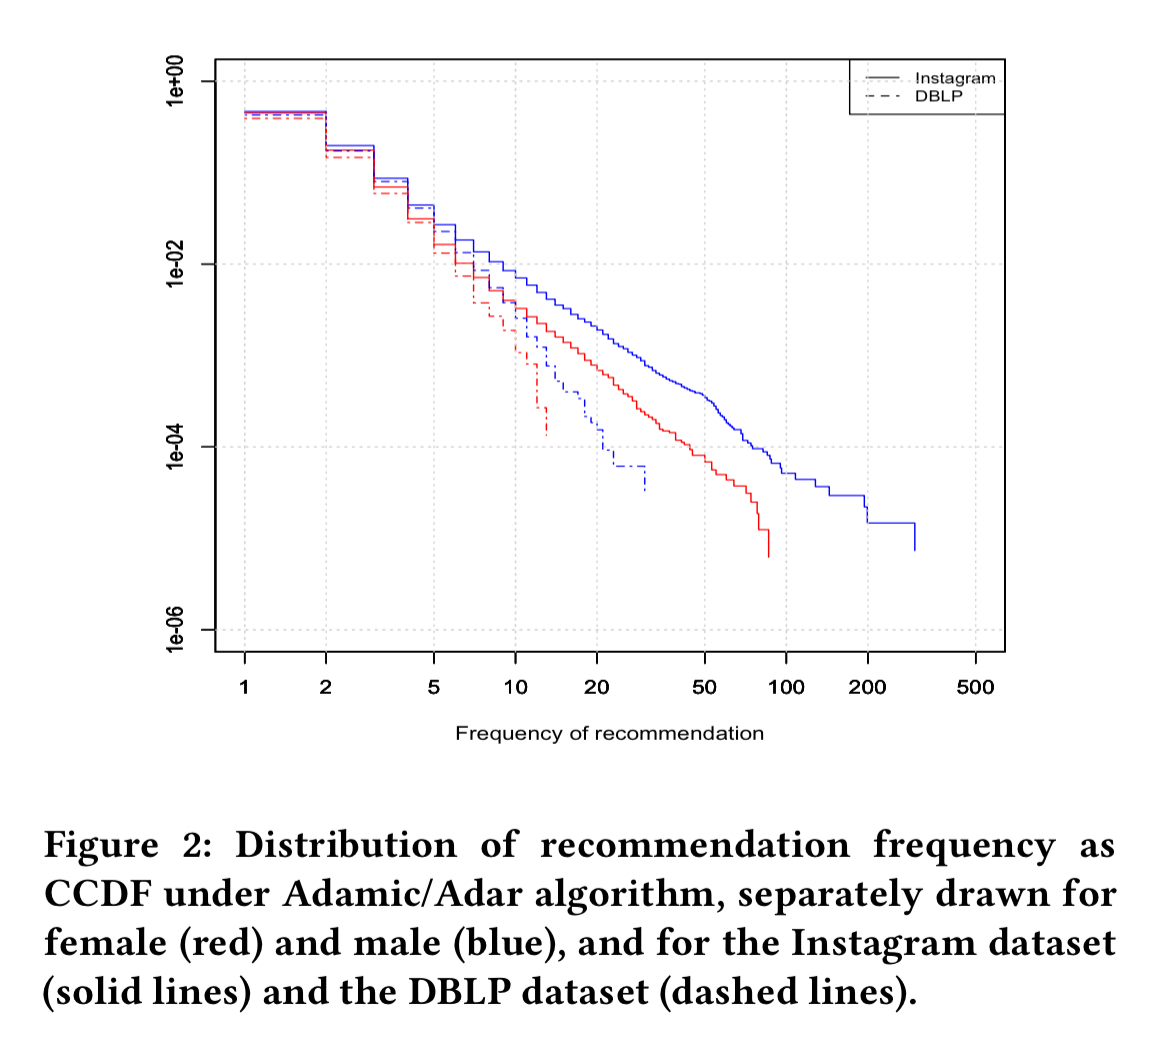
This gap, exhibited to grow in log-log scale, is a sign of different power coefficients governing the statistical chance to reach at least x recommendations, depending on gender. As one progressively selects to retain only the most successful individuals, the aforementioned effect translates into a sudden and accelerating drop of the observed fraction of females.
Again, simple homophily would suggest that females should be recommended more throughout, but differential homophily coupled with recommendation can rapidly overturn and invert the inequality. (Of course, if females showed stronger homophily than males, then the effect would be to even more rapidly increase the female advantage instead).
Modelling growth
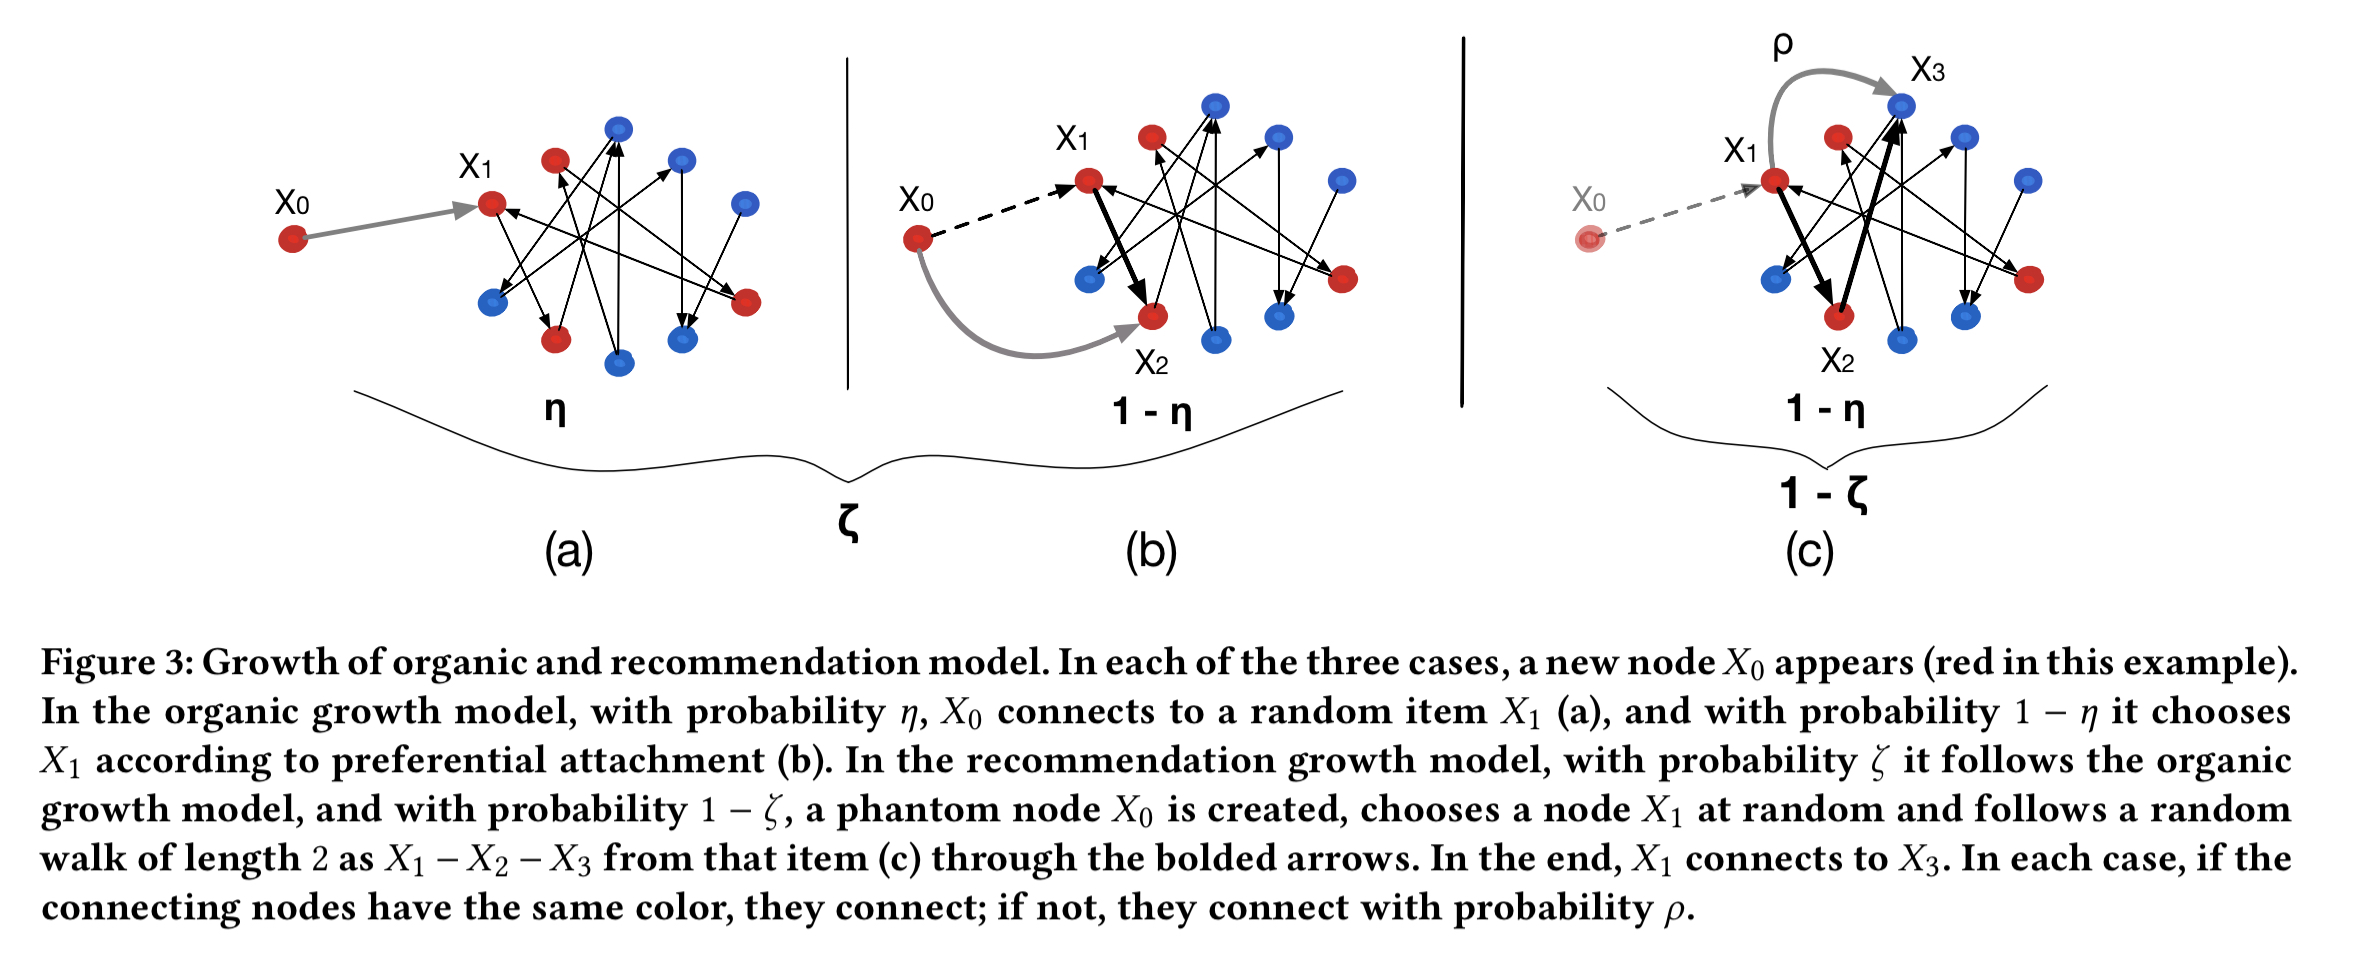
Consider a network with red and blue labelled nodes. In the organic growth model we have the following rules;
- A new node
enters the network and receives label R with probability r, and B with probability 1-r, where r is less than 0.5.
Then repeat the following steps until an edge is formed:
- With probability
, the new node
at random.
- With probability
,
- If the new node has a different label than the node it chooses to connect to, the connection is accepted with probability
. (If it has the same label, it is always accepted).
For algorithmic growth we make the following changes. Once a new node has entered the network as above, it connects through organic growth with probability 


(Enlarge)
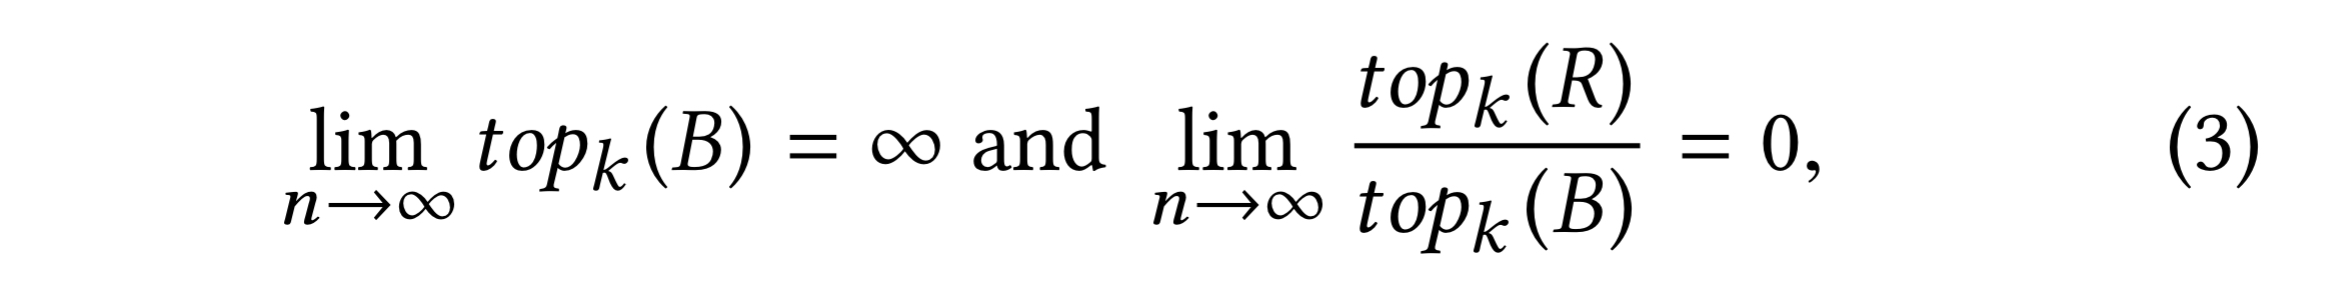
A power inequality effect exists for the red nodes if the average degree of a red node ends up lower than the average degree of a blue node. A tail glass ceiling effect exists if there exists an increasing function k(n) for short k such that:
The algorithmic glass ceiling
… the algorithms we analyzed do not create bias ex nihilo, but simply amplify bias in networks where it exists.
In section 5 of the paper the authors show the following under the organic model:
- The rate of growth of edges towards the red population converges towards a constant
.
- The in-degree distributions of the two populations follow power laws with different coefficients
And under the algorithmic model:
- The sum of degrees of the red nodes converges to a constant that is smaller than r, and even smaller than in the organic case: $latex \alpha_2 < \alpha … the sharp amplification of the glass ceiling effect by an algorithm is an entirely new result, which has no equivalent that we know of. It is a special case of a widely open problem: how to correct a seemingly neutral algorithm when the structure it exploits is not fair to begin with… Unfortunately, without a deep understanding of the cause and reverberation of bias, any post-hoc correction can be harshly debated. Our paper offers an alternative way: identify some structural causes of the emerging unfairness, and require algorithms to be designed in a way that leverages structure while carefully avoiding those biases in the presence of the above conditions.

I am not sure I completely get it … You say ‘the advantage of the majority group is exacerbated.’ However, on Instagram the women are the majority group but according to the text the women hit the glass ceiling?
I tried to read the paper but it was hard. What I missed is that I could not find the user’s decision. I do not follow people because they are like me, I follow them because they got cool pictures. I.e. the quality of the pictures (or tweets) seems quite relevant for following someone. I could not find where this was discussed? It feels like the paper assumes the quality of the material between men and women is assumed fully equal? Even a small difference could then influence the material, i.e. then the recommendations could actually be fair?
Hi Peter, if all groups have equal homophily (tendency to like people that are the same as them), then the follower recommendations result in a rich-get-richer setup. But if the groups have *unequal* homophilic tendencies, then this can be such a powerful effect over time that it can even overcome an initial minority disadvantage. That seems to be the case in Instagram, where women have a natural majority but are more open to following both men and women. Men meanwhile seem to show a stronger bias towards following other men, and this is enough to tip the scales in their favour over time.
If we presume that the quality of the material stays constant between the two groups with and without follower recommendations, then the results show that adding in recommendations makes things worse.
Reblogged this on josephdung.
I’m not sure if I understood what the goal is. Do we want to preserve the organic grow dynamic but still use a recommendation system?
I guess you can use the learnings from the paper to achieve many different objectives, but the one I think the authors had in mind is to be able to design recommendation systems that don’t reinforce bias… That might look slightly different to the organic growth scenario,depending on the conditions.