Usage patterns and the economics of the public cloud Kilcioglu et al., WWW’17
Illustrating the huge diversity of topics covered at WWW, following yesterday’s look at recovering mobile user trajectories from aggregate data, today’s choice studies usage variation and pricing models in the public cloud. The basis for the study is data from ‘a major provider’s public cloud datacenters.’ Unless Google or Amazon are sending their data to three researchers from Microsoft, it’s a fair bet we’re looking at Azure.
Research in economics and operations management posits that dynamic pricing is critically important when capacity is fixed (at least in the short run) and fixed costs represent a substantial fraction of total costs.
For example, the fixed capacity of a data center (at least in the short run) and the relatively fixed costs of keeping it running.
In these markets, firms change prices so that demand is equal or close to the fixed capacity. The degree to which this can be accomplished depends on demand responsiveness and the firm’s price setting ability, which jointly determine how supply goes unused.
In other words, you make prices cheaper in periods of lower demand to stimulate usage, and you make prices higher in periods of high demand to discourage overuse.
Our scientific understanding of peak-load pricing focuses on three industries: electricity, airlines and hotels. Cloud computing thus seems to offer a fourth large industry where dynamic prices are expected to be important.
And yet cloud providers overwhelmingly use static pricing models, what’s going on? Here’s the short summary: the data shows that there is actually very little variation in demand volatility for cloud datacenters at the moment, thus the current pricing model makes sense. If you look more closely at actual CPU utilisation rates though, you see that behind the constantly powered-on VMs, there are true variations in usage patterns. Therefore as we move to cloud-native applications, and especially to models such as serverless that can much more effortlessly and granularly scale up and down in response to changing demands, we can expect the optimum pricing models to also change. Even then, it appears that having just two price bands, peak and off-peak, with off-peak times set in advance would obtain the majority of the efficiency gains available.
Let’s take a deeper look at what the data tells us about current cloud usage patterns and where we might be heading. The study is based on four months of usage data from a cloud region. Supply is fixed for the duration of the period (no new datacenters were brought online, and any fluctuations in capacity due to failures and replacements etc. are negligible relative to the overall capacity). During this time, neither Amazon, Google, or Azure changed their pricing.
Usage patterns at the regional level
The authors look at the average max-min range, capturing average peak-to-trough variation within a unit of time (day, week, month), and also the standard deviation.
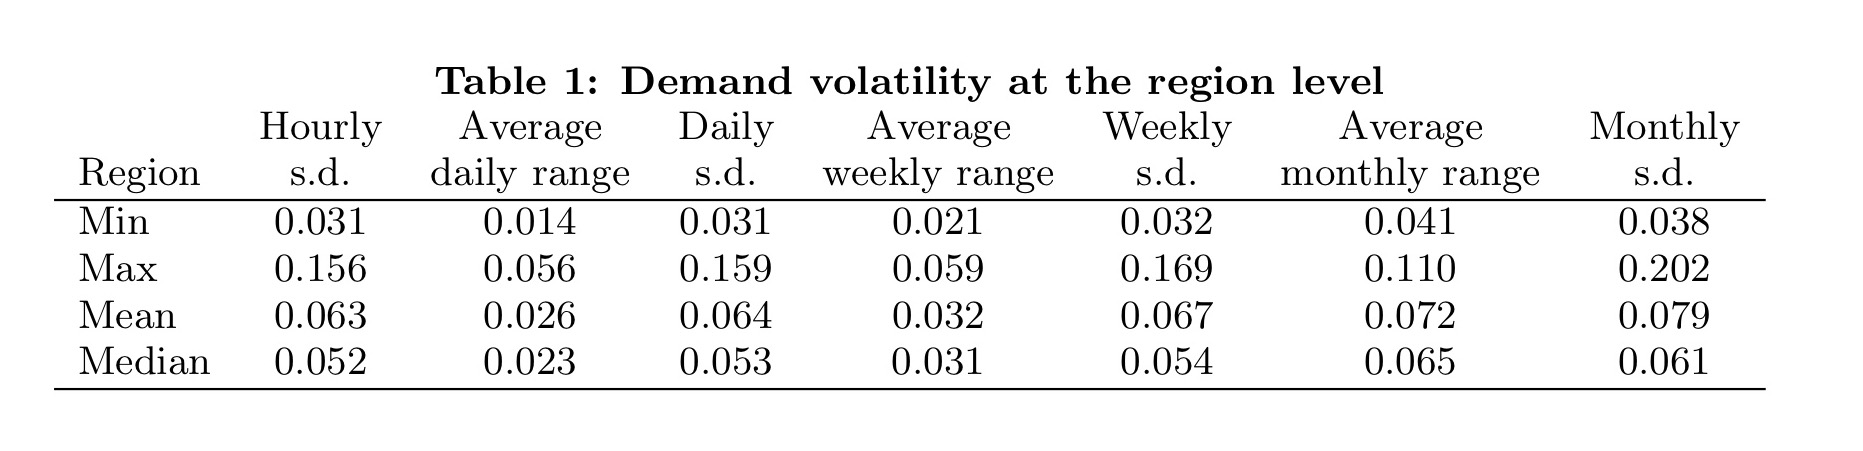
Usage is normalized relative to the maximally observed value, which masks confidential information about datacenter efficiency. So a value of e.g., 0.04 indicates 4% of the maximally observed value).
Daily and weekly ranges are only 2-3% on average, with the majority of variation occurring within a day. Monthly ranges show more variation, but this is explained by growth due to new customers joining, not variation in usage by individual customers. Here you can see visually the relatively low variation in usage overlaid on an underlying growth trend:
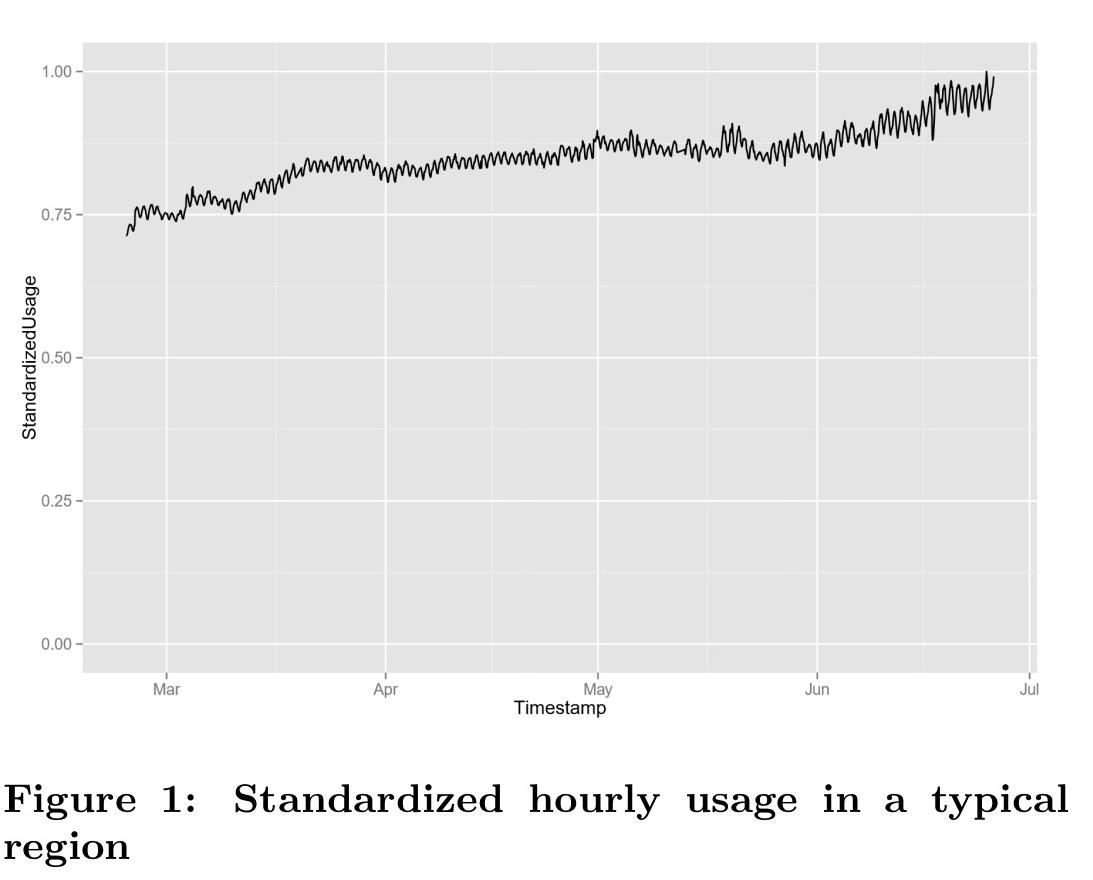
…predictable usage enables providers to run datacenters at high utilization effficiency without the need to use prices to shape demand.
We might have expected to see correlated demand spikes – such as increased demand on weekdays during business hours. To understand why we don’t, we need to look deeper into usage patterns at the individual customer level.
Usage patterns at the individual customer level
The authors study two groups of customers, the top 100 customers (capturing the behaviour of large enterprises), and a random set of 100 customers consisting mostly of small businesses.
We start by examining the relationship between each customer’s demand and the entire demand for the region they are deployed in.
This is based on a simple linear regression, 


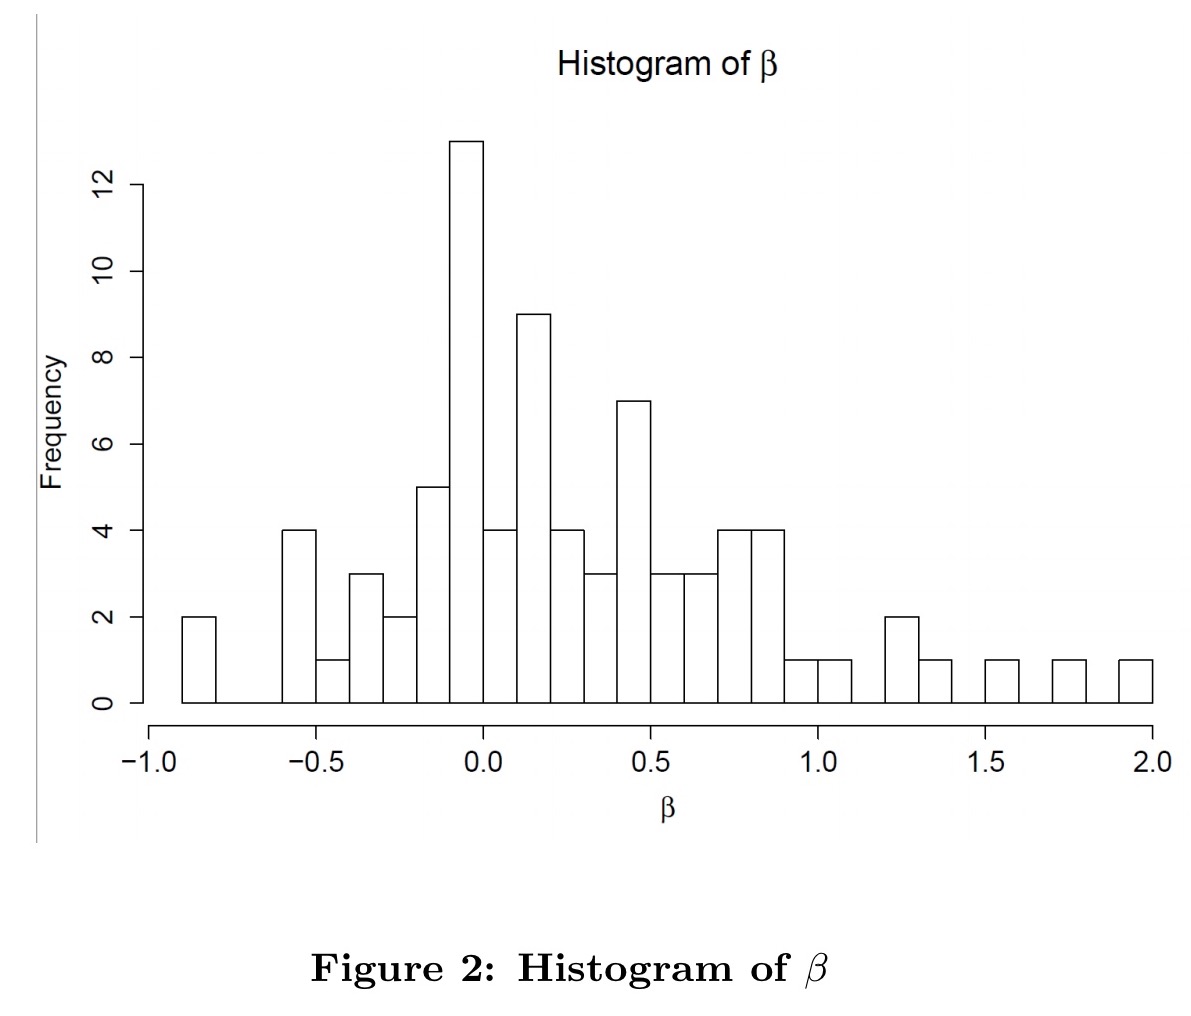
The histogram above shows us that customer usage tends to be positively correlated with overall region usage. Values above 1 are rare – very few customers exacerbate regional level fluctuations.
… many customers are close to zero or negative, indicating that they are either negatively correlated or uncorrelated with market-level demand shocks. These findings help explain the relatively smooth utilization at the datacenter level.
Here are the customer volatility metrics for the two groups, as compared to the region overall.
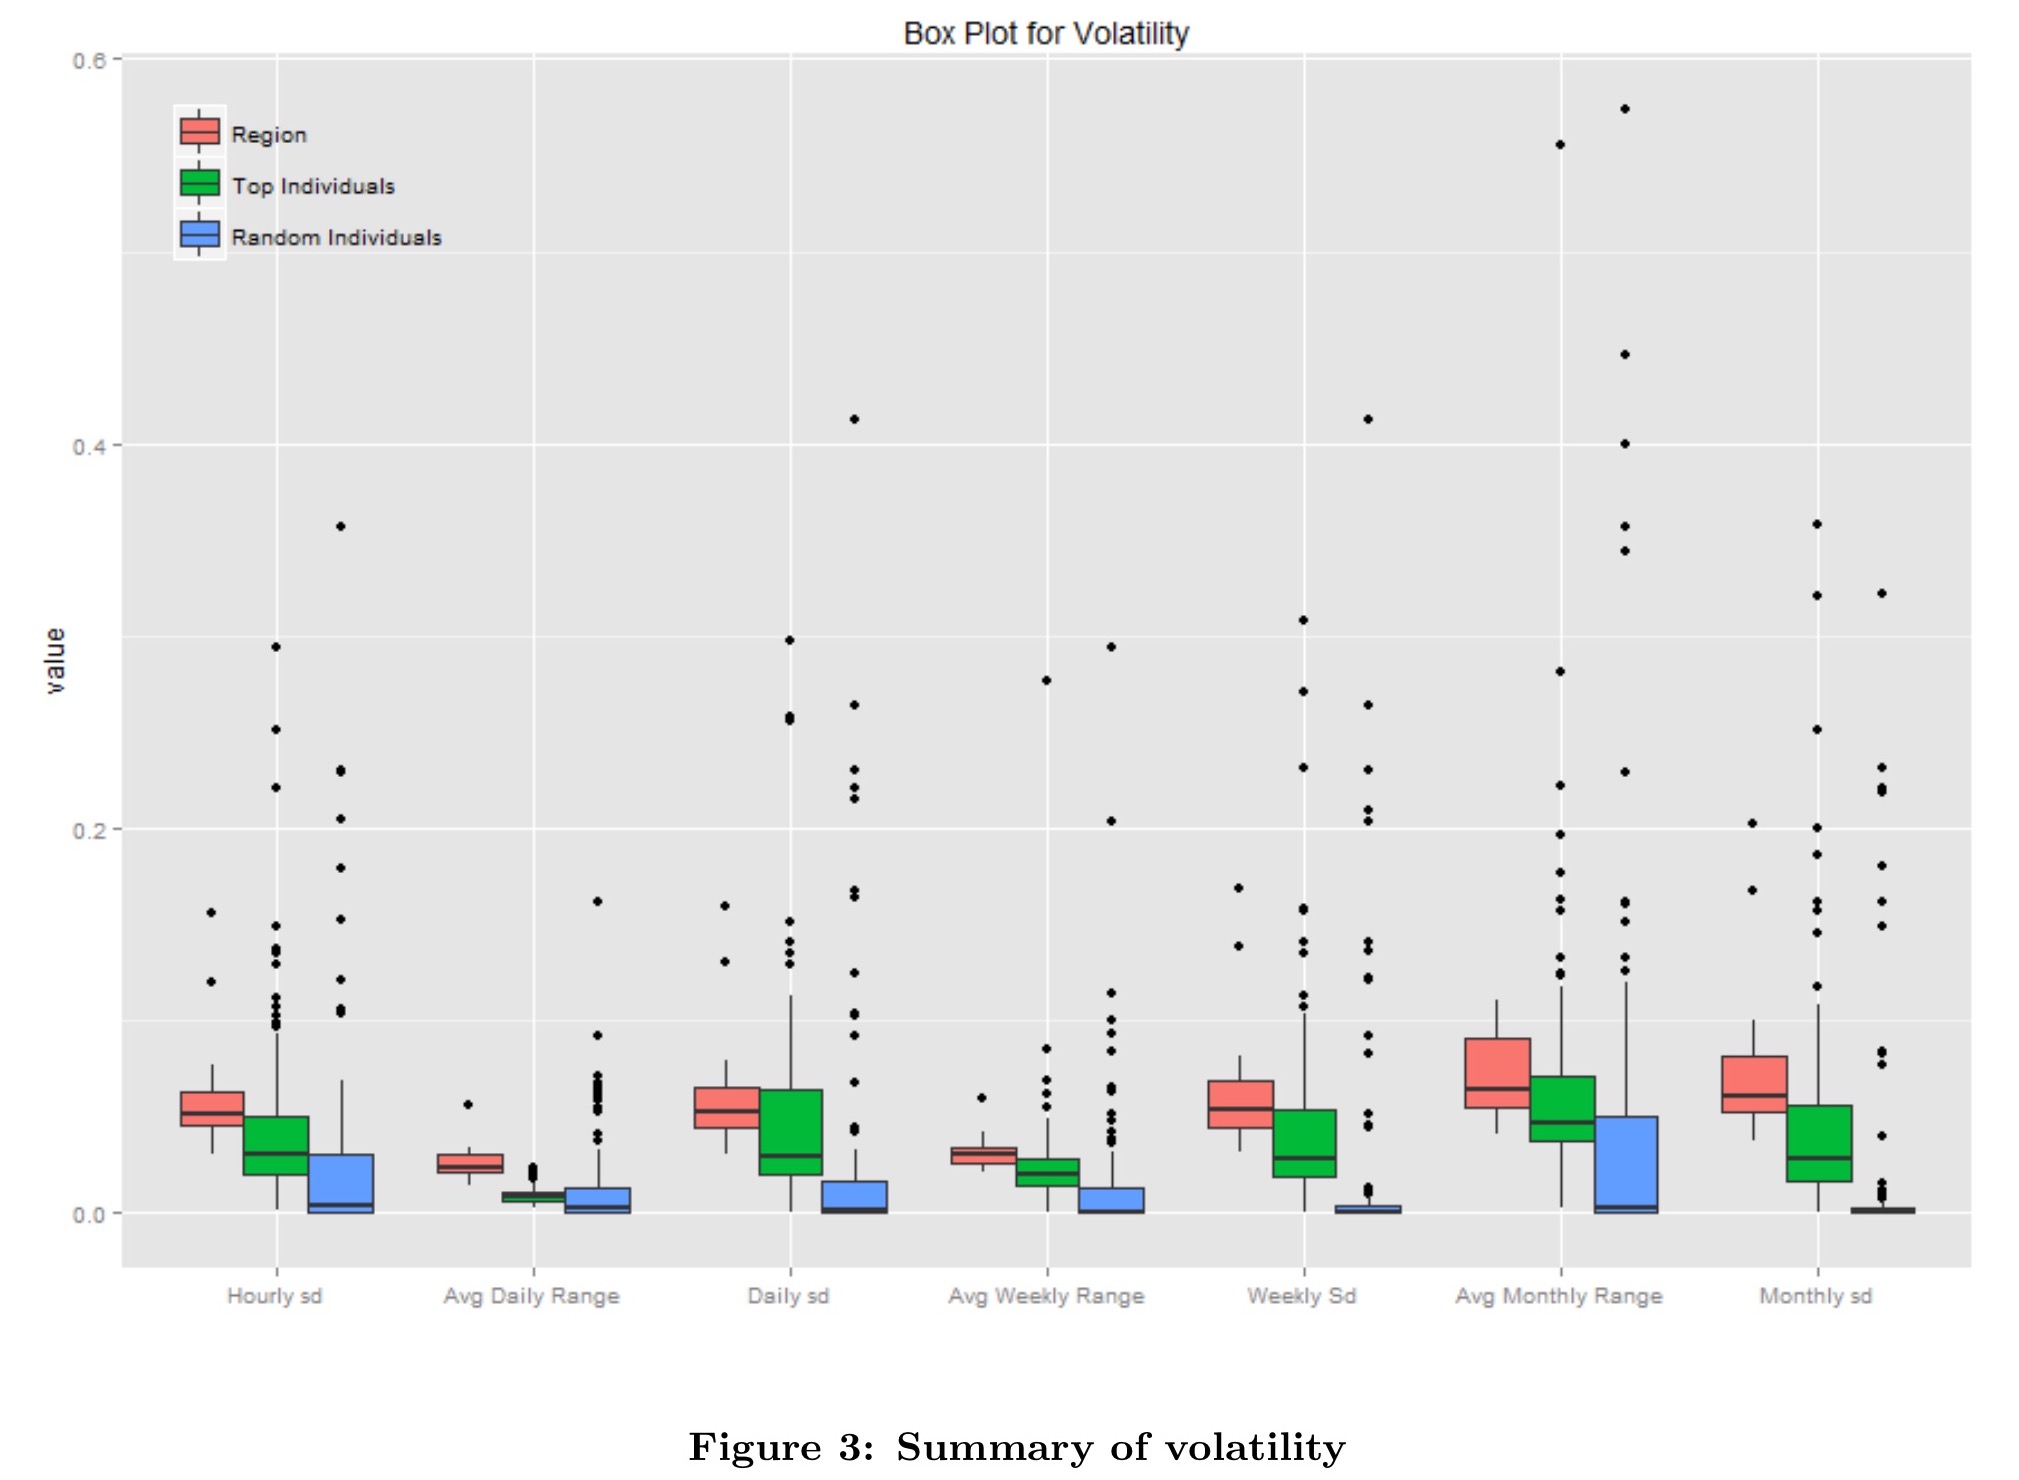
The higher volatility of regions overall is again explained by the fact that regions attract new customers over time, whereas individual customers tend to have more stable demand.
Note the reasonable number of outliers in the above data. The dataset reveals three broad classes of customer. The first (majority) class of customers seems to represent lift-and-shift of existing applications onto public cloud infrastructure. The application stacks are defined to run with a relatively fixed amount of computational resource, and indeed that’s what they do. A second group of customers exhibit usage demand floating around a relatively small range, indicating some dynamic scaling. A minority of customers appear to be deploying cloud-native style applications more fully exploiting dynamic scaling:
These customers are likely using dynamic scaling techniques to minimise costs and thus appear as outliers relative to the typical customer. However, since these customers are not the norm and, as we previously showed, the bursts are not strongly correlated with broader market demand, we do not observe fluctuations of this magnitude at the regional level.
CPU utilisation patterns
So now we know what you probably already suspected: most people simply power on a number of VMs and leave them running.
Since deployments are billed by the minute, there is a financial incentive to re-architect software to make use of these benefits and thus we expect them to be more widely adopted as time goes. Actual CPU utilization offers a lens into a potential future where adoption is widespread.
(AWS Lambda pricing goes down to time slices of 100ms!).
If we look at max CPU utilization in a datacenter over a period of one week we do indeed see much more variation:
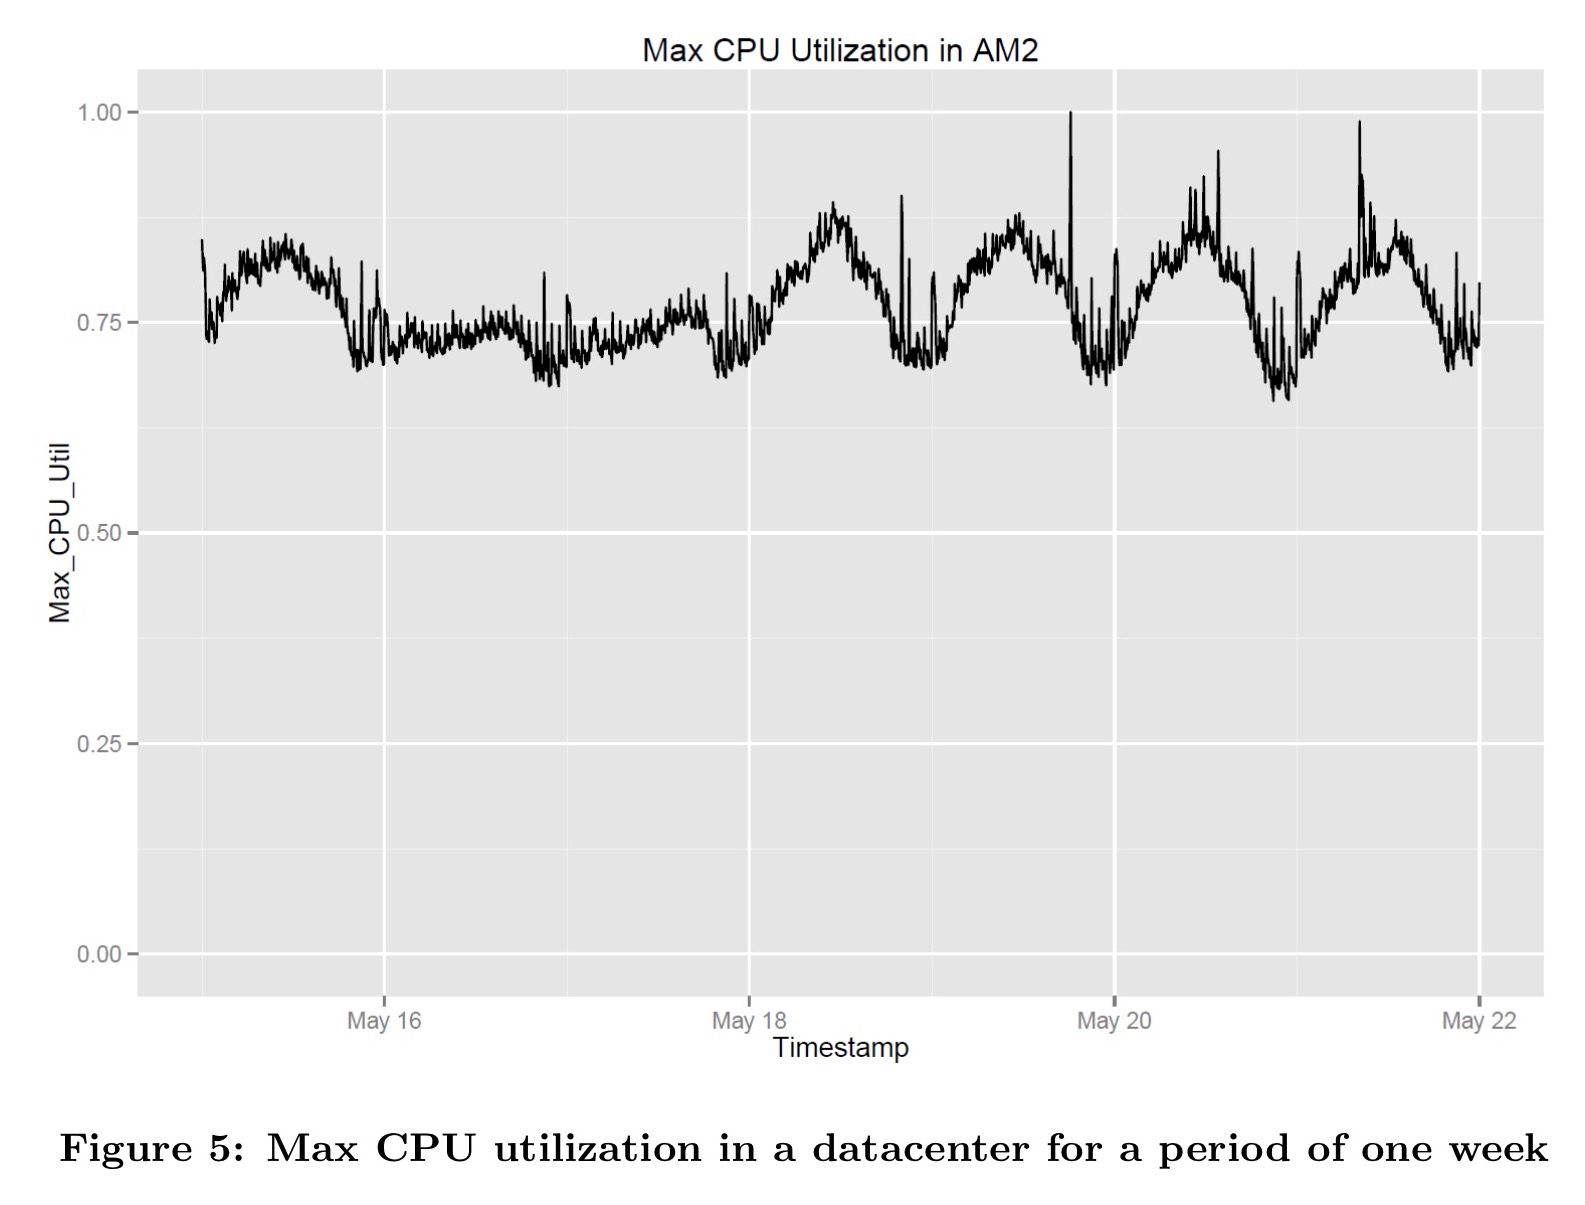
Midday has higher CPU utilisation for all weekdays, and weekend utilisation is steady and lower.
Variation in max CPU utilization measured at 5-minute intervals is 10x higher than the variation in VM usage. If CPU usage is indeed a lens into future behavior, then we should expect datacenter utilization to transition from the current regime of low volatility, to much more meaningful swings in demand. This would in turn raise the efficiency gains from using dynamic prices.
The kind of fluctuations seen at the CPU usage level – and that we might see at the region level with more widespread deployment of serverless and cloud-native application architectures, are similar to the demand fluctuations in the classic load pricing industries.
Given that 70% of the variation is predictable based on time alone, a simple predictable time of day pricing mechanism is adequate to obtain most of the efficiency gains. The suggested scheme is simply to have peak and off-peak pricing, with off-peak times set in advance (e.g., evenings and weekends).

6 thoughts on “Usage patterns and the economics of the public cloud”
Comments are closed.