Identifying and quantifying architectural debt – Xiao et al., ICSE 2016
(Update: thanks to Lu Xiao for providing an open access version of this paper, the link above has now been updated to point to it.)
So finally we have arrived at Xiao et al.’s 2016 ICSE paper (see the write-ups on Design Rule Spaces and Architectural Hotspots from last week for background). In ‘Identifying and quantifying architectural debt’ Xiao et al. combine their work on identifying error-prone Design Rule Spaces (with a twist) with a debt model that shows how technical debt grows over time for the most common architectural anti-patterns.
Although the concept of TD (Technical Debt) has been influential, it has until now largely been a metaphor. The differences with real (financial) debt are crucial. A real debt always starts from a principal, and grows with a certain interest rate. How to quantify the principal and interest rate in software investments has been a challenge. Our goal is to advance the understanding and management of architectural debt, a type of technical debt, by quantifying it.
Essential results
After studying seven Apache open source projects (Camel, Cassandra, CXF, Hadoop, HBase, PDFBox, and Wicket) and finding between 74 and 204 instance of architectural debt in each project, the authors found that from 51%-85% of the maintenance effort in these projects is consumed by paying interest on those debts. As we also saw last week, non-trivial portions (20-61%) of the maintenance effort is consumed by just five architectural debts in each project.
Our evaluation also revealed that about half of the identified debts fit linear regression models, indicating a steady increase in the penalty that these debts incur. About 1/3, 1/10, and less than 1/10 of all debts fit polynomial, logarithmic, and exponential models respectively, indicating the interest rate trends of these dates can vary drastically.
The process of finding architectural debts
The process of finding architectural debts is based on the Design Rule Space analysis that we looked at last week. For evolutionary coupling, whereas in their previous work the authors counted directly the number of times two files changed together, in this work they switch to recording the conditional probability that the file in the DSM column will change if the file on the row is changed. The result is called a History Coupling Probability (HCP) Matrix.
Overall there are four stages:
- Crawl the projects to uncover the error-prone files. Select a set of DRSpaces each led by a file in the error space.
- Create an index showing how each of the spaces identified in step 1 evolves over subsequent releases
- Measure the maintenance costs incurred by each sequence over time
- Rank the severity of each architectural debt according to the amount of maintenance costs it accumulates in the project’s history
To identify how DRSpaces evolve over time, the authors observe that “in most cases, even though the number of files in a FileSet may vary in different releases, they are always connected to at least one file over all releases… we thus call this one special file the Anchor File of the group.”
The FileSet groups for the selected DRSpaces are created using four ‘indexing’ patterns (four patterns shown to be strong indicators of technical debt in the author’s prior work). These are:
Hub, in which the anchor file and each member have structural dependencies is both directions, and history dominance in at least one direction.
The anchor is an architectural hub for its members. This pattern corresponds to cyclic dependency, unhealthy inheritance (if the anchor file is a super-class or interface class) and unstable interface (if the anchor file has many dependents). Informally, such structures are referred to as “spaghetti code,” or “big ball of mud.”
Anchor Submissive, in which each member file structurally depends on the anchor file, but each member historically dominates the anchor. “This pattern corresponds to an unstable interface, where the interface is submissive in changes.”
Anchor Dominant, in which each member file structurally depends on the anchor file, and the anchor file historically dominates each member file. “This pattern corresponds to the other type of unstable interface, where the interface is dominant in changes.”
Modularity Violation, in which there are no structural dependencies between the anchor and any member, however they historically couple with each other.
In a modularity violation the anchor and member files share assumptions (“secrets”) that are not represented in any structural connection.
To qualify as a true architectural debt candidate there are two other filters that are applied:
- The FileSet must be present in some (configurable) percentage of all the project releases (i.e., it can be tracked over time). The authors set this at 50%.
- It’s maintenance costs must increase over time.
For every real debt identified using this process the authors attempt to fit four different types of regression model: linear, logarithmic, exponential, and polynomial.
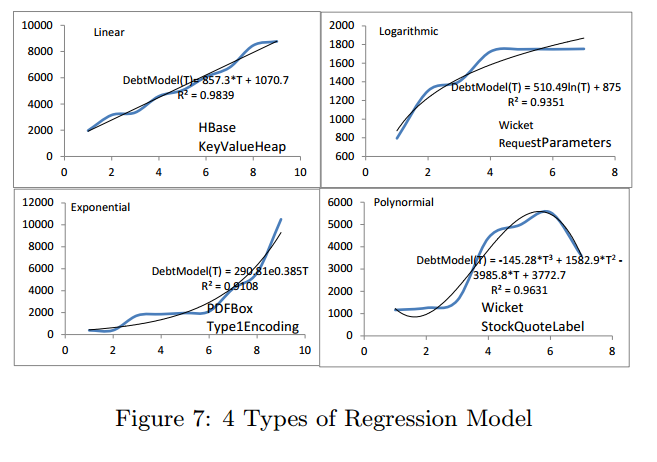
In a linear model, the penalties of a debt increase at a stable rate in each version. In a logarithmic model, the penalties of a debt increase more slowly over time (e.g., when developers refactor a group of files, they become easier change, so the interest rate decreases over time). In an exponential model, the penalties of a debt increase at ever-faster rates over time (e.g., the structure of a tangled group of files worsens, often in the early stages of a project, before anyone worries about TD). In a polynomial model, the penalties of a debt fluctuate over the releases.
When choosing the best fitting model, priority is given to the linear, logarithmic and exponential models which represent stable, decreasing, and increasing penalty interest rates respectively.
Architectural debt and its evolution
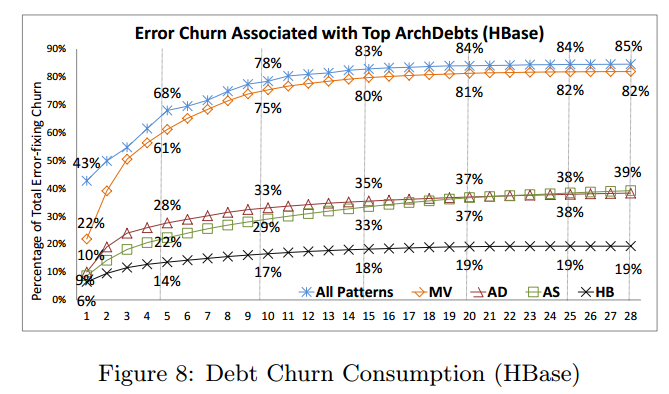
We use HBase as an example to illustrate our observations. Figure 8 (above) shows the percentage of maintenance effort associated with the files in FileSets of all identified ArchDebts in HBase. The x-axis is the number (from 1 to 28) of identified architectural debts. The y-axis is the accumulated percentage of maintenance effort associated with the top x ArchDebts. Each line represents the percentage of each type of debt. This figure depicts, from bottom to top, you can see: Hub, Anchor-Submissive, Anchor-Dominant, and Modularity Violation debts respectively. The line on the top is the total percentage of the 4 types of debts. The values of the top line are not simply the sum of the values of the 4 types because different types of debts may share some files.
Key findings:
- Architectural debts consume a significant percentage (85%) of the total project maintenance effort.
- The top few architectural debts consume a large percentage of maintenance effort. The top 5 modularity violation debts alone consume 61% of total effort.
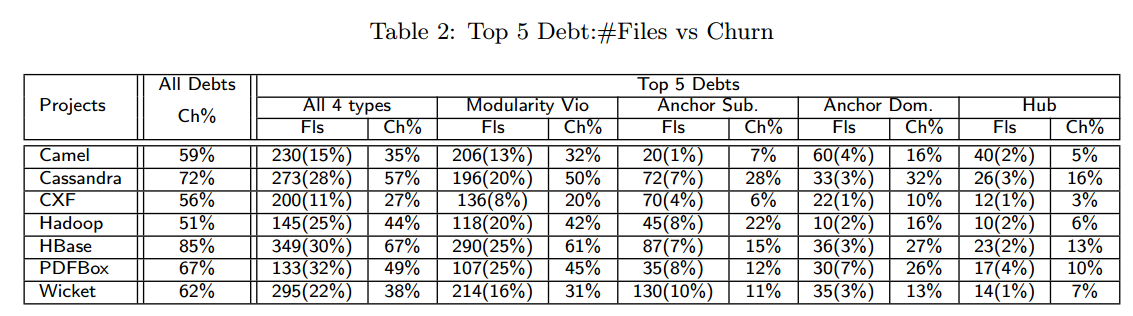
- Modularity Violation debt is the most common and expensive debt – combined it accounts for 82% of the total effort in HBase. “We made consistent observations from all 7 projects, as summarized in Table 2 [below].”
- The top 5 architectural debts contain only a small number of files, but consume a large amount of the total project effort.. For all projects, the top 5 architectural debts contain from only 11% to 32% of the error-prone files, but consume 27% to 49% of the total effort.
- About half of all architectural debts accumulate interest at a constant rate. Only a small portion of debts accumulate interest at a faster (less than 7% in exponential) or slower (less than 22% in logarithmic) rate.
The authors present a worked example of the growth of a technical debt in Apache Camel. This is a Hub debt anchored in the file ProcessorDef. In release 2.0.0 this Hub had 10 member files and HCP probabilities between 50% to 100%.
The dependents of ProcessorDef are highly coupled with each other. This is problematic in 3 ways: 1) the parent class ProcessorDef depends on each subclass and each dependent class (unhealthy inheritance [21]); 2) the parent class is unstable and often changes with its subclasses and dependent classes (unstable interface [21]). 3) RouteContext forms cyclic dependencies with 9 files (cycles). Without fixing these flaws, we expect the maintenance costs of this group to grow.
By release 2.2.0 the hub has enlarged with 3 more subclasses and 6 more general dependencies. In the following releases, the hub grows larger still – by release 2.12.4 it has 9 subclasses and 18 general dependents. “In addition, 6 of the 18 general dependents of ProcessorDef also become its grandchildren. The inheritance tree has increased in width and depth.” The maintenance costs fit a linear regression model, and in every release, developers contribute on average 159 more lines of code to fix errors in this hub.
Although this model can only be obtained after the costs and penalty have been accumulated, one could use our approach to detect architecture flaw patterns at any point (as described in Hotspots), monitor how file groups grow, monitor the formation of debts, and prevent significant costs by investing in proper refactorings.