Benchmarking spreadsheet systems Rahman et al., Preprint
A recent TwThread drew my attention to this pre-print paper. When spreadsheets were originally conceived, data and formula were input by hand and so everything operated at human scale. Increasingly we’re dealing with larger and larger datasets — for example, data imported via csv files — and spreadsheets are creaking. I’m certainly familiar with the sinking feeling on realising I’ve accidentally asked a spreadsheet to open up a file with 10s of thousands of rows, and that my computer is now going to be locked up for an age. Rahman et al. construct a set of benchmarks to try and understand what might be going on under the covers in Microsoft Excel, Google Sheets, and LibreOffice Calc.
Spreadsheets claim to support pretty large datasets these days – e.g. five million cells for Google Sheets, and even more than that for Excel. But in practice, they struggle at sizes well below this.
With increasing data sizes… spreadsheets have started to break down to the point of being unusable, displaying a number of scalability problems. They often freeze during computation, and are unable to import datasets well below the size limits posed by current spreadsheet systems.
While a database is barely getting started at 20,000 rows, a spreadsheet could be hanging. What learnings from the database community could help improve spreadsheet performance?
Two benchmark suites help generate insights into this question:
- The Basic Complexity Testing (BCT) suite assesses the time complexity of basic operations over a range of data sizes. The goal is to understand whether, for example, response time is constant, linear, or worse. Given this information, it’s possible to figure out when a spreadsheet ceases to be interactive, defined as failing to respond within 500ms.
- The Optimization Opportunities Testing (OOT) suite is carefully designed to probe whether common database techniques such as indexes and incremental updates are employed, and hence to spot opportunities for improvement.
The TL;DR summary is that spreadsheets could be a lot better than they are today when operating on larger datasets.
First, we need some spreadsheets
The seed spreadsheet for the analysis in the paper was a weather data spreadsheet containing 50,000 rows and 17 columns (repeating the experiments with other typical spreadsheet datasets did not yield any new insights). First the seed spreadsheet was scaled up 10x to yield 500,000 rows, and then variations were created with different sampling rates (row counts) and mix of formula-cells to simple value cells.

Basic complexity testing
The basic spreadsheet operations are summarised in the table below, and divided into three groups: load, update, and query.
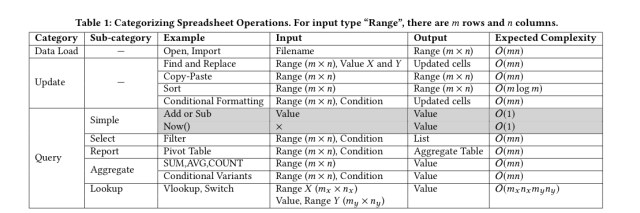
Simple data loading is linear in spreadsheet size for Excel and Calc. Google Sheets implements lazy loading for value cells that are outside of the current viewport giving a more constant load time, but doesn’t do so for formula-cells.

With formula-value datasets, Excel, Calc, and Google Sheets fail to meet the interactivity barrier at just 6000, 150(!) and 150 rows respectively.
In a similar vein, sorting causes problems on very small datasets (less than 10K rows):
Sorting triggers formula recomputation that is often unnecessary and can take an unusually long time.
Conditional formatting breaks at around 80K rows.
For query operations the authors study filtering (selecting matching rows), pivoting, aggregation (e.g. count) and lookups (VLOOKUP).
Filtering takes a suspiciously long time for Formula-Value for Excel, violating interactivity at 40K row, possibly due to formula recomputation. The other systems avoid this recomputation, but are slower than Excel for value-only datasets.

With pivot tables there’s a surprise result with Calc being 6x faster than Excel (and 15x faster than Google Sheets). However, Calc (and Google Sheets) both do comparatively poorly on aggregation.
For VLOOKUPs both Calc and Google Sheets seem to implement the equivalent of a full table scan (not even stopping early once the value has been found!). Excel is more efficient if the data is sorted.
All told, it’s a sorry scorecard. The follow table summarises how close to their respective documented scalability limit each spreadsheet can get for the different kinds of basic operations. Finally a metric that penalises marketing departments for exaggeration!

Optimisation opportunities testing
The optimisation opportunities benchmarks are designed to probe whether or not spreadsheets maintain and use indexes (no evidence was found to suggest that they do); whether they employ a columnar data layout to improve computation performance (they don’t); whether they exploit shared computation opportunities through common sub-expressions in formulas (they don’t); whether they can detect and avoid entirely redundant computation in duplicate formulae (they don’t); and whether or not they take advantage of incremental update opportunities. Can you guess? They don’t.
Towards faster spreadsheets
Many ideas from databases could potentially be employed to make spreadsheets more scalable. One of the easiest to employ is incremental update for aggregation operations (e.g. the SUM of a column can be update based on the previous sum and a delta). More aggressively, a database backend could be used behind a spreadsheet interface, translating formulae into SQL queries. Going further, approximate query processing could also help meet interactivity targets
Overall, there is a plethora of interesting and challenging research directions in making spreadsheet systems more effective at handling large datasets. We believe our evaluation and the resulting insights can benefit spreadsheet system development in the future, and also provide a starting point for database researchers to contribute to the emergent discipline of spreadsheet computation optimization.

Hi Adrian,
Thank you for this nice writeup, its quite interesting to see folks take interest in spreadsheet performance. There is lots of “food for thought” in terms of optimization vectors. Happy to chat more – you can ping me on my email.
Reblogged this on Marius reshares.