The inflection point hypothesis: a principled debugging approach for locating the root cause of a failure Zhang et al., SOSP’19
It’s been a while since we looked a debugging and troubleshooting on The Morning Paper (here’s a sample of earlier posts on the topic). Today’s paper introduces a root cause of failure detector for those hard-to-pin-down bugs. Whereas most root cause analysis systems start from the failure and work backwards, Kairux starts from the beginning of the program execution and works forwards. It’s based on the simple idea that the root cause is likely to be found where the failing execution deviates from successful executions.
If we model an execution as a totally ordered sequence of instructions, then the root cause can be identified by the first instruction where the failure execution deviates from the non-failure execution that has the longest instruction sequence prefix in common with that of the failure execution.
This point where the failing run deviates from the longest successful instruction sequence prefix is called the inflection point, and the Inflection Point Hypothesis says that the inflection point is likely to be the root cause.
The definition of root cause itself is taken from Wilson:
“Root cause is that most basic reason for an undesirable condition or problem which, if eliminated or corrected, would have prevented it from existing or occurring.”
Working forward from the beginning of a program, our root cause candidate will be the first time we go where no successful run has ever gone before. Looking backwards from the point of failure, this will also be the point of departure with the longest distance from the first instruction of the failure execution.
Before you invest any more of your time in understanding how Kairux efficiently finds this root-cause candidate, you might like to know how well it works!
We evaluated Kairux on 10 randomly sampled real-world failures reported in Hadoop, HBase, and ZooKeeper. Kairux can accurately locate the root cause in 7 of them. Some of these failures are among the most difficult to debug, such as data races.
Here’s an example of a real-world bug, HDFS-10453, that originally took a month to track down. After a data node was decommissioned, HDFS was failing to replicate any under-replicated data blocks, complaining that there was not enough capacity on any data node.
Here’s the original code:
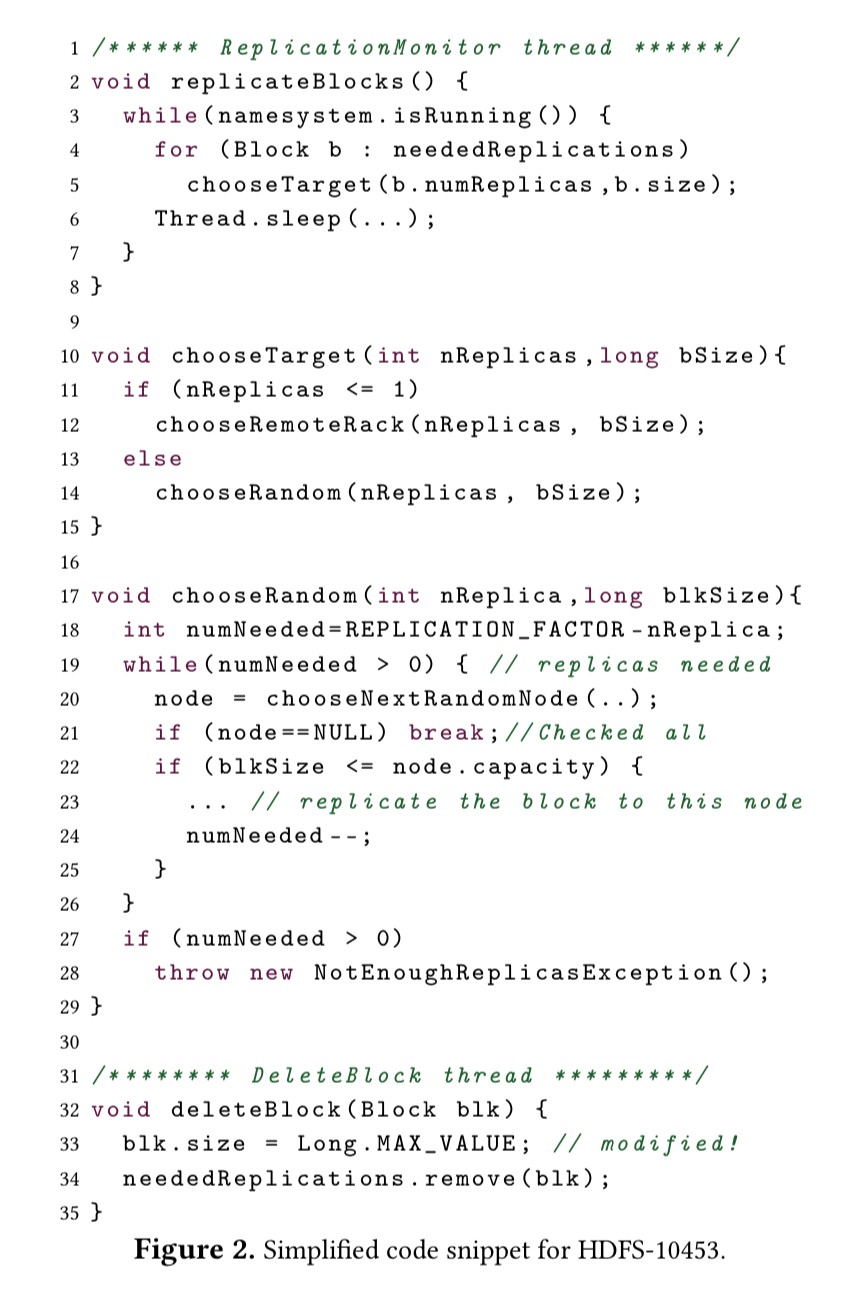
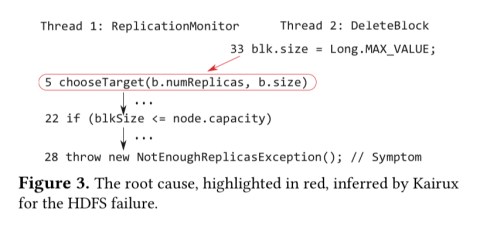
The bug stems from using Long.MAX_VALUE as a special block size value to indicate that a block is being deleted. Kairux highlights line 5 as the root cause here, the point where for the first time we try to find a target with capacity to host a block of size Long.MAX_VALUE (set on L33).
For me, this example highlights both the power and the limitations of automated root cause analysis. Getting to this point in around 30 minutes (vs a month of struggling) is undoubtedly impressive. On the other hand, for me the true root cause is the decision to use a magic block size value to indicate deletion rather than e.g. an explicit is_deleted flag.
Implementing Kairux
Kairux is implemented in 3,473 lines of Java, taking advantage of the Chord static analysis framework to perform static and dynamic slicing, and the JVM Tool Interface (TI) to set breakpoints. There’s a bunch of C++ code to drive JVM TI, and a sprinkling of Python for good measure to drive the unit tests of the system under test.
Finding the longest successful run prefix of a failing run requires a few things, chief of which are a test to reproduce the failure, and the set of all possible non-failure instruction sequences. With a bit of luck we’ll be able to snare the bug in a reproducible test case, but generating all possible execution paths isn’t going to happen any time soon!
Instead, Kairux uses the rich unit test suite that is an integral part of any real system to obtain a set of non-failure executions, and then uses the instruction sequences from test executions as building blocks…
The starting point is the instruction where the symptom manifests. Static program analysis is used to work back from here and find all the instructions that may have a causal dependency on the program location of the symptom (a static slice). Kairux sets breakpoints at all of these locations and runs the test that reproduces the failure. When the breakpoints fire, Kairux captures a trace and does dependency analysis on the traces to find a dynamic slice. Kairux can follow causal dependencies across network invocations when communication libraries are suitably instrumented.
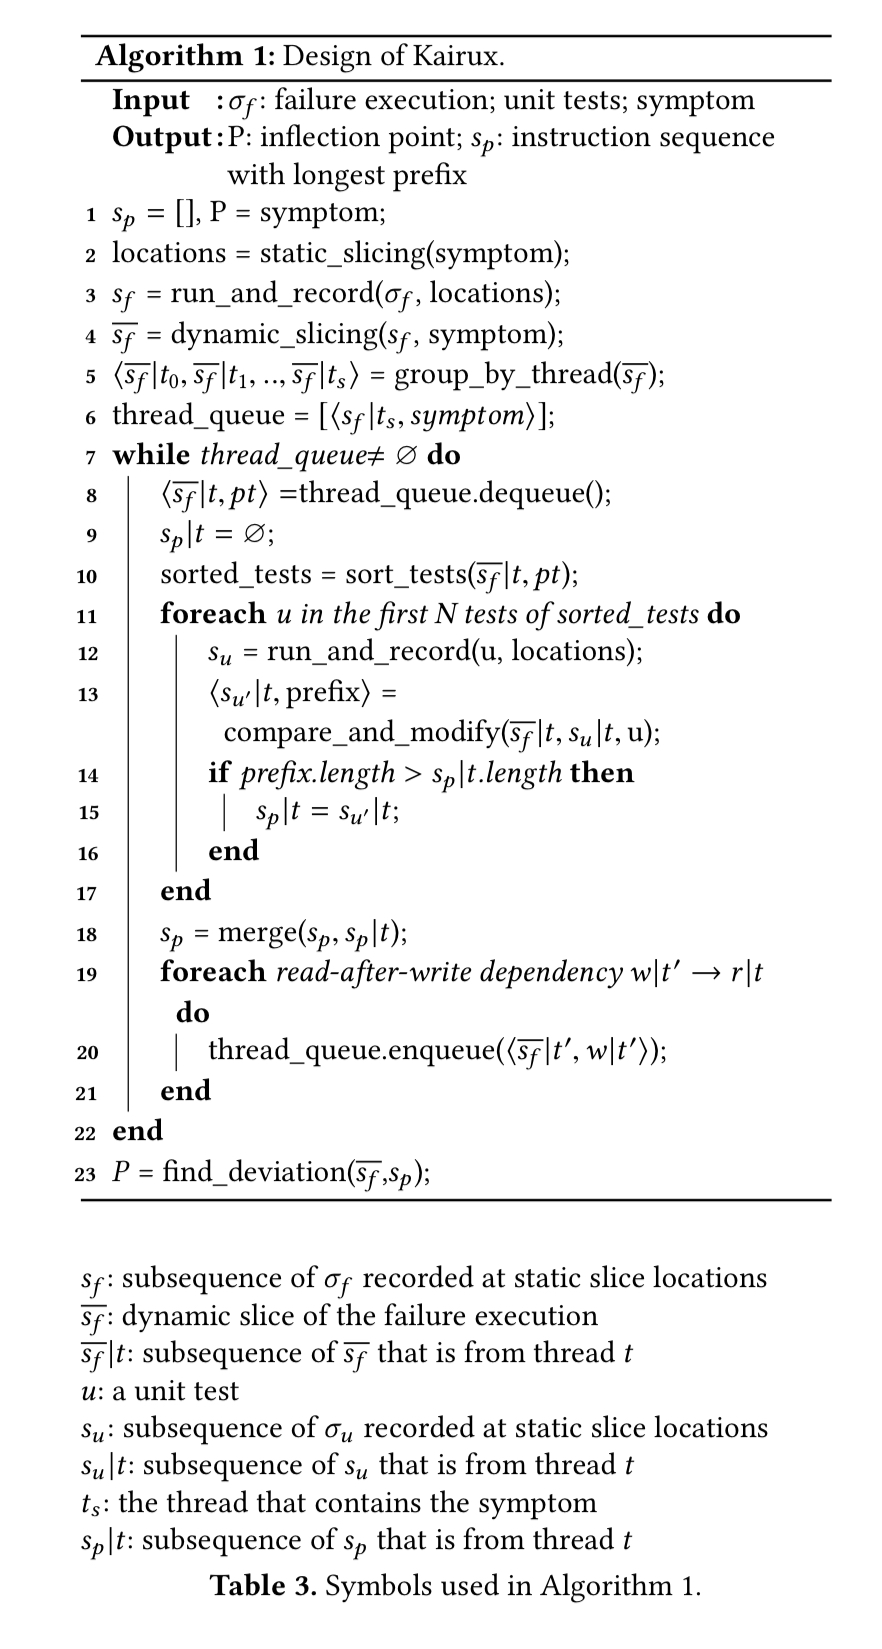
Given the dynamic slice, Kairux figures out the match between existing unit tests in the test suite and the target set of instructions. It will even try and modify existing tests to produce non-failing executions that get even closer to (have a longer shared prefix with) the failing instruction sequence. The full details of how that works can be found in section 4.3 of the paper, ‘compare and modify’.
Kairux in action
Kairux is put to the test against 10 real world failures from HBase, HDFS, and ZooKeeper. It found the root cause for seven of them, as shown in the table below. In the other three cases, Kairux fails on two of them due to a lack of unit tests in the offending area, and on the third because the error state is on disk and not accessible to Kairux.
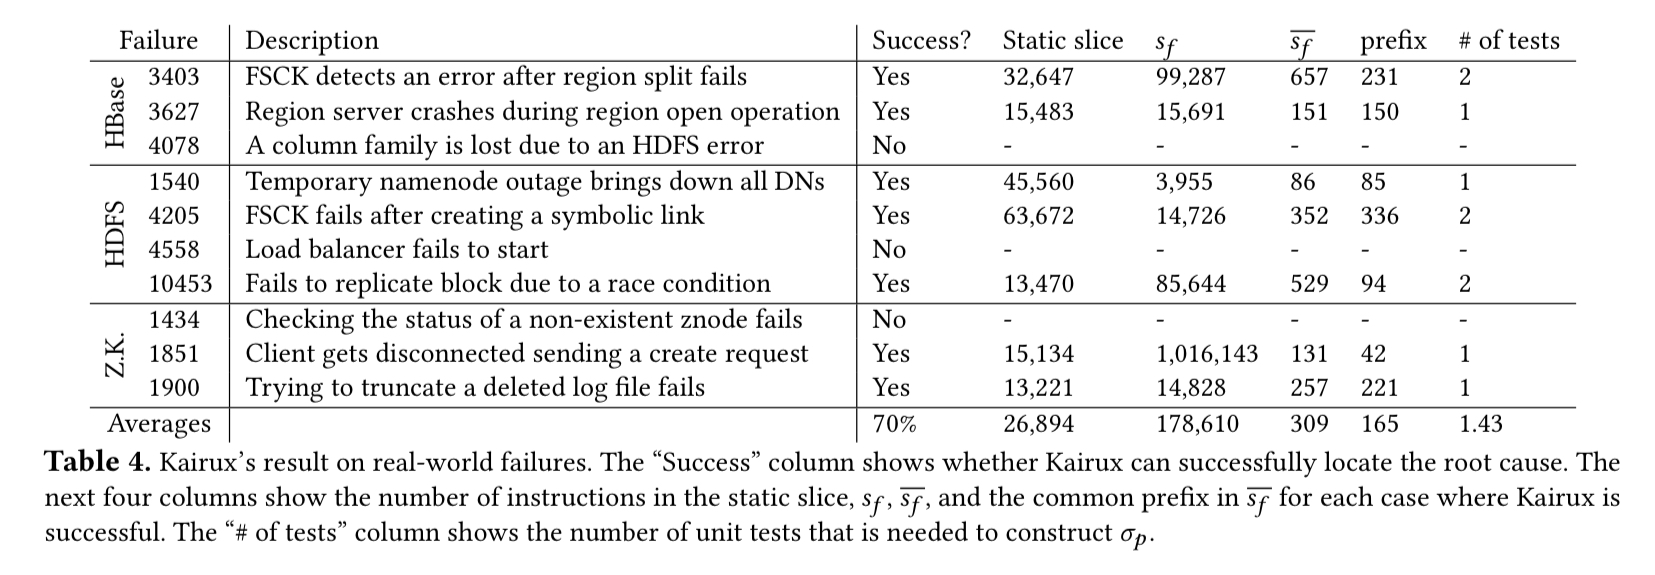
In each case, it took 32 minutes or less for the Kairux analysis to run.

Do you know whether the Kairux tool will be released?