LEMNA: explaining deep learning based security applications Guo et al., CCS’18
Understanding why a deep learning model produces the outputs it does is an important part of gaining trust in the model, and in some situations being able to explain decisions is a strong requirement. Today’s paper shows that by carefully considering the architectural features of a given model, it’s possible to co-design an explanatory model. The idea is applied to deep learning models in the security domain (to detect the start of functions within binaries, and to detect malware) where for reasons we’ll look at next, the assumptions made by black-box explainers such as LIME don’t apply.
Like LIME, LEMNA approximates a local area of a complex deep learning decision boundary using a simple interpretable model. Unlike LIME, LEMNA can handle non-linear local boundaries, and feature dependencies (e.g., for a sequences fed into RNNs, which explicitly model dependencies in sequential data).
Why explainability matters
While intrigued by the high accuracy, security practitioners are concerned about the lack of transparency of deep learning models, and thus hesitate to widely adopt deep learning classifiers in security and safety-critical areas.
Explanations that are understandable by security analysts can help to build trust in trained models, and also to troubleshoot classification errors. “We argue that classifier reliability and trust do not necessarily come from a high classification accuracy on the training data… (instead) trust is more likely to be established by understanding model behavior .”
Some of the ways that explanations can help to build trust include:
- Demonstrating that the model has captured well-know heuristics (i.e., explanations match the knowledge of human experts)
- Demonstrating that the model is able to capture new patterns of knowledge, which makes sense to human experts when explained.
- Explaining the reasons behind a false negative or false positive (i.e., highlighting the features that mislead the model), such that a human expert can understand why the mistake was made (and see that the mistake was in some way ‘reasonable’).
Challenges explaining security DNNs
Unfortunately, existing explanation methods are not directly applicable to security applications… Security applications such as binary reverse engineering and malware analysis either have a high-level feature dependency (e.g., binary code sequences), or require high scalability. As a result, Recurrent Neural Networks (RNNs) or Multilayer Perceptron (MLP) models are more widely used.
A blackbox explanation system such as LIME produces a Locally Interpretable Model Explanation using a linear model to approximate the detection boundary near the input to be explained.
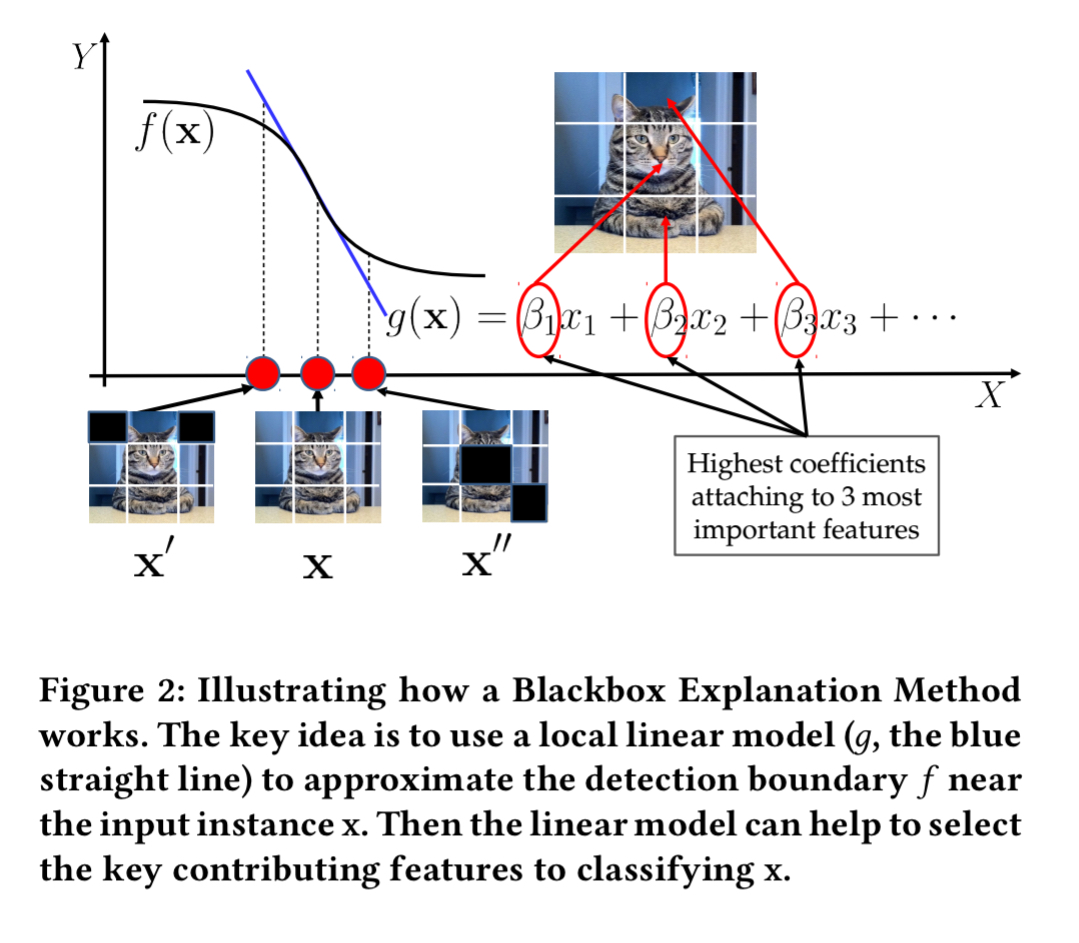
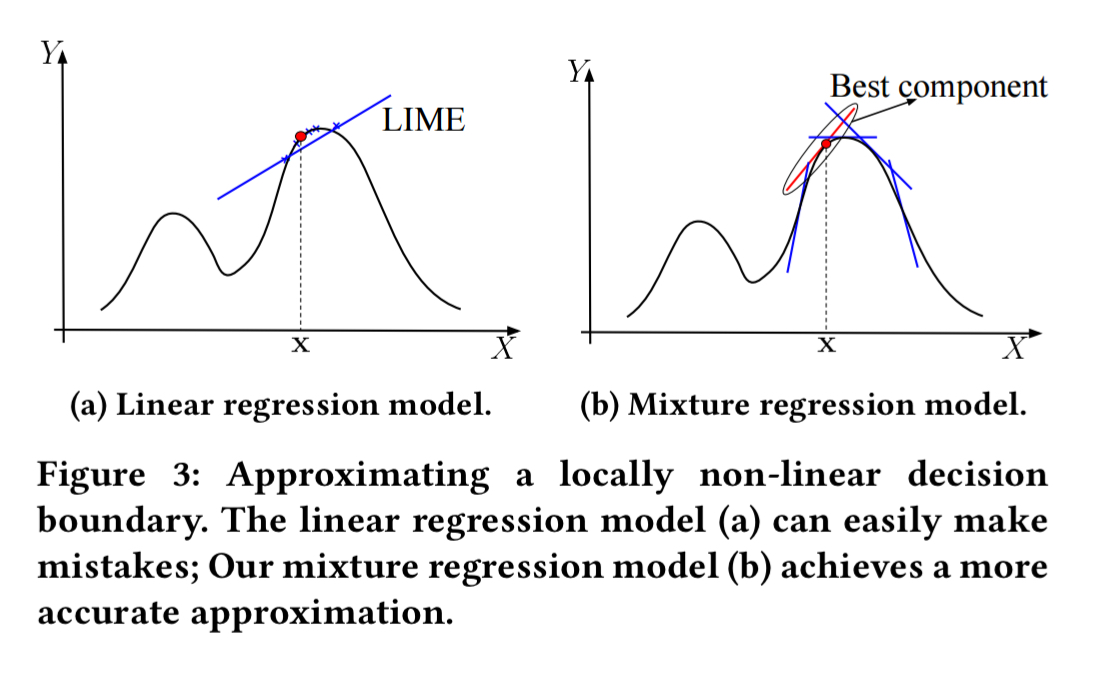
If the decision boundary is non-linear even in the local area, then this can introduce errors in the explanation process. Sampling (looking at points around the input) can easily land in areas beyond the linear region. Jumping ahead, a richer decision boundary as obtained by e.g., a mixture regression model will give higher fidelity.
Furthermore, LIME assumes input features are independent, which does not hold when the input is a sequence (e.g. of byte codes from a binary) fed into an RNN model. Here the dependency (i.e., sequencing of instructions) matters very much.
Handling feature dependencies
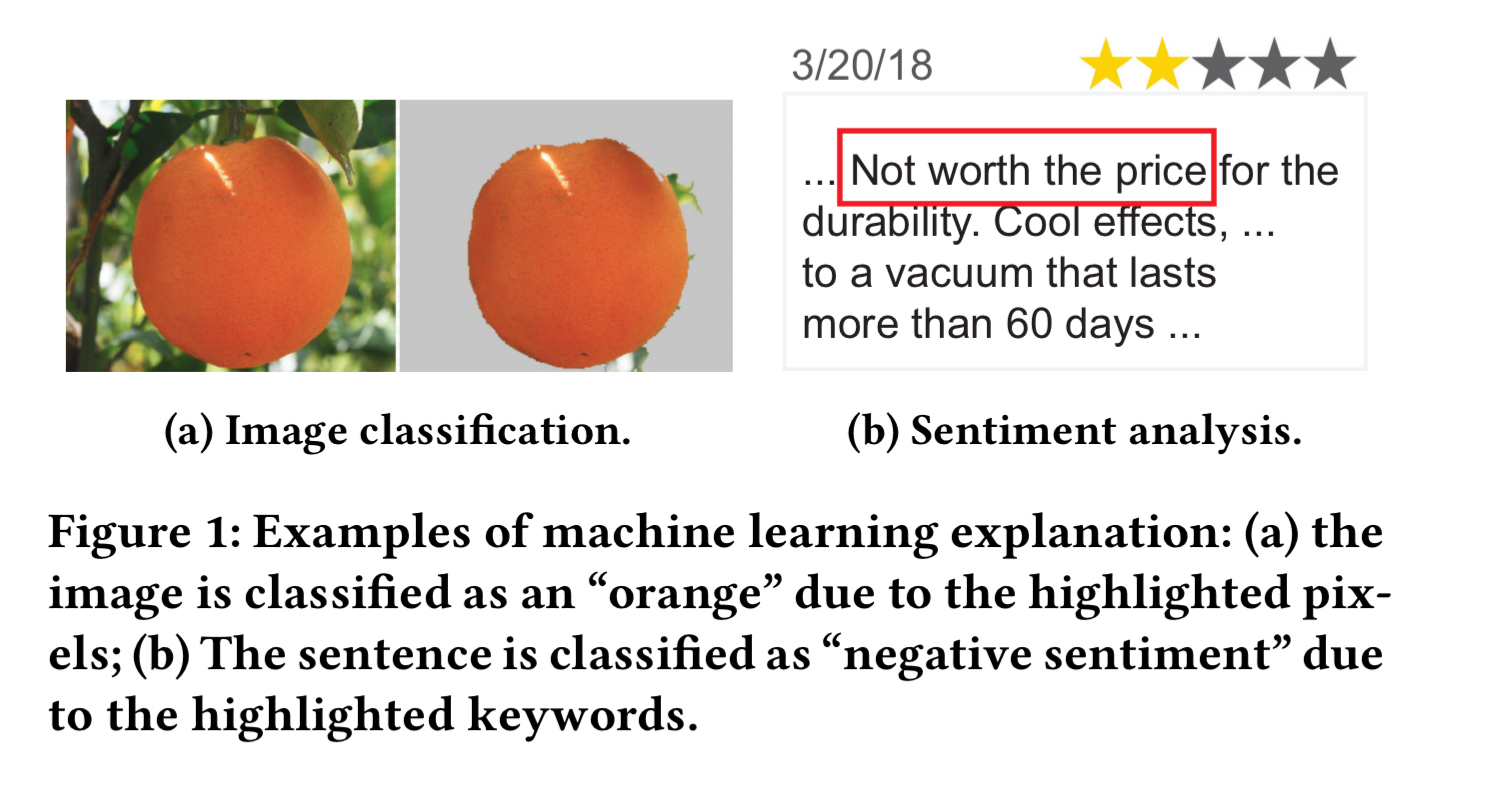
The fused lasso penalty term can be added to the loss function of models trained on features with a linear dependency (i.e. ordering dependency) among the input features. It works by restricting the coefficient weights of adjacent features to be within some small threshold. Consider producing an explanation for sentiment classification in next. With fused lasso, words next to each other in a sentence are likely to be grouped together, such that instead of an explanation simply pointing to the word ‘not,’ it can highlight instead a phrase (‘not worth the price’).
Handling non-linear boundaries
If one line isn’t enough, then use several! A mixture regression model is a combination of multiple K linear regression models, where is the weight assigned to each component model:
Given sufficient data samples, whether the classifier has a linear or non-linear decision boundary, the mixture regression model can nearly perfectly approximate the decision boundary (using a finite set of linear models).
The LEMNA explanation system
LEMNA (Local Explanation Method using Nonlinear Approximation) combines fused lasso into the learning process of a mixture regression model, so that feature dependencies and decision boundary non-linearities can be handled at the same time. The mixture regression model is expressed in the form of probability distributions and trained using Expectation Maximisation (EM).
To explain the classification of an input x the first step is to synthesize a set of data samples around x using the same approach as described in the LIME paper. This corpus of samples is then used to approximate the local decision boundary (for multi-class classification, a set of multiple mixture regression models are trained, each of which performs binary classification for one class).
From this mixture model, we then identify the linear component that has the best approximation of the local decision boundary. The weights (or coefficients) in the linear model can be used to rank features. A small set of top features is selected as the explanation result.
Targeted model patching
One neat application of LEMNA in the paper is classifier ‘patching.’ Given a misclassified instance, LEMNA’s explanation can be used to pinpoint the small set of features responsible for the miss.
Often, such instances are outliers in the training data, and do not have enough “counter examples”. To this end, our strategy is to augment the training data by adding related “counter examples,” by replacing the feature values of
with random values.
So long as we only introduce a small (e.g. 2-10) number of such samples for each case we can ‘patch’ the targeted errors without hurting the already high overall accuracy. The following table shows the result of patching the top 5 misleading features in a model and retraining for 40 epochs.
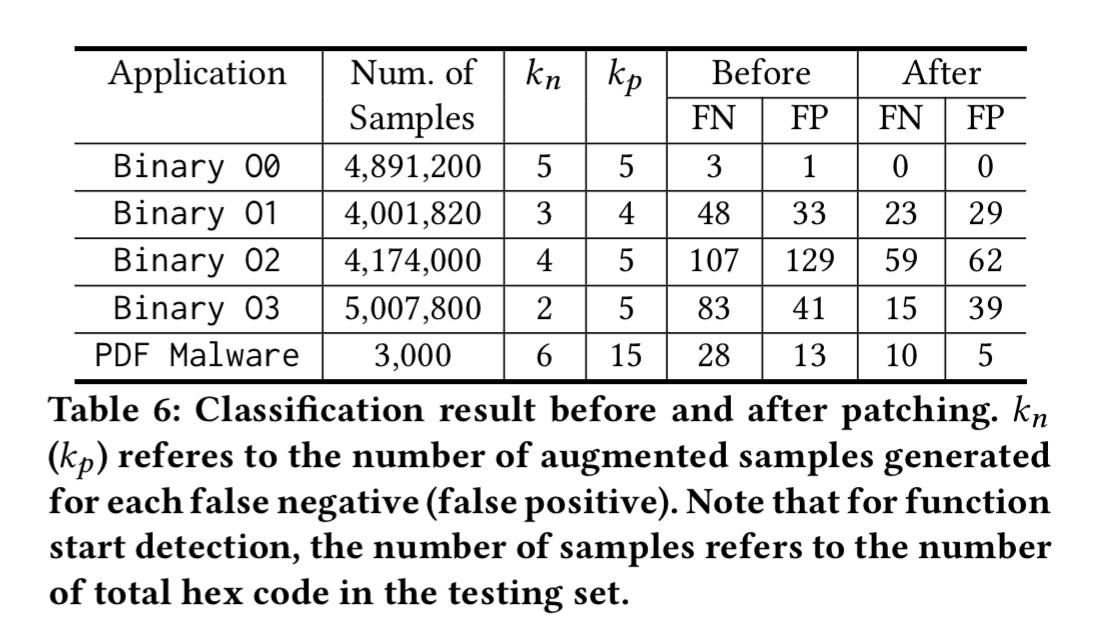
These results demonstrate that by understanding the model behavior, we can identify the weaknesses of the model and enhance the model accordingly.
Evaluation results
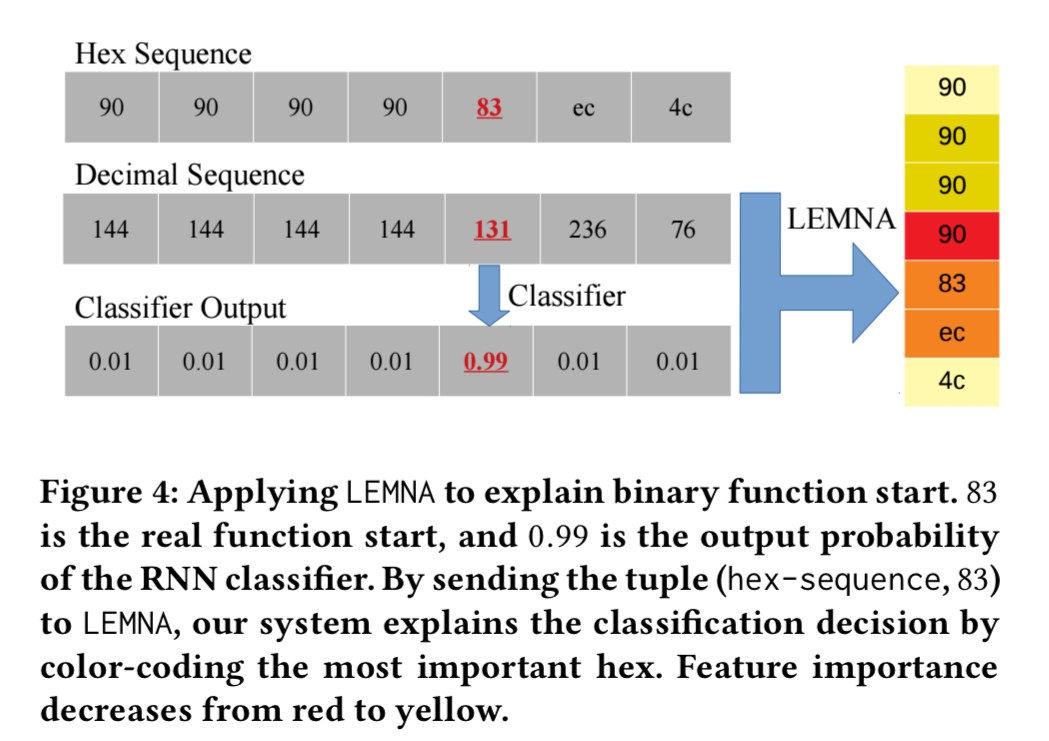
LEMNA is evaluated on an RNN-based model used to find the start of functions when reverse-engineering binaries, and on a malware classifier. Here’s an example (on the RHS) of LEMNA highlighting the ‘hot bytes’ in the instruction sequence that led to the classification of x83 as the start of a function.
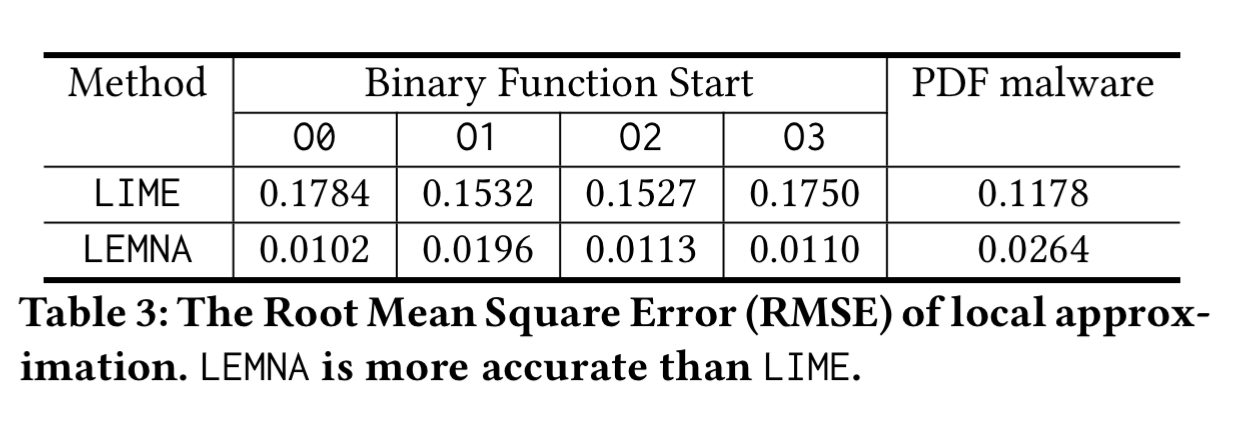
LEMNA’s local approximation accuracy for these classifiers has a root mean square error (RMSE) an order of magnitude smaller than LIME’s.
The saliency of the highlighted features in the explanation can be tested in three different ways. Given a set of highlighted features as an explanation for a classification as class C then:
- removing those features from the input should lead to a different classification (feature deduction)
- adding those features to some other sample not in class C should increase the chances of it being misclassified as a C (feature augmentation)
- crafting synthetic inputs including those features should increase the likelihood of those inputs being classified as C
For each instance in the testing set for which an explanation is given, three samples are generated, one for each case above. The positive classification rate (PCR) then measures the ratio of samples still classified as the input’s original label.
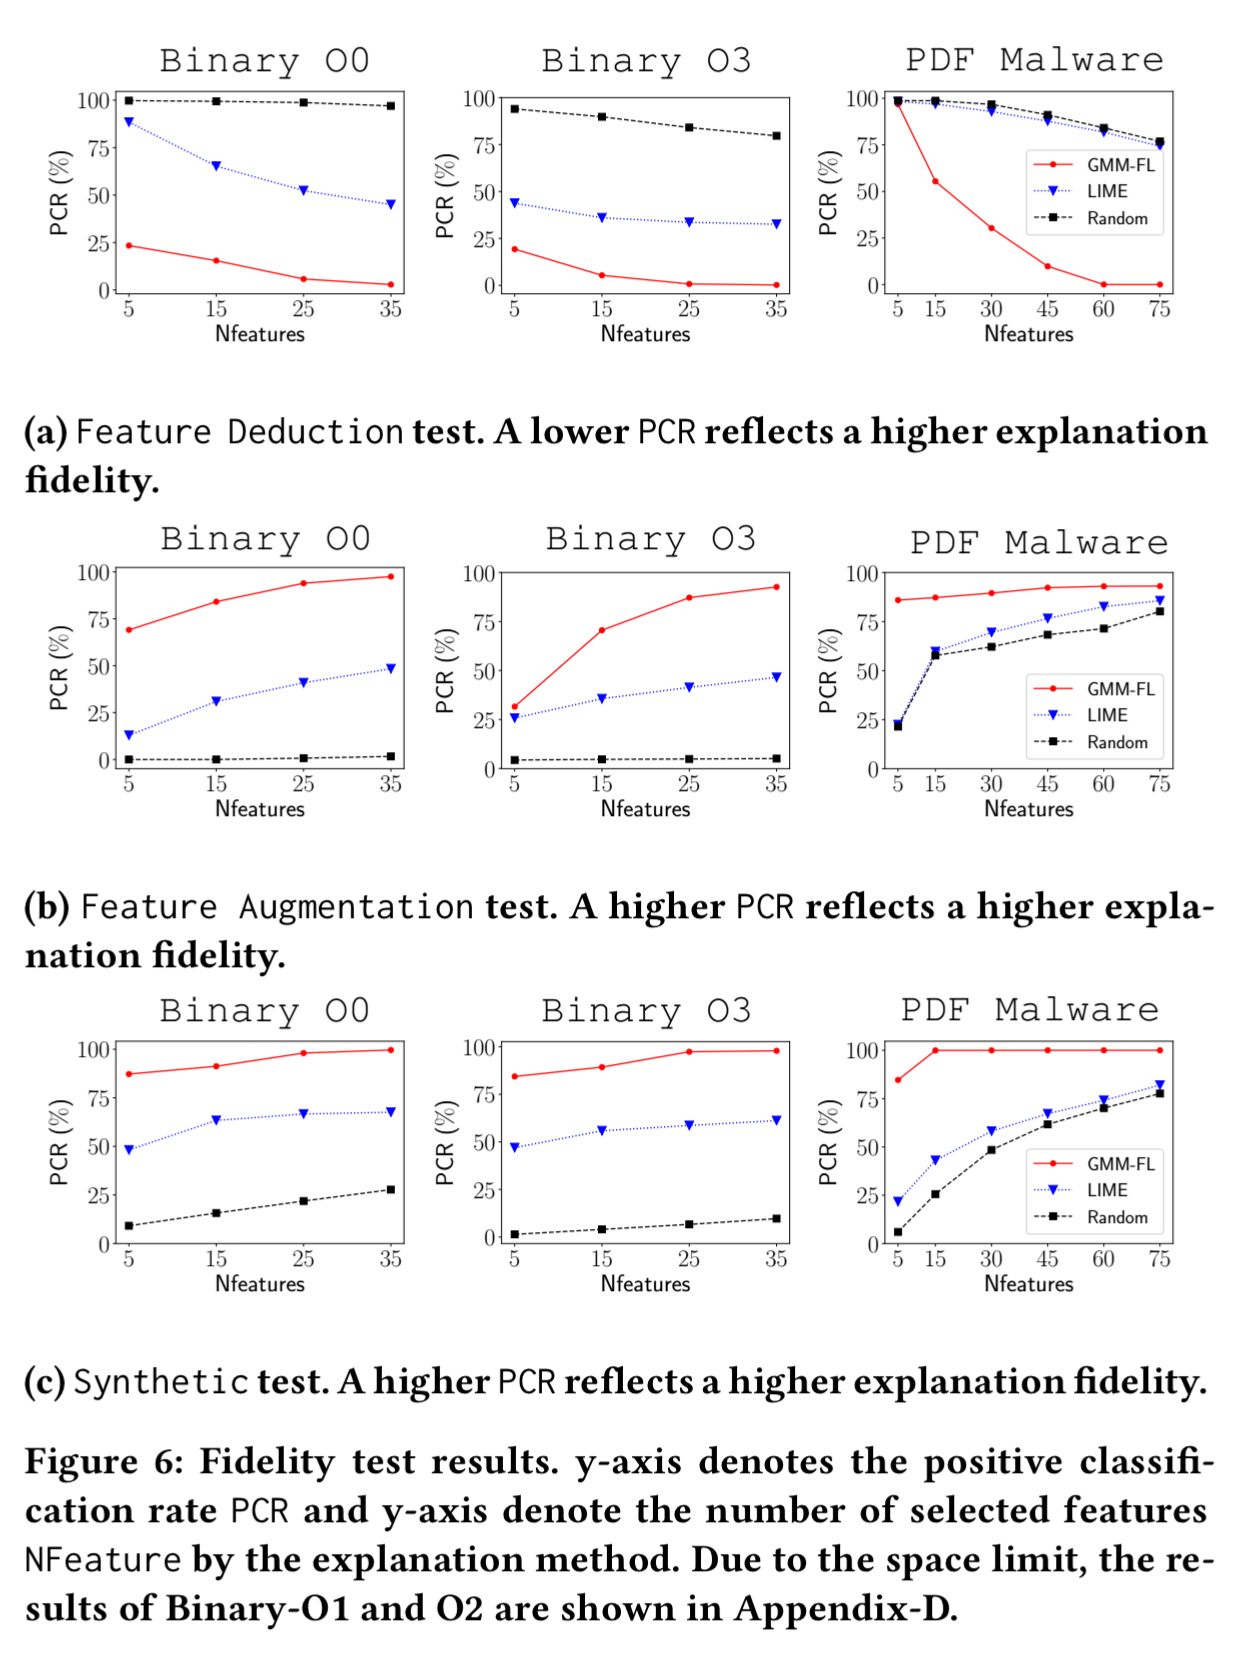
In the feature deduction test, removing the top 5 features highlighted by LEMNA drops PCR to 25% or lower, indicating the small set of highlighted features are highly important to the classification.
In the feature augmentation test, replacing the top 5 features highlighted by LEMNA caused 75% of test case for the PDF malware classifier to flip their labels. And using the synthetic inputs with the top 5 inputs, the synthetic instances have a 85%-90% chance of taking the original input’s label.
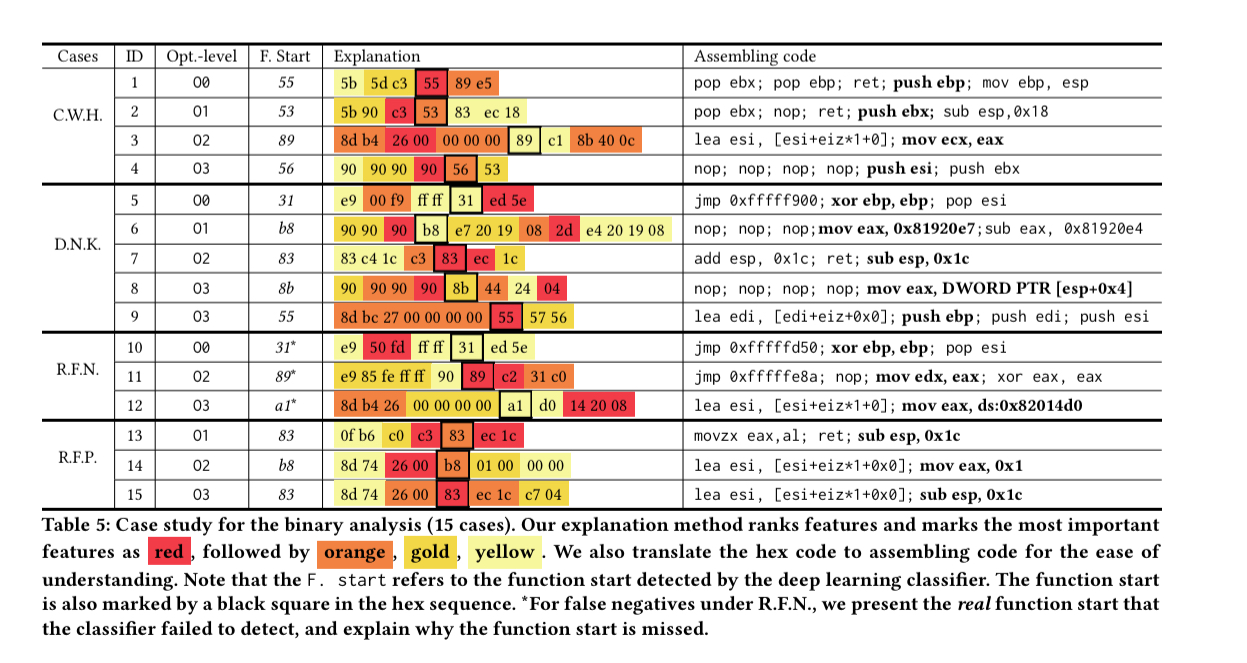
Focusing on the reverse-engineering function starts in binaries application, the explanation produced by LEMNA shows that the model does indeed capture well-known heuristics (C.W.H.), discovers new knowledge that makes sense to human experts (D.N.K.), and can provide insights into misclassification reasons for false negatives (R.F.N.) and false positives (R.F.P.).
I can only seem to find “explainability” research on classifier networks. Is there a specific reason none exists for regression or forecasting RNNs?
I’ve also asked the question on the Fast.ai forums: https://forums.fast.ai/t/explanability-of-rnns/31598?u=seanny123
Any regression task can be converted into a classification task via binning.