BLeak: Automatically debugging memory leaks in web applications Vilk & Berger, PLDI’18
BLeak is a Browser Leak debugger that finds memory leaks in web applications. You can use BLeak to test your own applications by following the instructions at http://bleak-detector.org.
Guided by BLeak, we identify and fix over 50 memory leaks in popular libraries and apps including Airbnb, AngularJS, Google Analytics, Google Maps SDK, and jQuery. BLeak’s median precision is 100%; fixing the leaks it identifies reduces heap growth by an average of 94%, saving from 0.5MB to 8MB per round trip.
Why are web application memory leaks so problematic?
Memory leaks in web applications are a pervasive problem. They lead to higher garbage collection frequency and overhead, reduced application responsiveness, and even browser tab crashes. Existing memory leak detection approaches don’t work well in the browser environment though:
- Staleness detection assumes leaked memory is rarely touched, but web apps regularly interact with leaked state (e.g. via event listeners).
- Growth-based technique assume that leaked objects are uniquely owned, or that leaked objects from strongly connected components in the heap graph. In a web application, objects frequently have multiple owners, and all roads lead back to
window. - Techniques that depend on static type information are not applicable since JavaScript is dynamically typed.
The current state of the art is manual processing of heap snapshots. As we show, this approach does not effectively identify leaking objects or provide useful diagnostic information, and it thus does little to help developers locate and fix memory leaks.
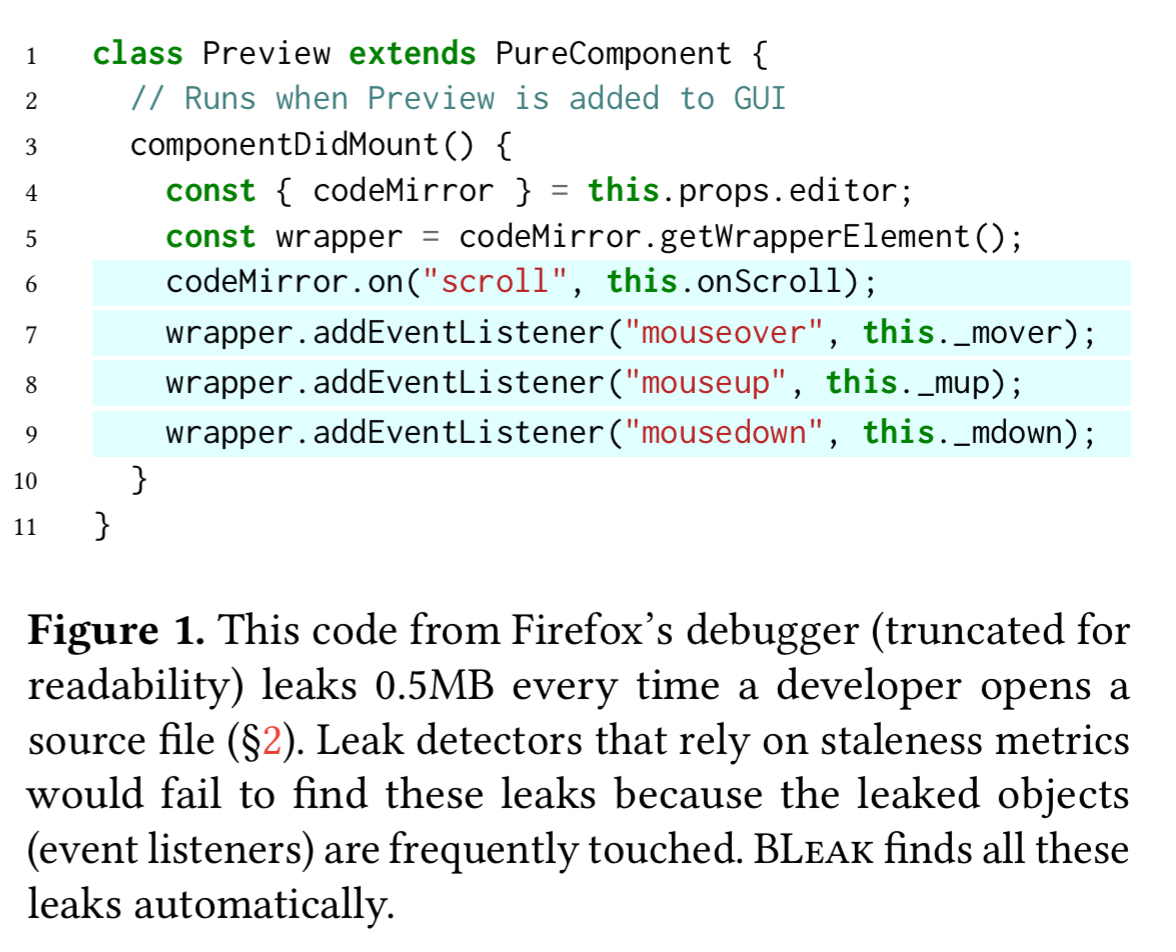
Consider the following extract from the Firefox debugger, which leaks memory every time a developer opens a source file since the event listeners are never removed. (The leak was found using BLeak of course!).
Using heap snapshots to try and detect diagnose the problem leaves developers staring at heap snapshots like this:
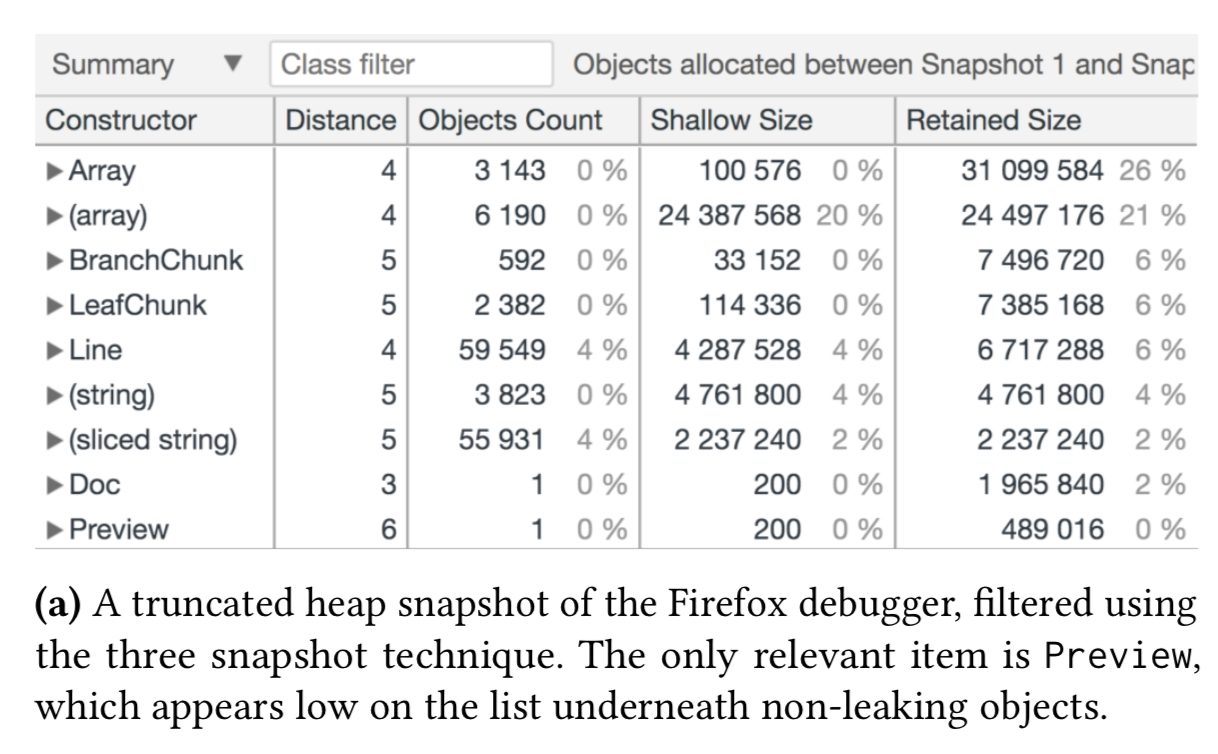
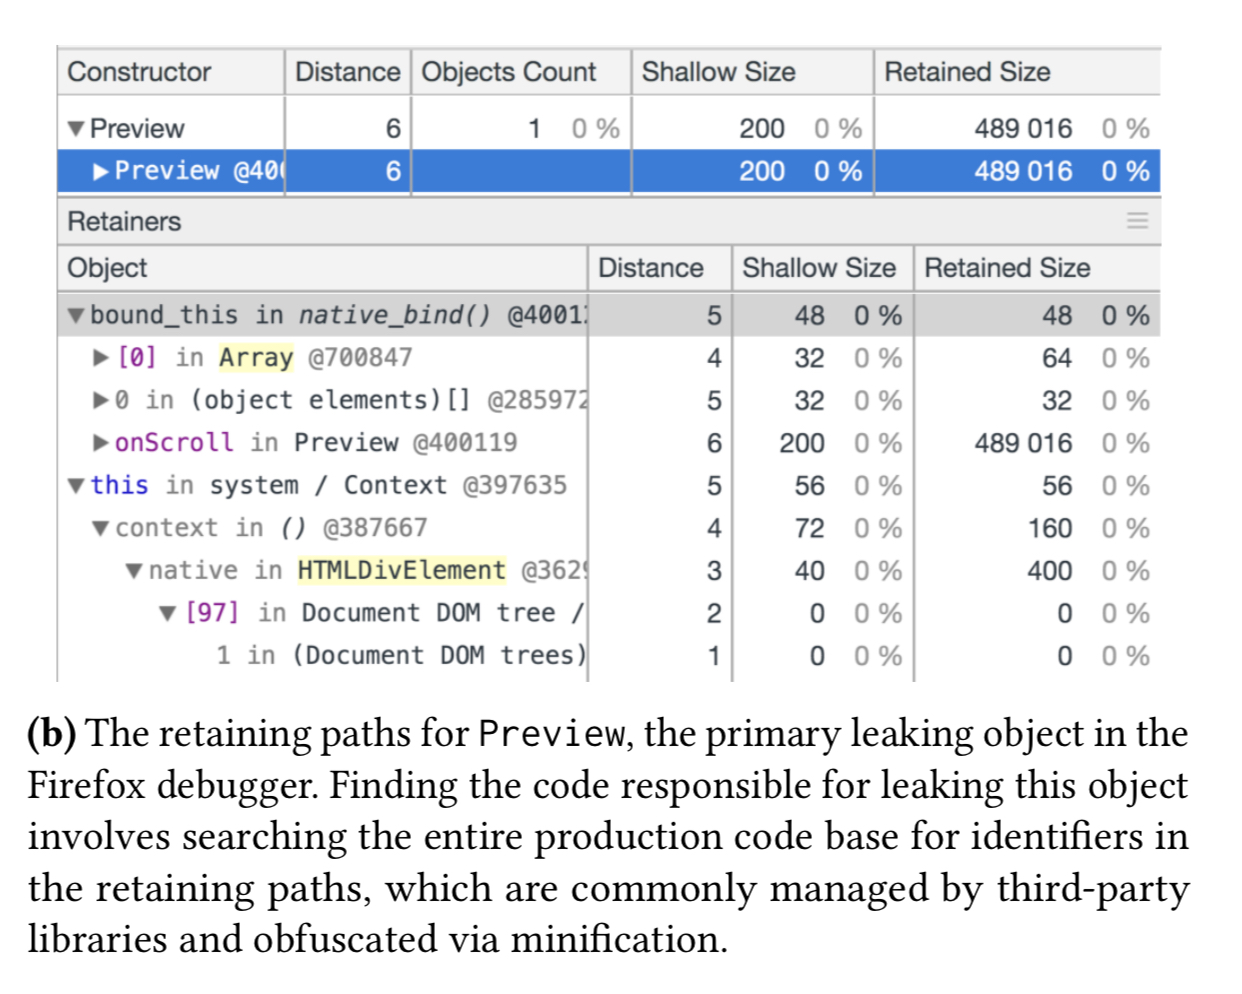
The top item in the heap snapshot, Array conflates all arrays in the application under one heading, and the (array) entry is referring to internal V8 arrays not under the application’s direct control. The primary leak is actually the of the Preview object, but it appears low on this list and has a small retained size, making it an unlikely target for investigation using this view. And even if a developer does decide to look into the Preview entry, finding the responsible code based on the retaining path information in the snapshot is not easy:
An overview of BLeak
Instead of poring over heap snapshots, for the same memory leak as above BLeak will produce diagnostic output that looks like this:
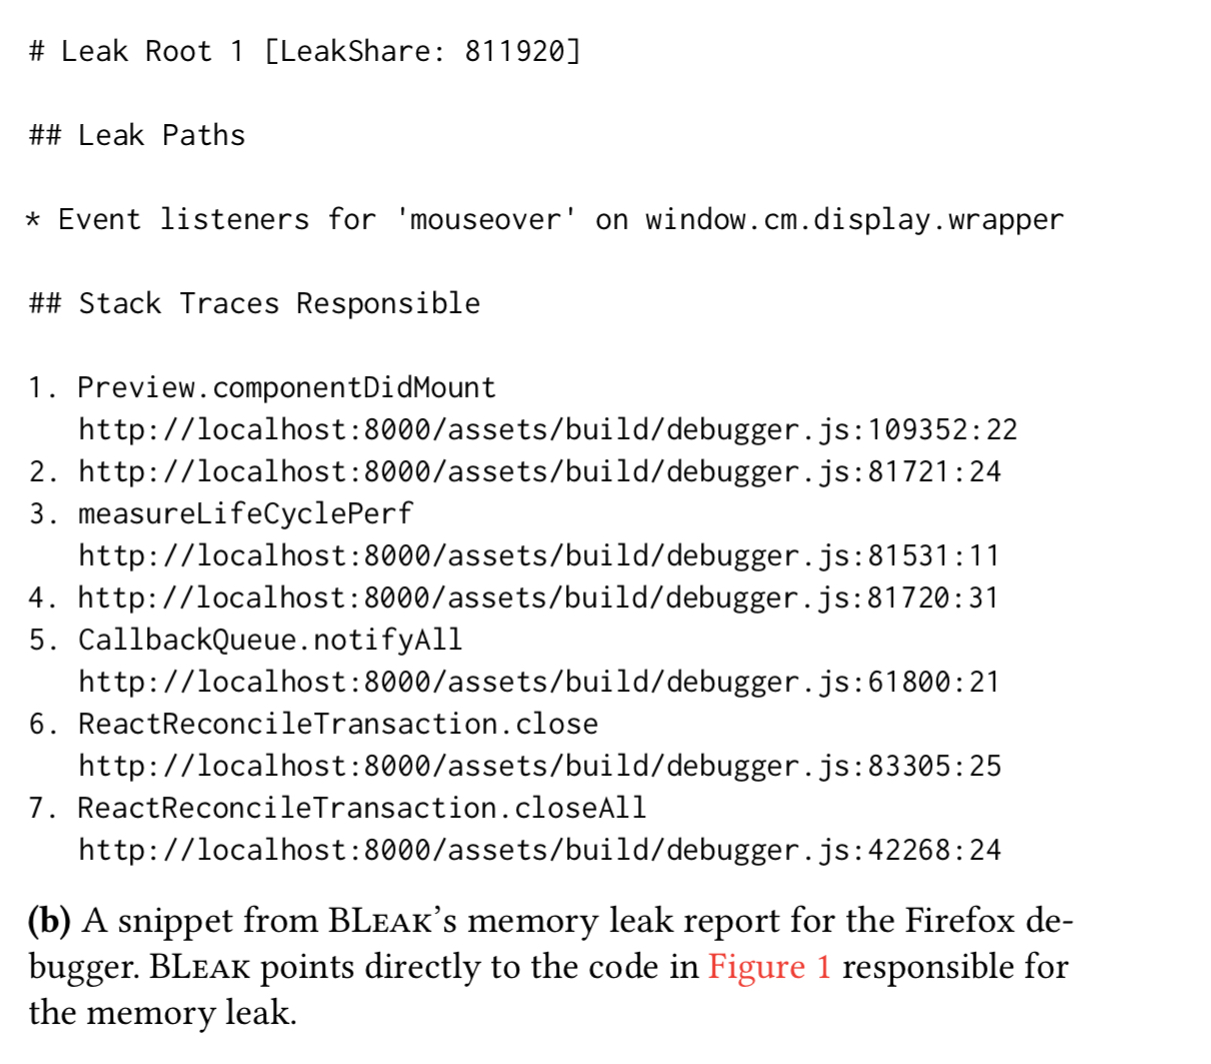
The developer is pointed directly to the problematic source code.
BLeak automatically detects, ranks, and diagnoses memory leaks. The central observation is that in modern web apps users frequently return to the same visual state. For example, the news feed in Facebook, the property listing page in Airbnb, and the inbox view in Gmail.
… these round trips can be viewed as an oracle to identify leaks. Because visits to the same (approximate) visual stat should consume roughly the same amount of memory, sustained memory growth between visits is a strong indicator of a memory leak.
To use BLeak, you need to provide a short driver loop that cycles the application through the desired visual states. The loop is specified as an array of objects, each providing a check function to validate state preconditions, and a next function to transition to the next state. The final transition must take you back to the initial state, so that the cycle can repeat.
An example makes this much easier to understand. In the Firefox debugger case, the debugger opens to a view with a list of all documents in the application being debugged. Clicking on the first document in the list (main.js) opens it in the text editor. Closing the editor takes us back to the list view again. Here’s the loop specification:
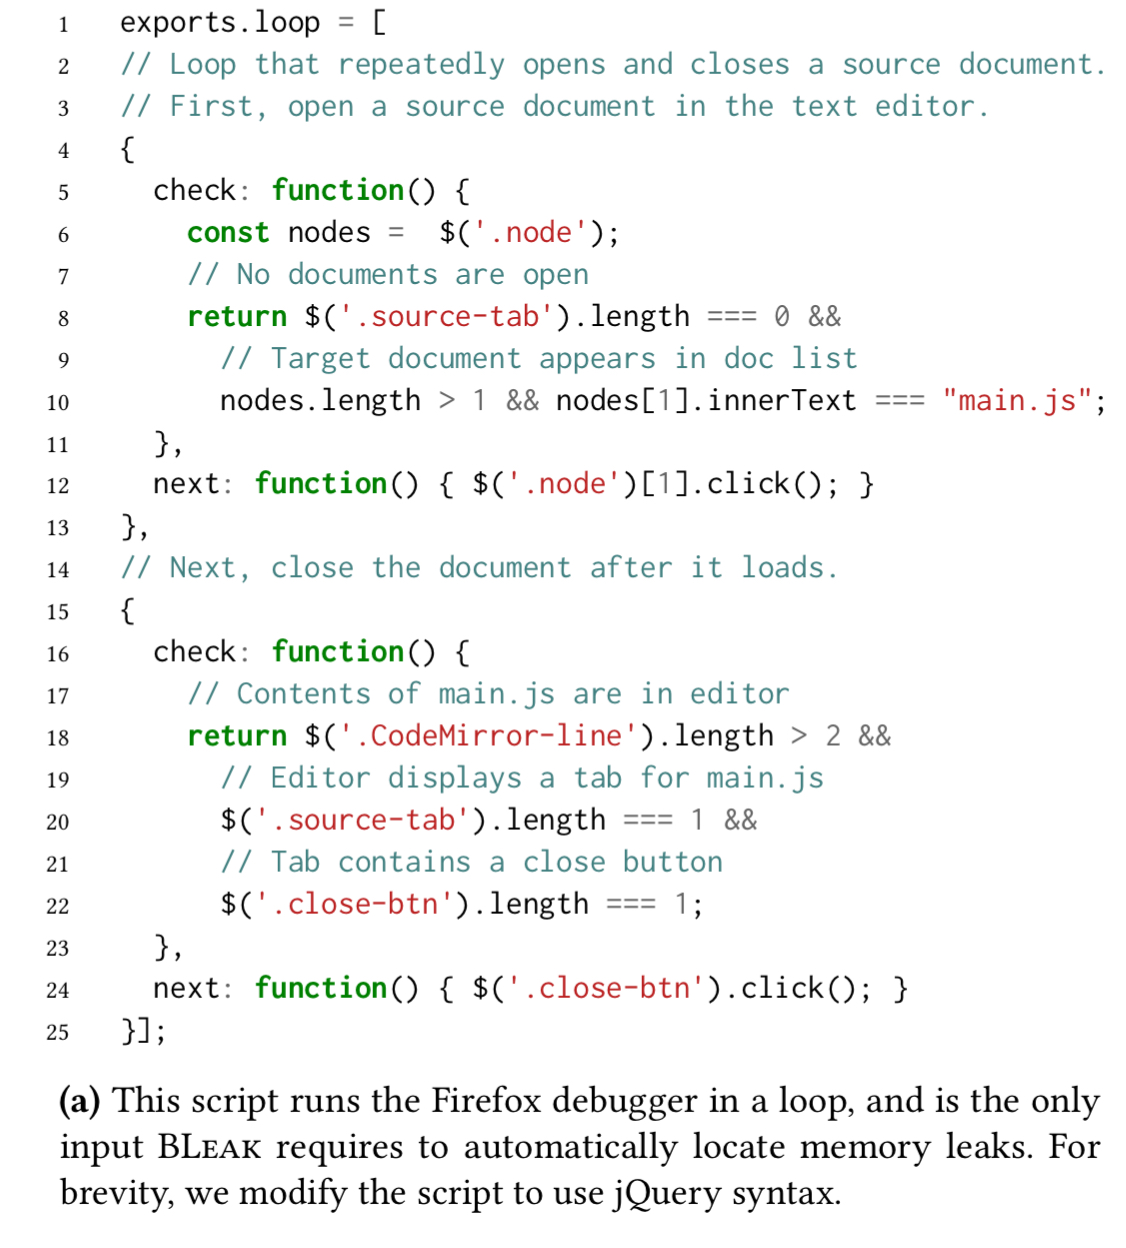
Appendix B contains the driver loops used for a variety of applications including Airbnb. You can see that the loops are fairly easy to write.
BLeak uses the provided loop script to drive the application in a loop (eight iterations by default).
After each visit to the first visual state in the loop, BLeak takes a heap snapshot and tracks specific paths from GC roots that are continually growing. BLeak treats a path as growing if the object identified by that path gains more outgoing references (e.g., when an array expands or when properties are added to an object).
In the Firefox debugger example, BLeak finds four leak roots: an array within the codeMirror object that contains scroll event listeners, and event listener lists for mouseover, mouseup, and mousedown events on the DOM element containing the text editor.
The detected leak roots are then ranked to help developers prioritise their attention. Ranking is done via a leak share metric which first prunes objects in the graph reachable by non-leak roots, and then splits the credit for the remaining objects equally among the leak roots that retain them.
The final piece of the puzzle is pinpointing the sources of the detected leaks in order to produce the report we saw earlier.
BLeak … reloads the application and uses its proxy to transparently rewrite all of the JavaScript on the page, exposing otherwise-hidden edges in the heap as object properties. BLeak uses JavaScript reflection to instrument identified leak roots to capture stack traces when they grow and when they are overwritten (not just where they were allocated). With this instrumentation in place, BLeak uses the developer-provided script to run one final iteration of the loop to collect stack tracks. These stack traces directly zero in on the code responsible for leak growth.
BLeak in action
BLeak is evaluated using a corpus of give popular web application that in turn use a variety of libraries (React, AngularJS, Google Analytics, etc.):
- Airbnb (looping between the page listing all services on Airbnb, and the page listing only homes and rooms for rent)
- Piwik 3.0.2 – an open source analytics platform. BLeak repeatedly visits the main dashboard page.
- Loomio 1.8.66 – a collaborative platform for group decision making. BLeak transitions between a group page listing all threads in a group, and the first thread listed on the page.
- Mailpile v1.0.0 – an open source mail client. BLeak cycles between the inbox and the first four emails in the inbox.
- Firefox debugger – while debugging Mozilla’s SensorWeb. The BLeak loop repeatedly opens and closes
main.jsin the debugger’s text editor.
Driver loops for all of these programs can be found in Appendix B, and the full list of detected leaks in these applications can be found in Appendix A.
Overall, BLeak finds 59 distinct memory leaks across the five applications, all of which were unknown to application developers. 27 of the discovered leaks were actually in libraries used by the web applications (6 of the 27 had been independently diagnosed by the library developers and had pending fixes). That leaves 32 memory leaks detected directly in the application code.
We reported all 32 new memory leaks to the relevant developers along with our fixes; 16 are now fixed, and 4 have fixes in code review. We find new leaks in popular applications and libraries including Airbnb, AngularJS, Google Maps SDK, Google Tag Manager, and Google Analytics.
The key results are summarised in the table below.
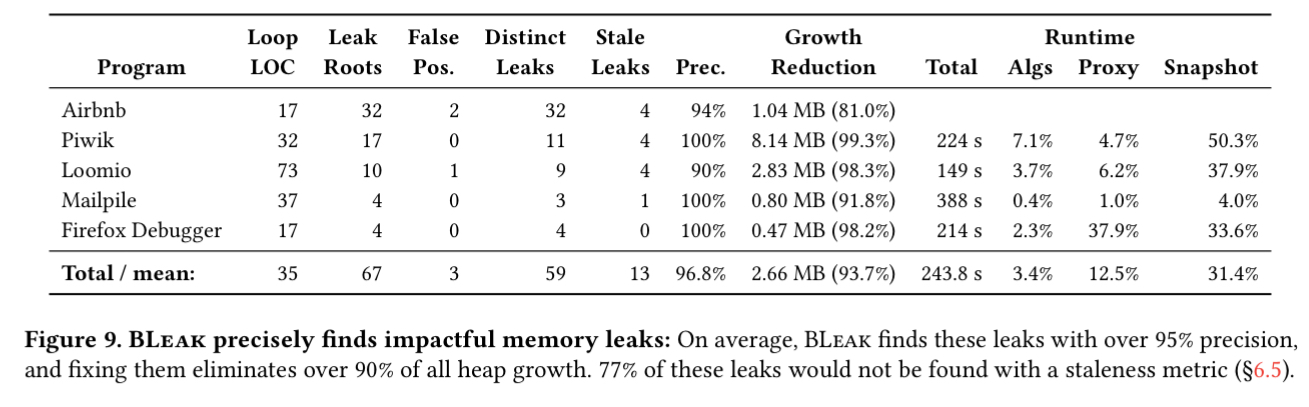
- BLeak has an average precision of 96.8%, and a median precision of 100%. Overall there were only three false positives, all caused by an object that continuously grows until some threshold or timeout is reached – increasing the number of round trips would have removed these .
- BLeak accurately pinpoints the code responsible for the leaks in all but one case (in which it fails to record a stack trace).
- Guide by the BLeak reports, the authors were able to fix every memory leak. It took about 15 minutes per leak to implement a fix.
- BLeak locates, ranks, and diagnoses memory leaks in less than seven minutes on these applications. Most of the time goes on receiving and parsing Chrome’s JSON-based heap snapshots.
- On average, fixing the memory leaks that BLeak reports eliminates over 93%h of all heap growth.
- Of the memory leaks BLeak finds, at least 77% would not be found with a staleness-based approach.
We show that BLeak has high precision and finds numerous previously-unknown memory leaks in web applications and libraries. BLeak is open source and is available for download at http://bleak-detector.org.

Great article, thanks!
You mention ‘Appendix B’ for examples of driver scripts, but I can’t see any link and would be very interested to see.
Hi Pete, that’s Appendix B in the original paper – you’ll find a link at the very top of the post.
I installed Bleak but can not access it via cmd.
How can access it?