Watching for software inefficiencies with Witch Wen et al., ASPLOS’18
(The link above is to the ACM Digital Library, if you don’t have membership you should still be able to access the paper pdf by following the link from The Morning Paper blog post directly.)
Inefficiencies abound in complex, layered software.
These inefficiencies can arise during design (poor choice of algorithm), implementation, or translation (e.g., compiler optimisations or lack thereof). At the level of the hardware, inefficiencies involving the memory subsystem are some of the most costly…
Repeated initialization, register spill and restore on hot paths, lack of inlining hot functions, missed optimization opportunities due to aliasing, computing and storing already computed or sparingly changing values, and contention and false sharing (in multi-threaded codes), are some of the common prodigal uses of the memory subsystem.
Coarse grained profilers (e.g., gprof) have comparatively little overhead and can detect hotspots, but fail to distinguish between efficient and inefficient resource usage. Fine-grained profilers (e.g. DeadSpy) can detect inefficiencies, but typically introduce high overheads (10-80x slowdown and 6-100x extra memory). These high overheads prevent such tools from being widely used. Witch is a fine-grained inefficiency detection framework with low overhead, a trick it pulls off by sampling hardware PMUs (performance monitoring units) to gather its data.
Our key observation is that an important class of inefficiency detection schemes, explored previously via fine-grained profilers, requires monitoring consecutive accesses to the same memory location. For example, detecting repeated initialization— a dead write— requires monitoring store after store without an intervening load to the same location.
Witch is implemented as part of the open source HPCToolkit performance analysis tools suite. It comprises the base framework, on top of which various detection tools can be implemented. Three such tools are described in the paper:
- DeadCraft detects dead stores, a store followed by another store to the same address with on intervening load
- SilentCraft detects stores that update a location with a value already present at the location (i.e., useless stores).
- LoadCraft detects loads followed by another load from the same location where the value remains unchanged between the two loads.
Not every instance of these situations is a problem of course, but they can be very useful in pointing developers in the right direction. Let’s look at an example applying SilentCraft to the Caffe deep learning framework.
SilentCraft reports that 25% of all memory stores in a key loop of the pooling and normalisation layers are redundant.
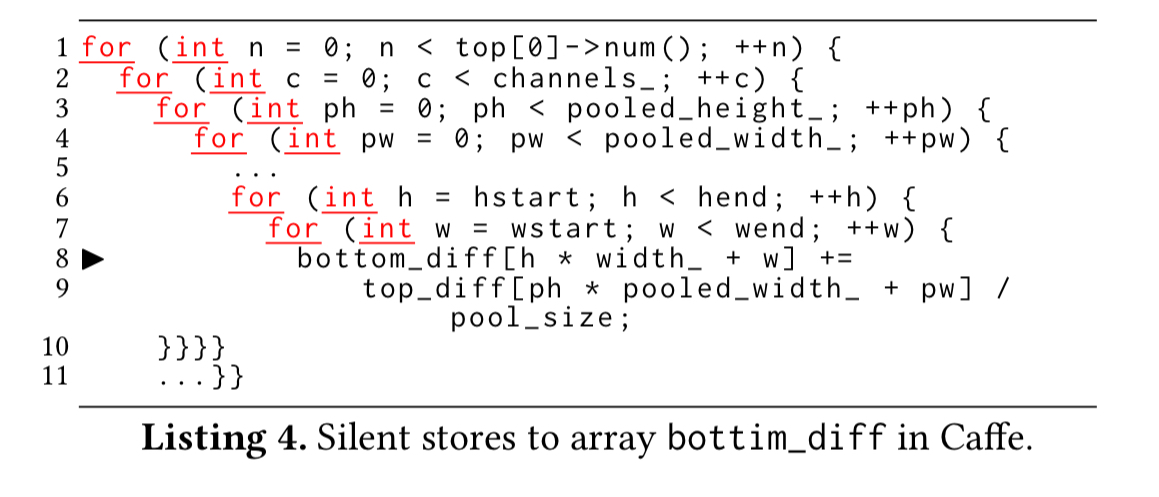
This is a clue to look at the code and see what is going on. Investigation reveals that a large portion of elements in top_diff are zeroes, effectively leading to execution of bottom_diff[index] += 0 in line 8. Adding a zero check for the value in top_diff can eliminate a division, an addition, and a memory store. This change speeds up the pooling layer by 1.16x, and the normalization layers by 1.34x. Using a near-zero check (less than 1e-7) gives a 2% accuracy loss, but yields 1.16x and 2.23x speedups for pooling and normalization respectively. (A 6% speedup over the program as a whole).
The NWChem computational chemistry package provides an illustration of the benefits of detecting dead stores with DeadCraft. DeadCraft reveals that 60% of memory stores are dead, with 94% of those dead stores due to one store pair in the call of the dfill function.
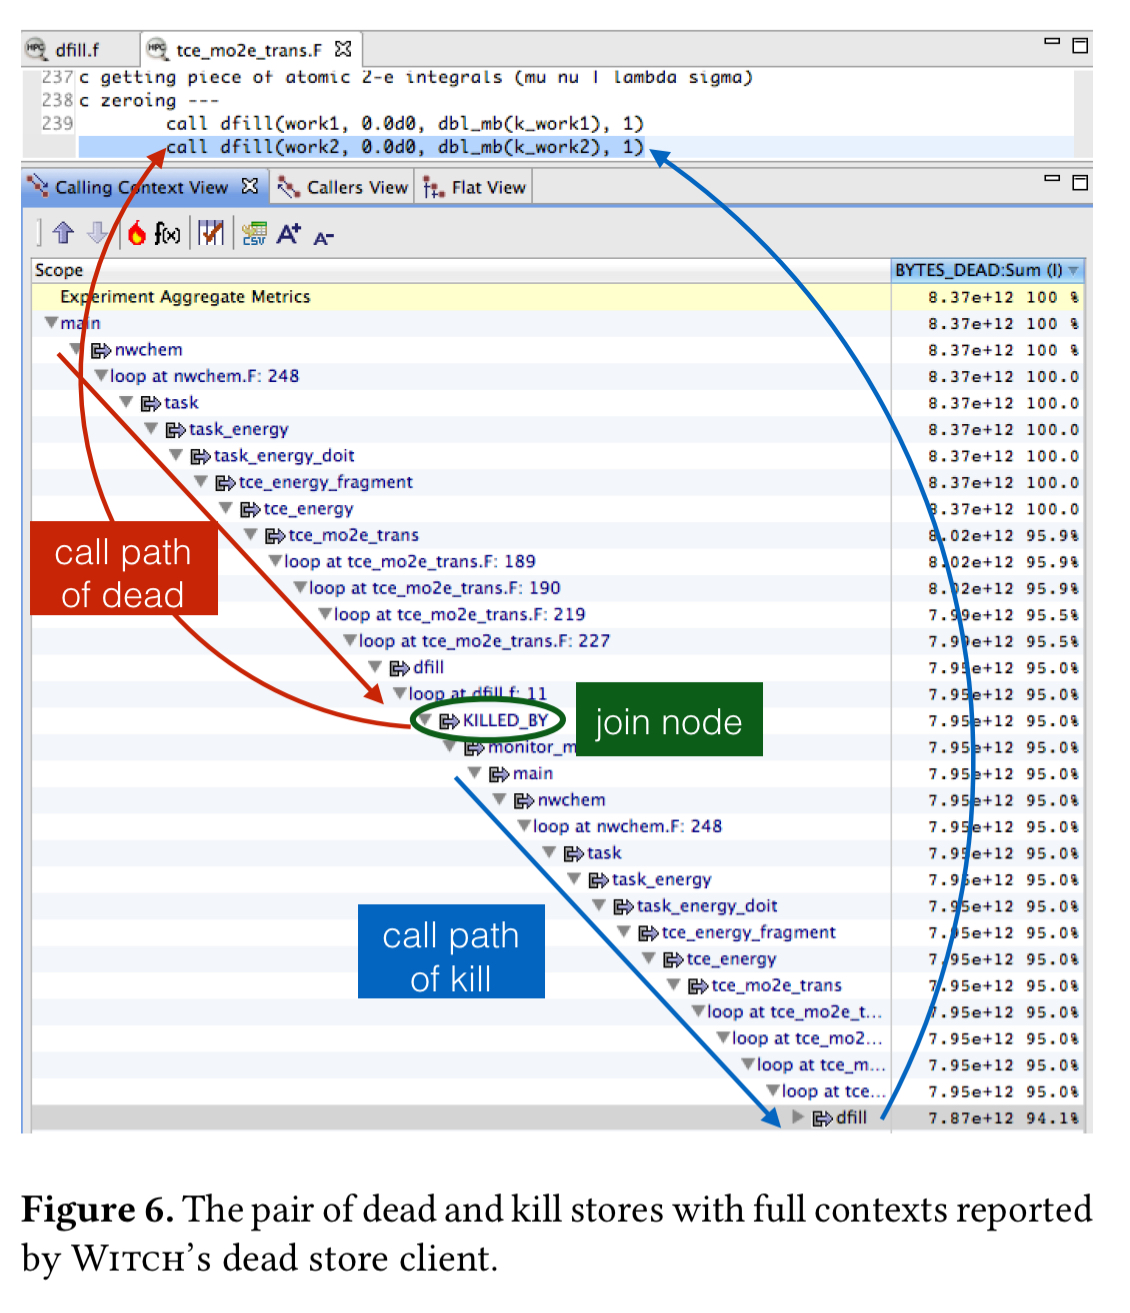
More than 200K calls to dfill are made, writing 500GB of data that is never used. Analysis revealed that the size of the work2 array was larger than necessary, and that the zero initialisation (the cause of all those stores) was also unnecessary. Eliminating it lead to a 1.43x speedup.
For a LoadCraft example we can turn to GNU Binutils-2.27. LoadCraft identifies 96% of the loads in this program as loading the same value from the same location. The culprit is a linear scan over addresses in a function table. Replacing the linked list with a sorted array and using a binary search instead sped up execution by 10x.
We’ve seen how Witch can help programmers focus their attention on interesting parts of the codebase. Now let’s take a look at how it works under the covers…
PMU Sampling
Hardware performance monitoring units in CPUs offer a programmable way to count hardware events such as loads and stores, and hardware debug registers can trap execution when the PC reaches an address, or an instruction accesses a designated address (a watchpoint). Linux offers a standard interface to program and sample PMUs.
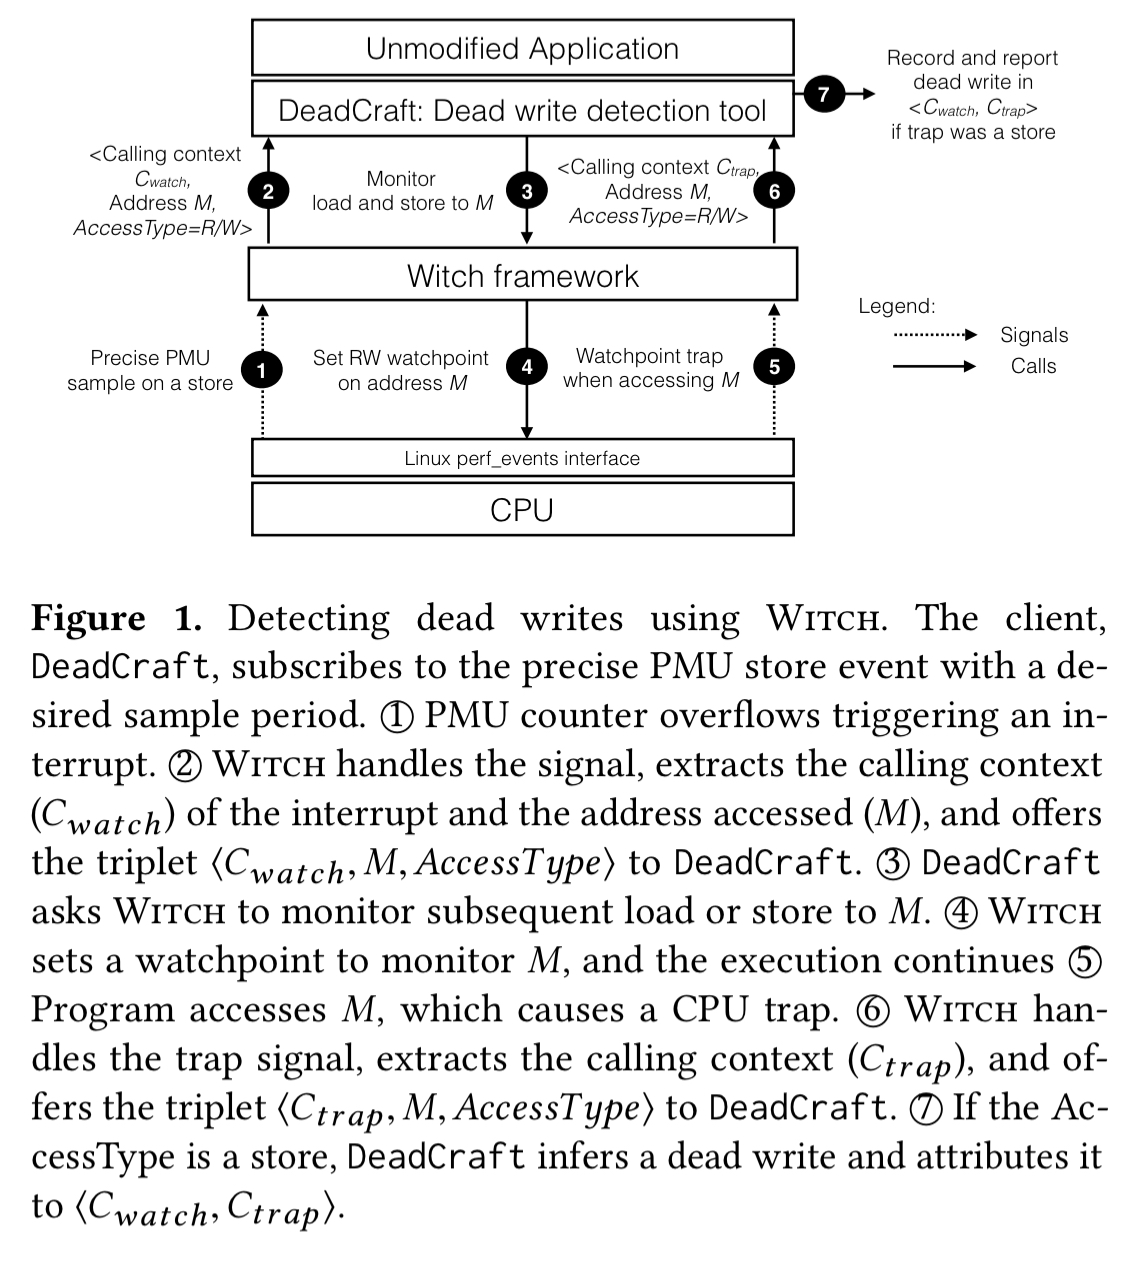
PMU samples that include the effective address accessed in a sample provide the knowledge of the addresses accessed in an execution. Given this effective address, a hardware debug register allows us to keep an eye on (watch) a location and recognize what the program subsequently does to such a location.
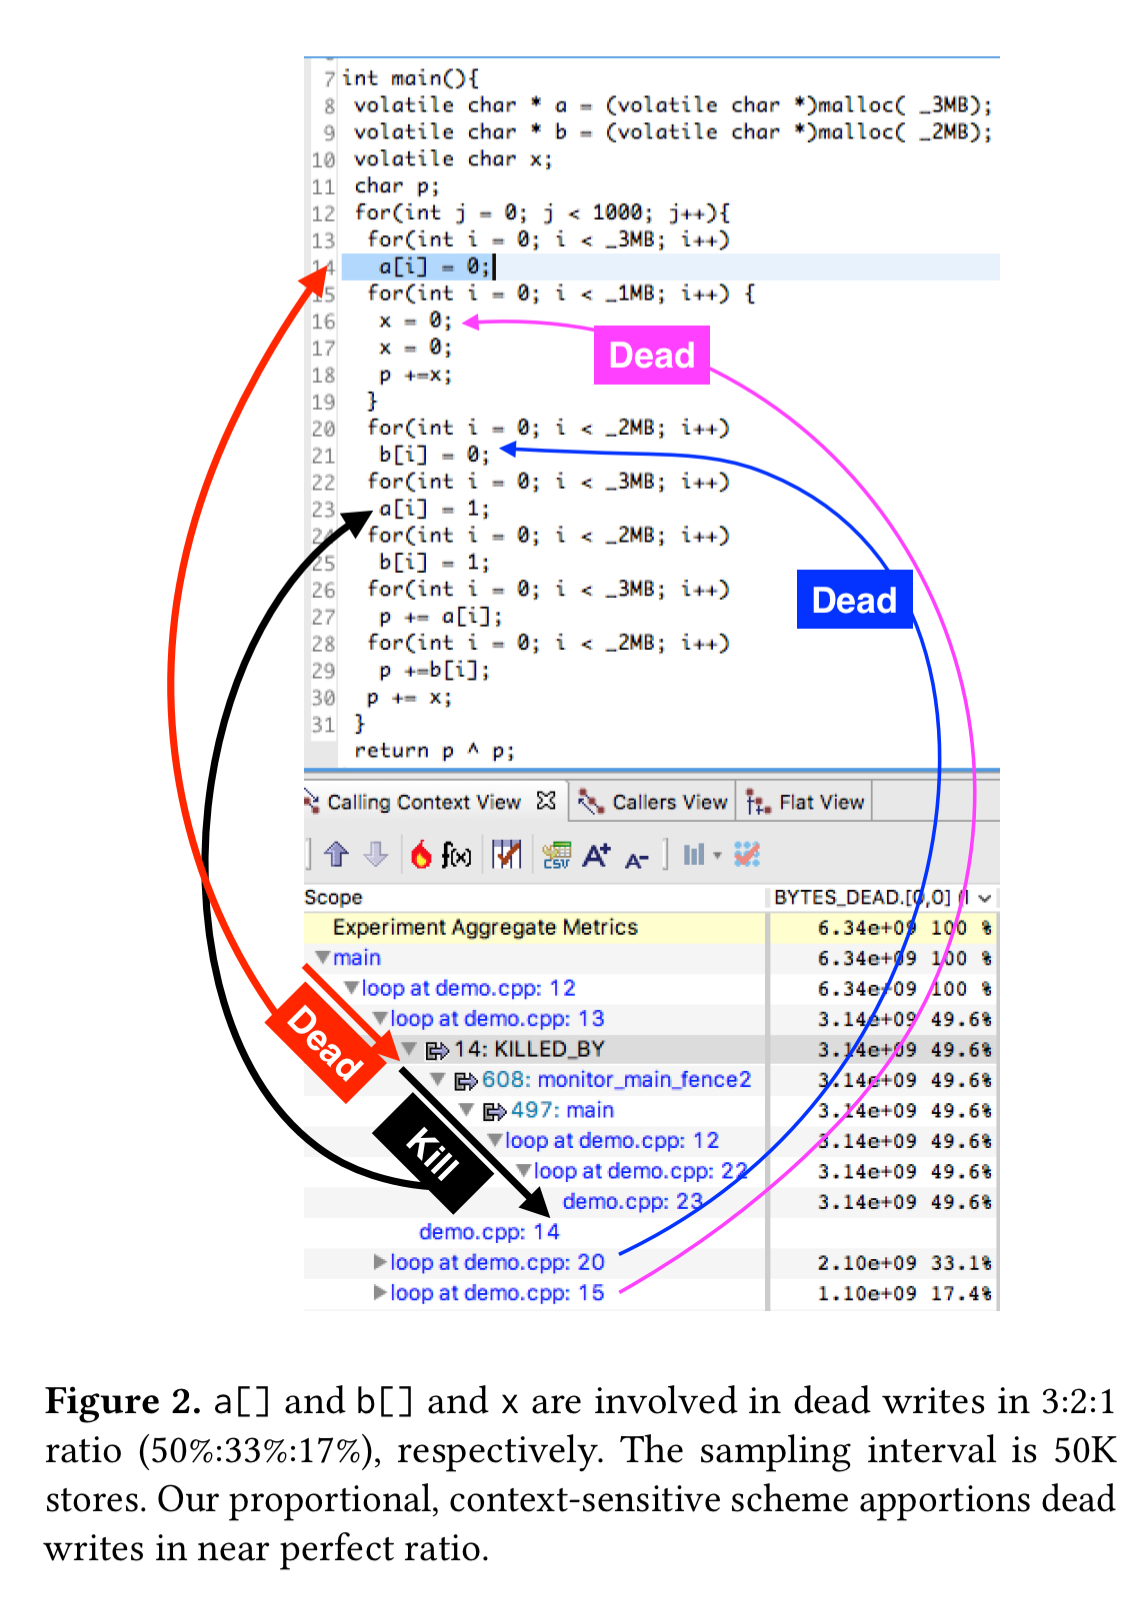
The following figure shows how all the pieces fit together in the context of dead store detection (the DeadCraft client):
Intervening accesses
We can only monitor a small number of locations at a time (e.g., four hardware debug registers), so reservoir sampling allows us to monitor a subset of previously seen addresses without any bias. Two accesses to the same memory address, separated by many PMU samples in the intervening time, present an issue. Once all the watchpoints are in use, a simple ‘replace the oldest watchpoint’ scheme will most likely not detect e.g. dead stores, separated by such a distance.
Monitoring a new sample may help detect a new, previously unseen problem whereas continuing to monitor an old, already-armed address may help detect a problem separated by many intervening operations. We should detect both.
The solution uses reservoir sampling and relies on multiple unbiased samples taken over a repetitive execution to capture both scenarios. Since only counts of previous samples are maintained the technique needs only O(1) memory. In practice, the “blindspot window” (number of consecutive unmonitored PMU samples) for many applications is very short – e.g., less than 0.02% of the total samples in the SPEC CPU2006 benchmarks.
Proportional attribution
Consider the following code fragment:
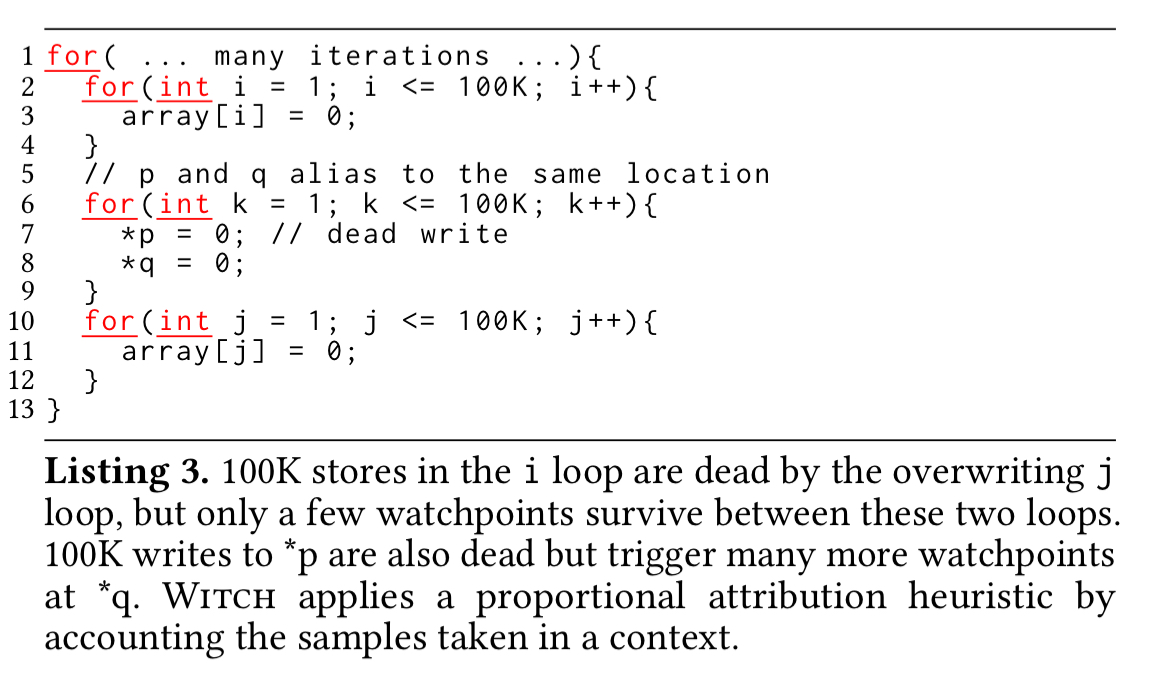
There are many dead stores in the i-loop (line 3) due to the overwriting j-loop (line 11). However, only a few watchpoints survive between these two loops because of all the watchpoints consumed in the middle loop (lines 7-8). Without correcting for this sampling imbalance, a disproportionately high dead write count will be recorded for the line pairs (7,8) and (8,7) compared to the rest.
We solve this problem with a context-sensitive approximation. The code behaviour is typically the same in a calling context; hence, an observation made by monitoring an address accessed in a calling context can approximately represent other unmonitored samples occurring in the same calling context. If in a sequence of N samples occurring in a calling context C, only one sample is monitored through a debug register, we scale the observation made for the monitored sample by N to approximated the behaviour of the remaining N-1 unmonitored samples taken at C.
Accuracy and overheads
The following charts show the accuracy of DeadCraft, SilentCraft, and LoadCraft at different sampling rates, as compared to ground truth exhaustive monitoring.
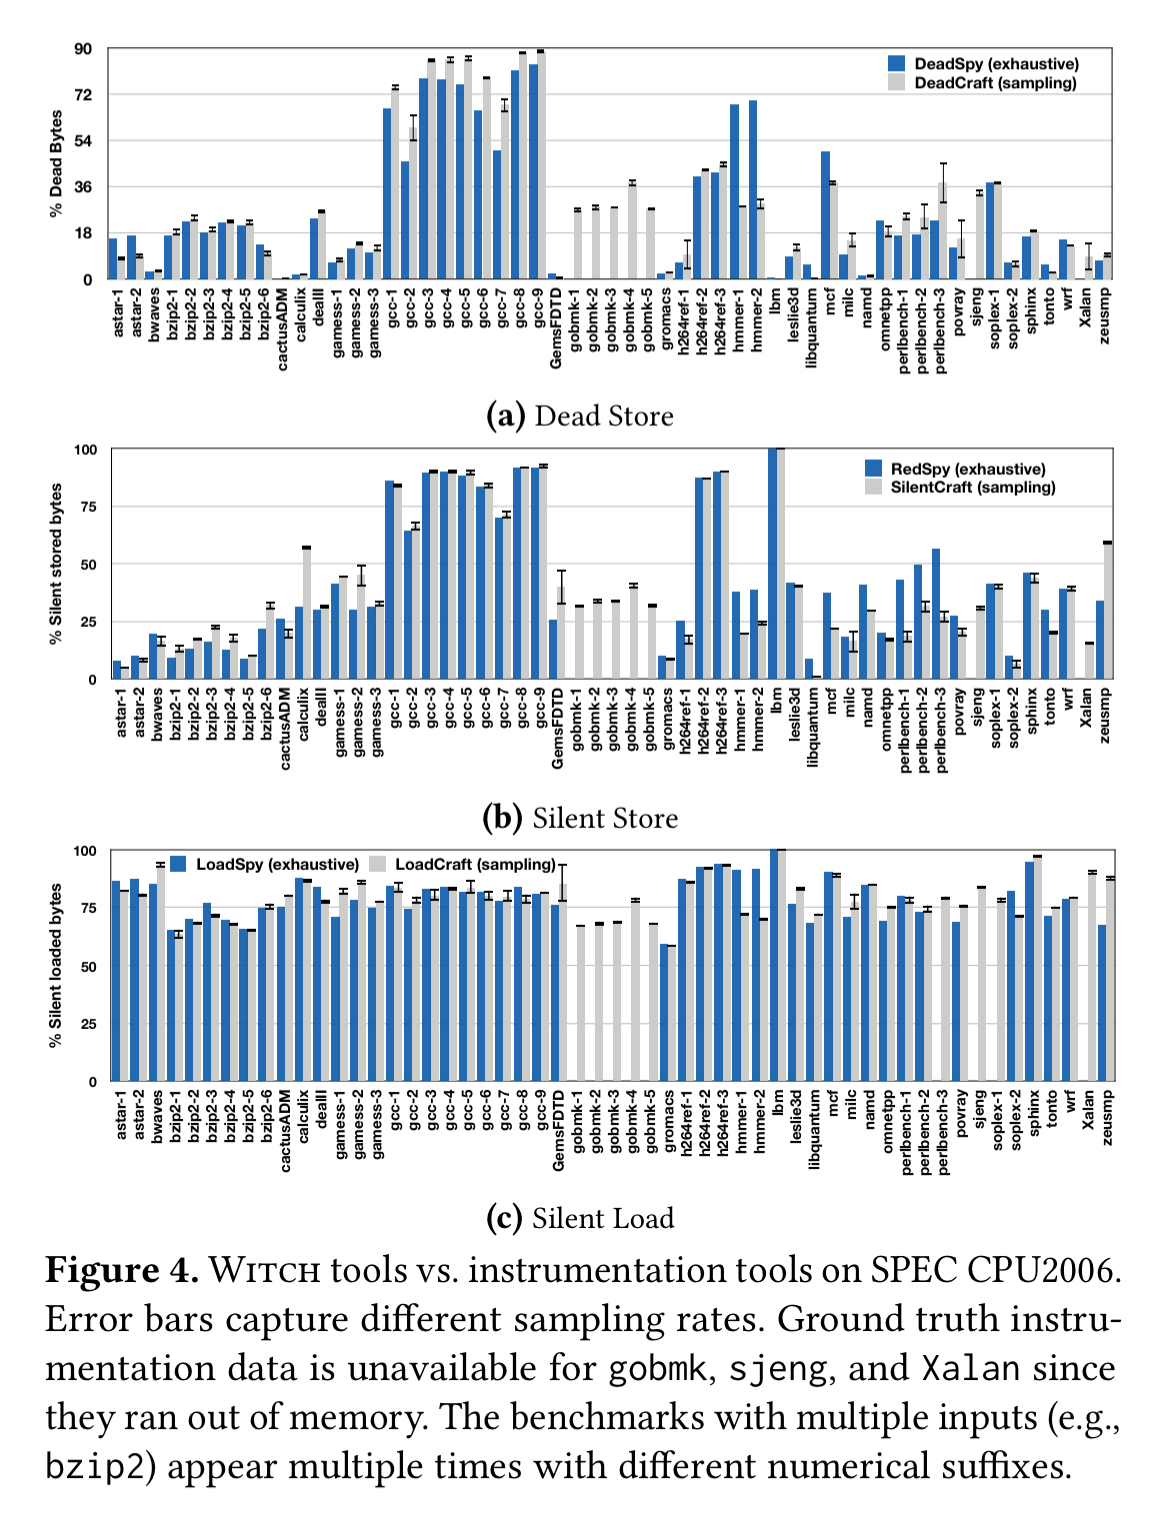
Clearly, the sampling rate, when chosen with some care, does not significantly affect the results.
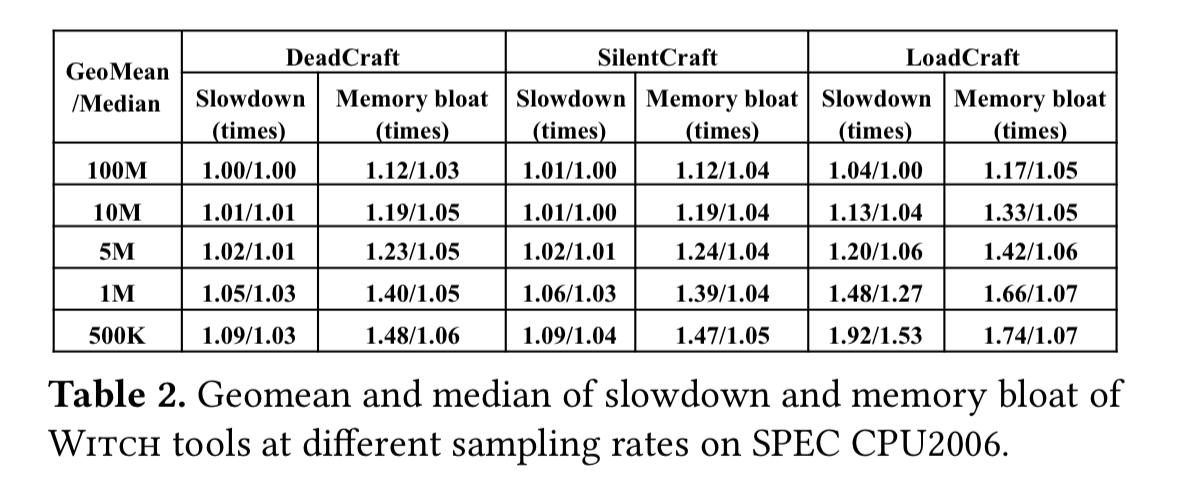
Unsurprisingly, sampling also has much lower overheads than exhaustive monitoring, as shown in this table.
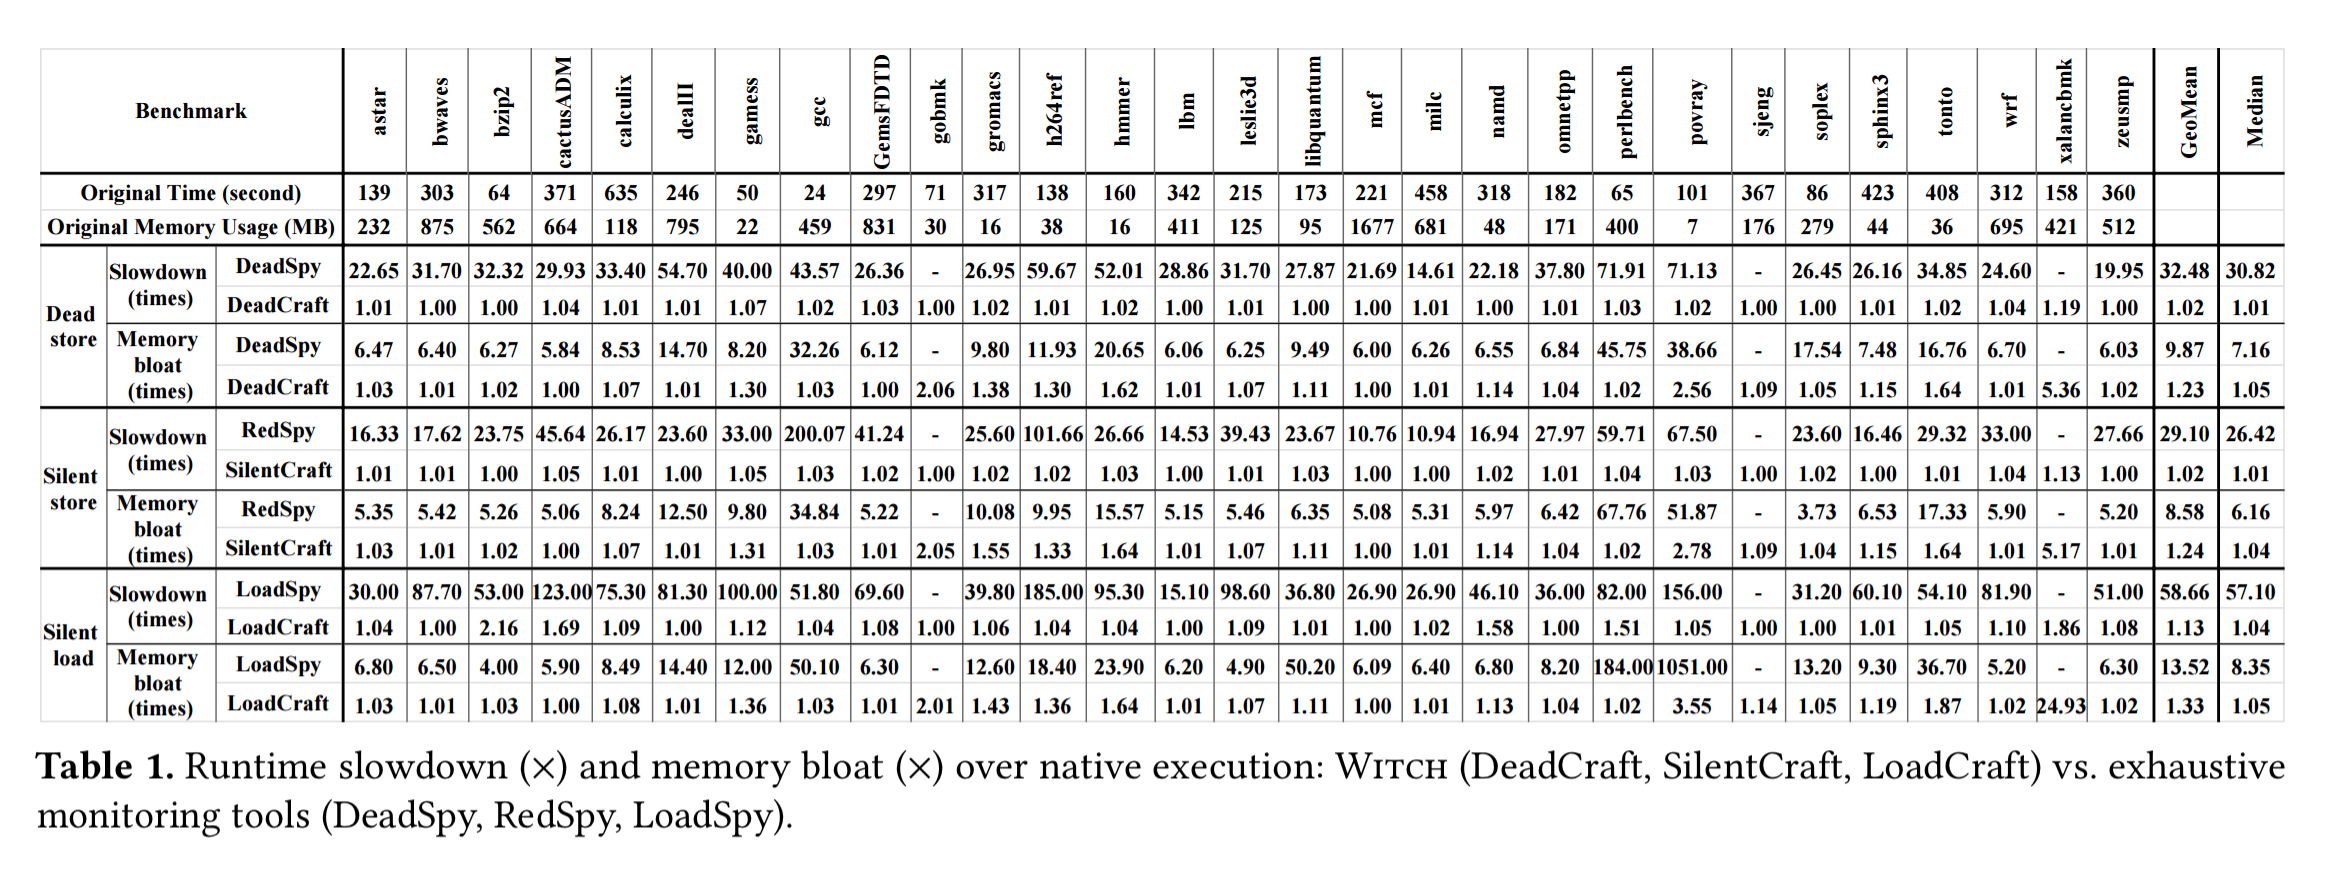
(Enlarge)
Perhaps more interesting is the overhead compared to normal (i.e., non-instrumented) execution, which is typically less than 5%:

> article made available by the morning paper
Thanks!
I used to do this kind of optimization analysis for a living. There are sometimes big savings to be found, but the ‘right’ kind of source is needed (e.g., lots of nested loops), along with some skill at interpreting tool output and knowing where to look. This kind of tool rarely gets used in practice because the skills required to use them on real code bases takes lots of practice; sorry Shasha Wren (and unless you make pdfs available on your website, nobody in industry will read about your work).
“DeadCraft detects dead stores, a store followed by another store to the same address with on intervening load” – I think you mean NO intervening load.
Great article thanks!
Typo:
>> DeadCraft detects dead stores, a store followed by another store to the same address with *on* intervening load
>> DeadCraft detects dead stores, a store followed by another store to the same address with *no* intervening load
PS: you can develop my comment.