Decentralization in Bitcoin and Ethereum networks Gencer et al., FC’18
I thought it would be fitting to round off this week’s selections by looking at the state of Bitcoin and Ethereum in practice. Today’s paper presents the results of a series of measurements of the respective networks, taken through 2016 and 2017.
Ongoing research explores ways to make the Bitcoin and Ethereum networks more decentralized without measurements on the underlying network. Hence, debates and decisions about the underlying networks are often based on assumptions rather than measurement. In this paper, we present a comprehensive measurement study on decentralization metrics in these operational systems and shed light on whether or not existing assumptions are satisfied in practice.
There’s plenty of information on the data collection methodology and threats to validity in the paper. But since I’ve been bombarding you with information all week, for today I’m just going to focus on the results. The section I personally found most interesting was the one on the distribution of mining power in practice. So let’s start there…
Distribution of mining power
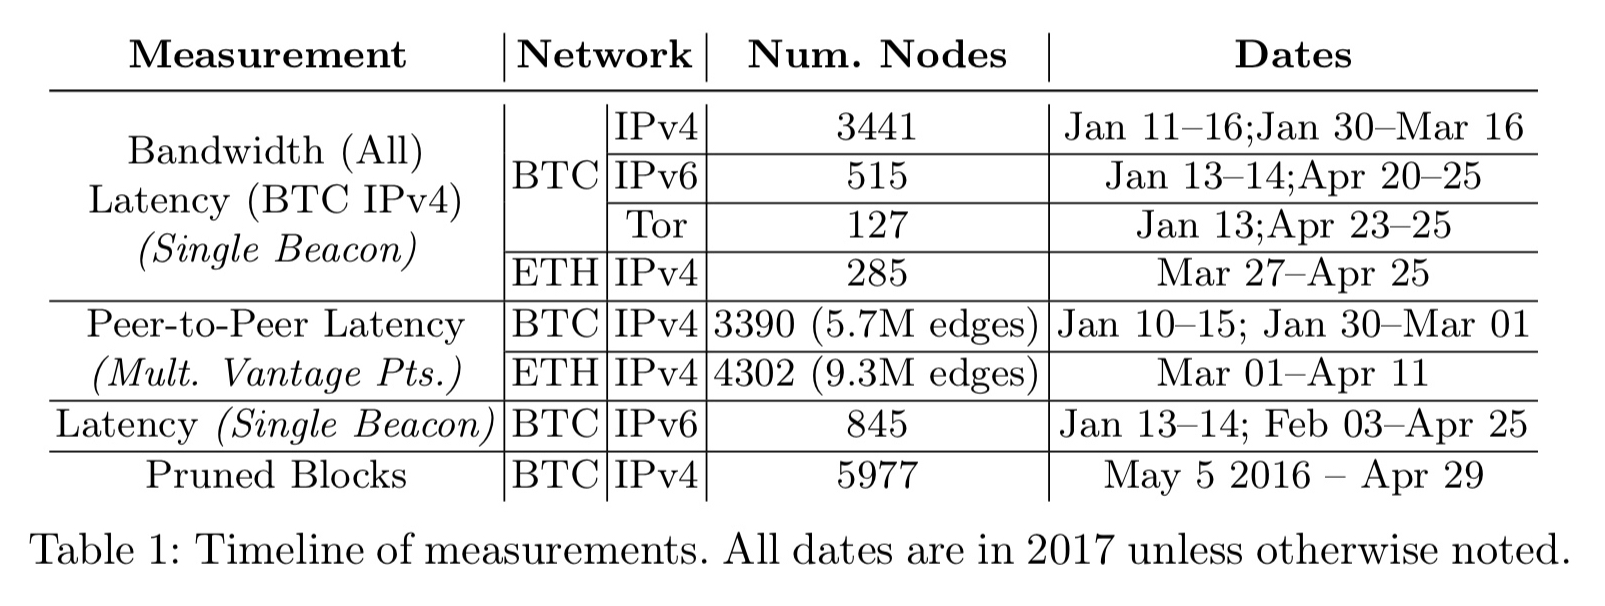
In both Bitcoin and Ethereum, miners voluntarily disclose their identity as part of each block they mine. Collected identities were manually processed to detect and merge duplicates. Data was gathered over a period of 10 months starting from July 15, 2016.
Figure 4 shows the top 20 weekly mining power distribution in the Ethereum and Bitcoin networks. Each group of bars represents a chronologically ordered collection of weekly mining power rations, defined as the fraction of blocks contributed by a miner.
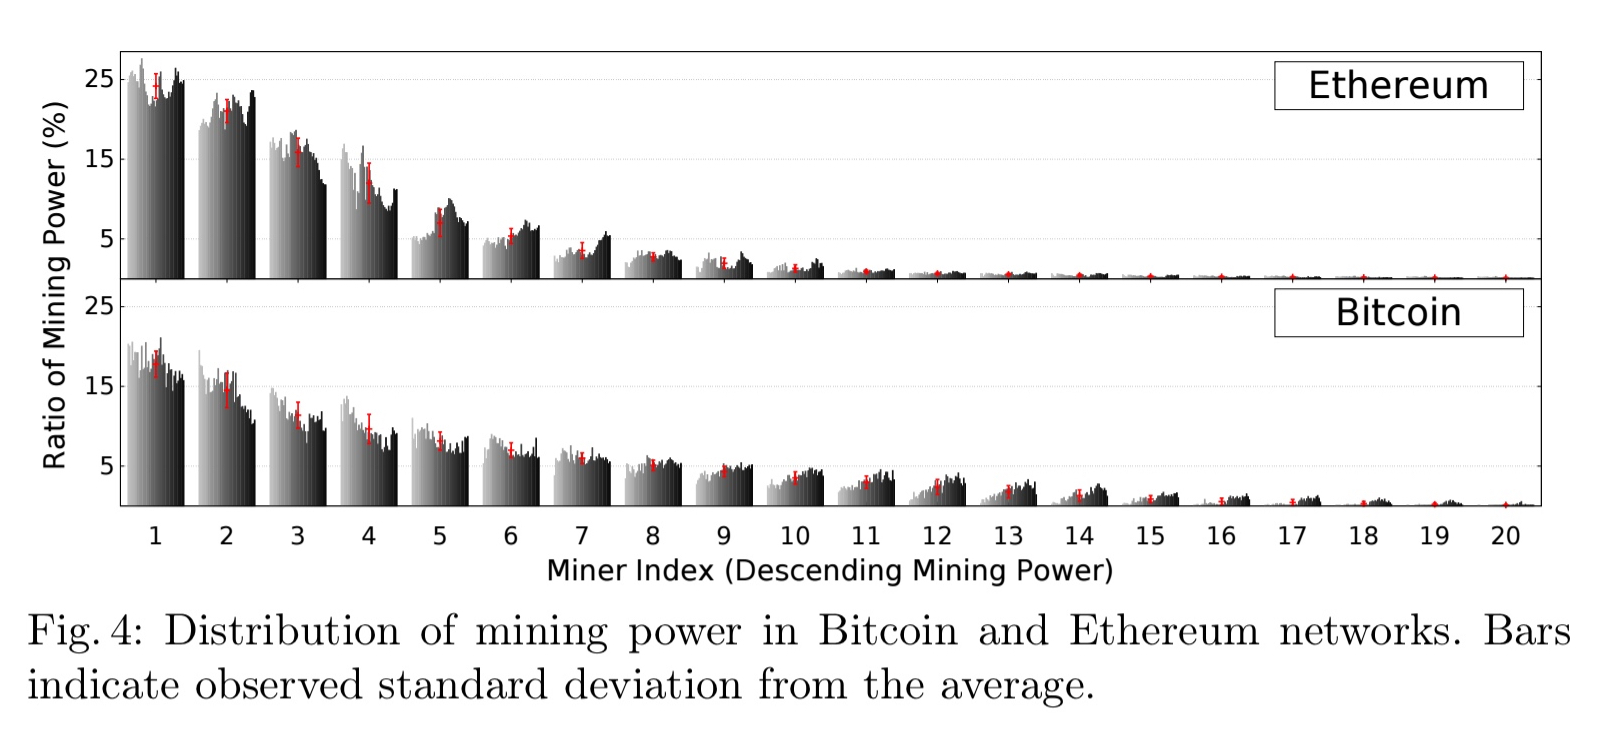
In Bitcoin, the weekly mining power of a single entity never exceeded 21% of the total power, whereas in Ethereum the top miner never had less than 21% of the total power. The top four Bitcoin miners combined have more than 53% of the average mining power. In Ethereum the top three have 61% of the average power. Miners do change spots in the rankings over the observation period, but place is contested by only a few miners. Only two Bitcoin and three Ethereum miners ever held the top rank.
To reach 90% of the mining power needs just 16 miners in Bitcoin, and 11 in Ethereum.
… both platforms rely heavily on very few distinct mining entities to maintain the blockchain.
You can fit the mining power trends to exponential distributions:
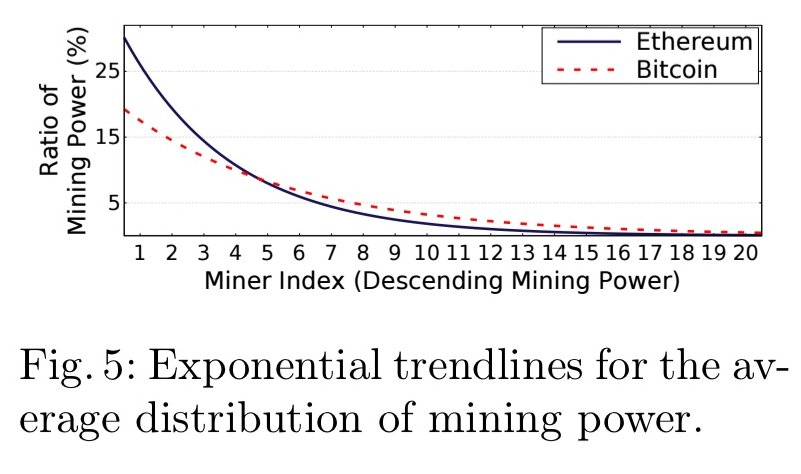
For all the proof-of-work going on, the centralisation reveals a rather sobering fact:
These results show that a Byzantine quorum system of size 20 could achieve better decentralization than proof-of-work mining at a much lower resource cost.
Moreover, miners are incentivised to obfuscate their true power so as not to raise alarms among the community about centralisation. “Thus, any analysis based on the voluntary miner data skews toward a more decentralized network than the reality.”
Utilisation of mining power
Mining power utisilation is a measure of the fraction of mined blocks that remain in the main chain. It tells us how efficiently the network converts energy spent into useful work (and therefore has a bearing on how much it costs to launch an attack).
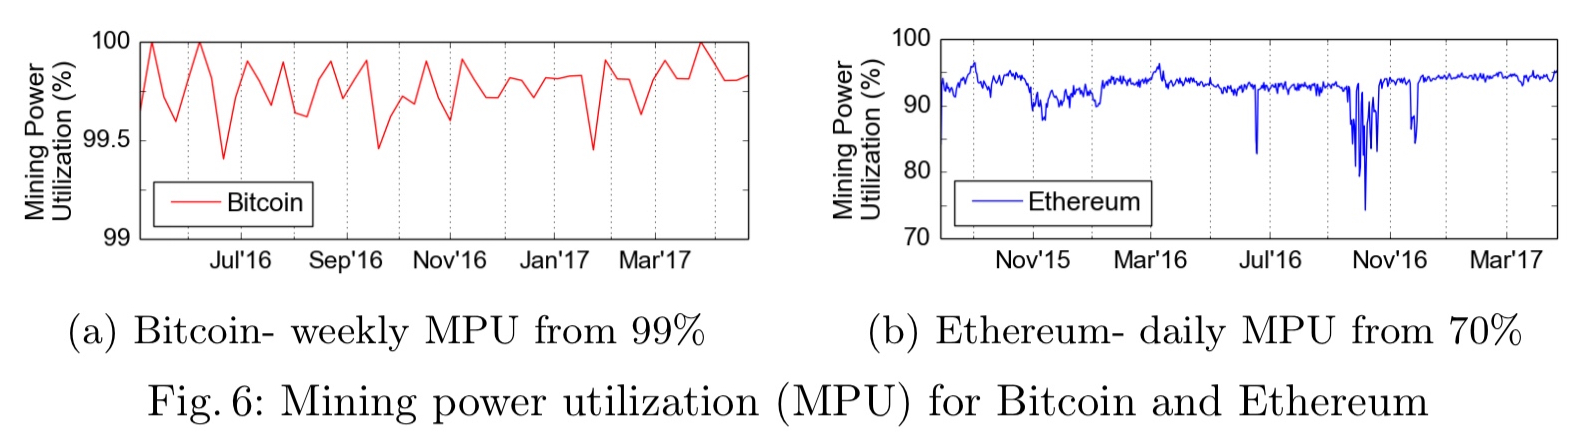
In the study period, Bitcoin utilisation is always above 99%, indicating that pruned blocks are relatively rare. In Ethereum daily utilisation is typically between 90% and 94%, with a peak at 97%.
Fairness to miners
Next we might ask whether all miners see pruned blocks (are on the losing sides of forks) with equal probability. I.e., is the system fair. Data on this is super interesting because it gives an indication as to whether more powerful miners are able to take advantage of their position in practice.
To study this relationship, we examine fairness defined as the ratio of a miner’s share of pruned blocks to her mining power. In a fair protocol, miners generate pruned blocks proportional to their mining power; hence, the fairness is close to 1. A fairness greater than 1 implies that the miner is at a disadvantage, while a fairness less than 1 implies that the miner has an advantage.
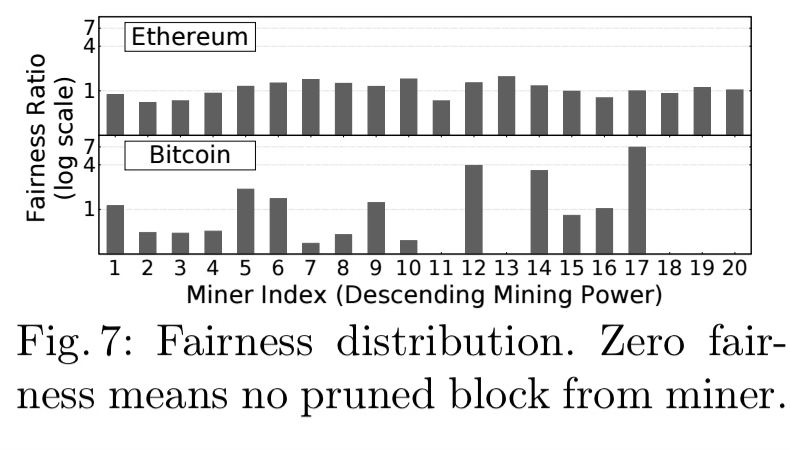
In both networks, the top four miners generally are more successful at appending blocks to the main chain. (Note the log scale in the figure above). Remember we’re not talking about more successful in absolute terms (which we would expect), but more successful relative to their mining power.
The means of the fairness distributions for Ethereum and Bitcoin are similar (10.8 and 1.22 respectively), but the variance is much greater for Bitcoin.
A high variance results in centralization pressure since smaller miners have a more difficult time affording the loss of revenue due to a transiently high fairness score. This high variance is a direct result of a significantly smaller number of blocks being generated in Bitcoin.
(Could it not also be the result of periodic attacks by larger mining pools?).
Simply increasing the block frequency might not be the answer though, as it impacts mining power distribution. “The increased block frequency in Ethereum may be part of the cause of the slightly more centralised mining power distribution.”
Network bandwidth
With more bandwidth, nodes can propagate and collect blocks faster. This makes it more difficult for malicious miners to sit in the network and attack the blockchain. Bitcoin nodes turn out to have more bandwidth than a typical Ethereum node, and the provisioned bandwidth has grown significantly.
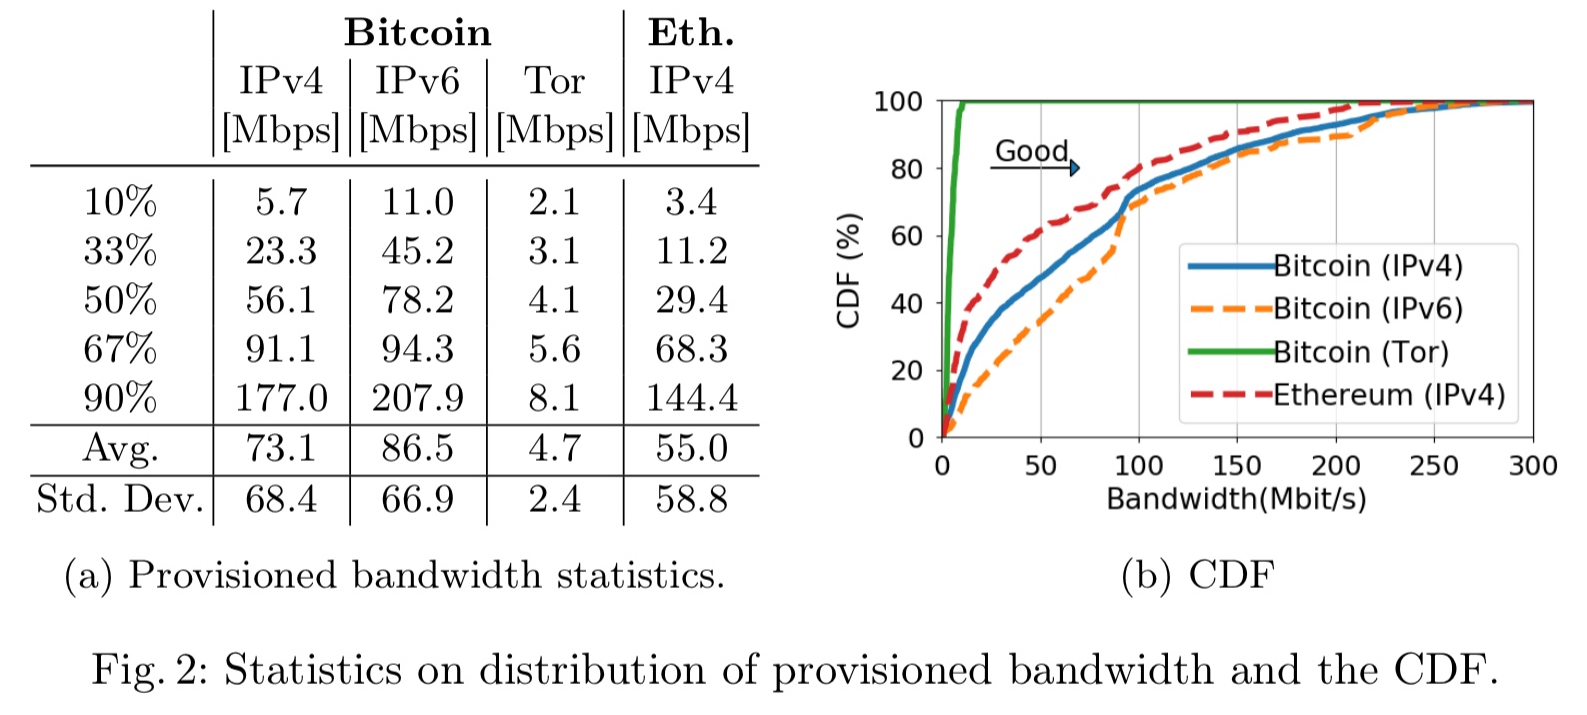
One of the most interesting discoveries of this study is that the Bitcoin network has improved tremendously in terms of its provisioned bandwidth. The results show that Bitcoin IPv4 nodes, which used to be connected to the network with a median bandwidth of 33 Mbit/s in 2016, have a median bandwidth of 56 Mbit/s as of Feb. 2017.
With more bandwidth, critical system parameters such as block size and frequency can be increased. The increase in provisioned bandwidth suggests that the block size can be increased by a factor of 1.7 without increasing centralisation beyond its de facto level in 2016.
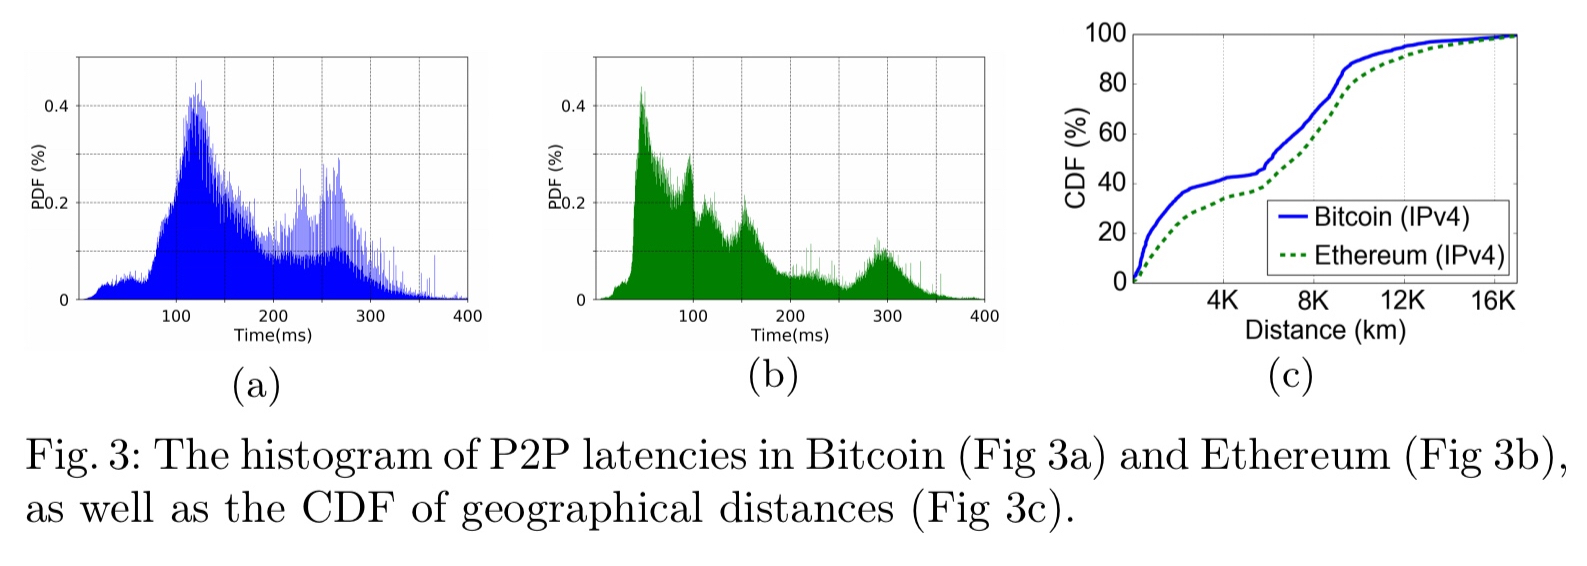
Network topology
A geographically clustered network can quickly propagate new blocks, making attacks more difficult. However, a less clustered network may also be an indication of better decentralisation.
We find that Bitcoin has many more nodes that are closer geographically than Ethereum… Ethereum’s most likely latencies are centered around 120ms, while Bitcoin nodes tend to be clustered around 50ms. Only 13% of Ethereum latencies are under 100ms, while Bitcoin has a surprisingly high 46%.

Very complex stuff. Still hashgraph seems to be the safest way.
I wonder about the “Fairness means are similar” part: as one miner gets more advantage, the others automatically get more disadvantage relative to them, so the total tends to change less and the mean changes just by (change of total/number of miners considered). Naively I wouldn’t be surprised if the mean of this metric turned out to _always_ be pretty close to 1, and variance to better indicate fairness.
Or is the mean taken not across the miners but across time for each miner?
(also 10.8 is probably 1.08, judging from the graph)
Loom Network is the first production-ready platform that could increase the capacity of Ethereum network and leapfrog ongoing efforts such as Raiden Network and Plasma. However, the security drawback is because it is centralized.
Read more here: https://goo.gl/RxYX7L
seems you are neglecting fact that many miners mine from a pool. I’m one. We all get shares from the pools effort. when you see one large pool ETH address, that address is sharing it’s mining rewards among many many individuals (decentralized in that sense). I can switch the pool at any time so it’s not like I’m captive to that pool.
Nice writing and explained in detail.