Canopy: an end-to-end performance tracing and analysis system Kaldor et al., SOSP’17
In 2014, Facebook published their work on ‘The Mystery Machine,’ describing an approach to end-to-end performance tracing and analysis when you can’t assume a perfectly instrumented homogeneous environment. Three years on, and a new system, Canopy, has risen to take its place. Whereas the Mystery Machine took 2 hours to compute a model from 1.3M traces, Canopy can scale well beyond this.
Canopy has been deployed in production at Facebook for the past 2 years, where it generates and processes 1.3 billion traces per day spanning end-user devices, web servers, and backend services, and backs 129 performance datasets ranging from high-level end-to-end metrics to specific custom use cases.
Design motivation
Like the Mystery Machine, Canopy takes inspiration from the core ideas in e.g. X-Trace and Dapper, constructing and sampling performance traces by propagating identifiers through the system. In making this work within Facebook’s heterogeneous and fast-moving environment, three main challenges arose:
- Performance data itself is heterogeneous, with many execution models (e.g. synchronous request-response, async callbacks, queueing, …) and wide variety in the granularity and quality of data available to be profiled. Understanding all of the low-level details across multiple systems is too much of a human burden, and designating a single high-level model to be used everywhere is too impractical.
- Operators often want to perform high-level, aggregated, exploratory analysis, but the rich fine-scale data collected in traces, and the sheer volume of collected traces, makes this infeasible off the back of the raw event data.
- End-to-end performance analysis means that many engineers share the same tracing infrastructure. By design, traces contain all of the data necessary for any engineer to identify issues. This presents an information overload in any one case.
To address these challenges Canopy provides a complete pipeline for extracting performance data across the stack (browsers, mobile applications, and backend services), with customisation supported at each stage of the pipeline. Generated performance data is mapped to a flexible underlying event-based representation, and from this a high-level trace model is reconstructed in near real-time. The model is well suited to analysis and querying, and can extract user-specified features from traces.
Flexibility in the system at all levels is key:
… it is difficult to predict the information that will be useful or the steps engineers will take in their analysis. In practice at Facebook, successful approaches to diagnosing performance problems are usually based on human intuition: engineers develop and investigate hypotheses, drawing on different kinds of data presented in different ways: individual traces, aggregates across many traces, historical trends, filtered data and breakdowns, etc…. The goal of Canopy is to allow human-generated hypotheses to be tested and proved or disproved quickly, enabling rapid iteration.
Canopy by design does not promote a single first-class instrumentation API. With different execution models, third-party systems to integrate, multiple versions of core frameworks in use across different services, and so on this is an impossible dream. The underlying trace model is decoupled from instrumentation.
How Canopy works
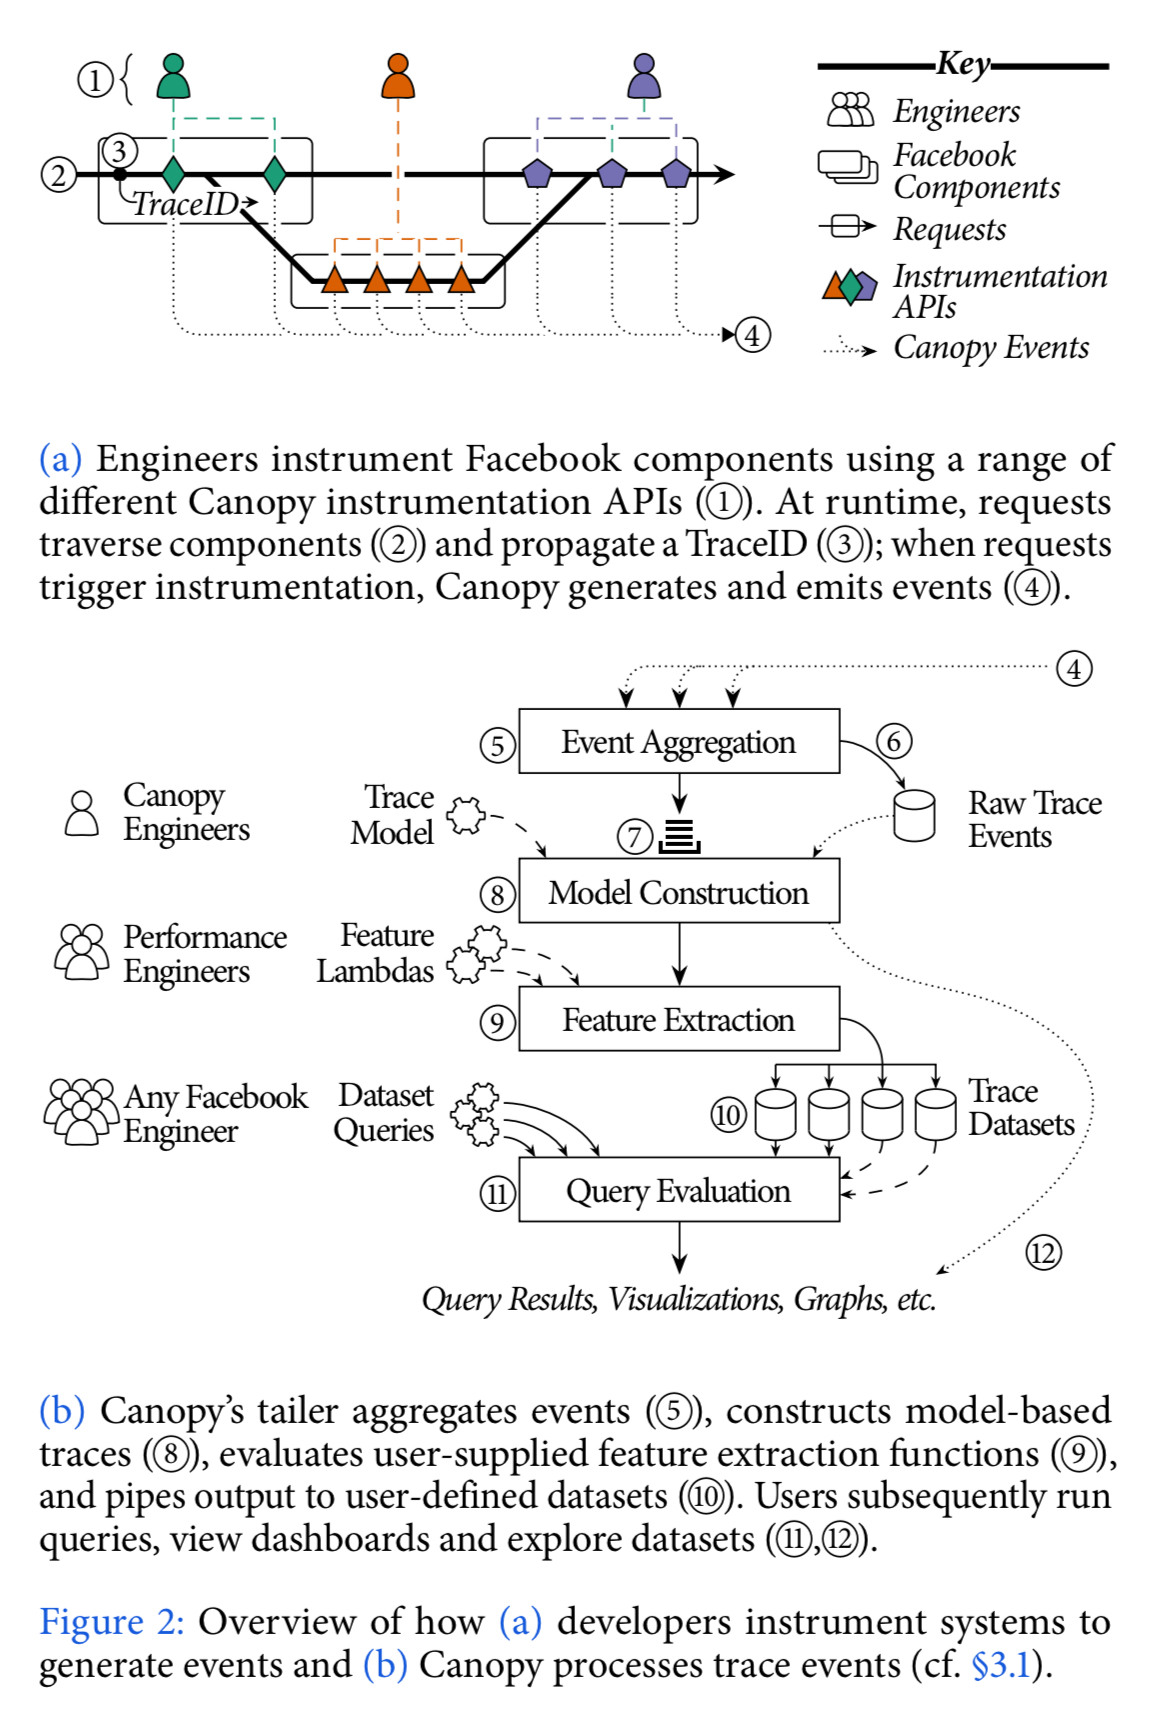
At a high-level, Canopy looks like this:

With reference to the numbers in the figure above,
- System components are instrumented using Canopy instrumentation APIs. Instrumentation involves (i) propagation of TraceIDs alongside requests, (ii) recording the request structure – where and when it executes, network communication, causality between threads, and so on, and (iii) capturing useful performance data, e.g., logging statements, performance counters, stack traces etc.. There are low level libraries in several languages, adapted to the environments they will be used in (e.g., PHP). The APIs are broken down into small decoupled pieces, giving engineers access to narrow APIs that naturally fit a specific task in hand. With no single perspective on instrumentation, and no first-class system model, new API to capture new aspects of performance can easily be introduced without invalidating existing instrumentation. This approach also allows third-party tracing libraries such as HTrace and Cassandra tracing to be integrated.
- At runtime, requests to Facebook traverse the instrumented system components. Each request is assigned a unique TraceID.
- The TraceID is propagated along the request’s end-to-end execution path, including across process boundaries and during fan out and fan in.
- Not every request is recorded. A call to start a trace first has to acquire a token from a distributed token bucket. This rate-limits traces both globally and per-tenant. If a token is successfully obtained, tracing is enabled for the request. Users may also provide their own sampling policies so that e.g., requests with specific properties can be targeted. This is all managed by configuration (see ‘Holistic configuration management at Facebook’): a Configerator daemon manages Canopy’s sampling and token bucket configurations in memory and synchronizes global updates in real-time, thereby enabling users to rapidly deploy sampling policies. When instrumentation is triggered, Canopy generates events capturing performance information and causality. All instrumentation APIs map down to a common underlying event representation. This provides a bridge across system components and allows cross-component analysis.
- Events are routed to a tailer (sharded by TraceID). The tailer aggregates events in memory.
- The tailer also writes raw events to storage.
- Once all events have (most likely) been received for a request they are queued for processing. Incoming events are pattern matched, and processing is initiated after suitable timeouts. For example: 10 minutes after the first client browser event, or one day after identifying a trace from Facebook’s automated build system.
- Processing maps events to the underlying trace model, which provides a single high-level representation for performance traces across all systems. The model describes requests in terms of execution units, blocks, points, and edges: “Execution units are high level computational tasks approximately equivalent to a thread of execution; blocks are segments of computation within an execution unit; points are instantaneous occurrences of events within a block; and edges are non-obvious causal relationships between points.”
- Canopy then runs any user-defined feature lambdas, which extract or compute interesting features from each modelled trace. The resulting trace-derived datasets are Canopy’s high-level output, and each column of a dataset is a feature derived from a trace. Feature extraction is the most heavily iterated component in Canopy. Initially there was just a simple DSL, but this was insufficiently expressive and the DSL grew over time. Canopy now even supports integration with iPython notebooks for ad-hoc queries.
- The generated datasets are then piped to Scuba, an in-memory databased designed for performance data.
- Users can then query datasets directly as well as view dashboards backed by those datasets.
- There are also tools for drilling down into the underlying traces if deeper inspection is needed.
Canopy currently generates and processes approximately 1.16Gb/s of event data. The Scribe event delivery system can scale several orders of magnitude beyond this, and Canopy uses just a small fraction of the overall capacity of Facebook’s Scribe infrastructure.
Canopy in action and lessons learned
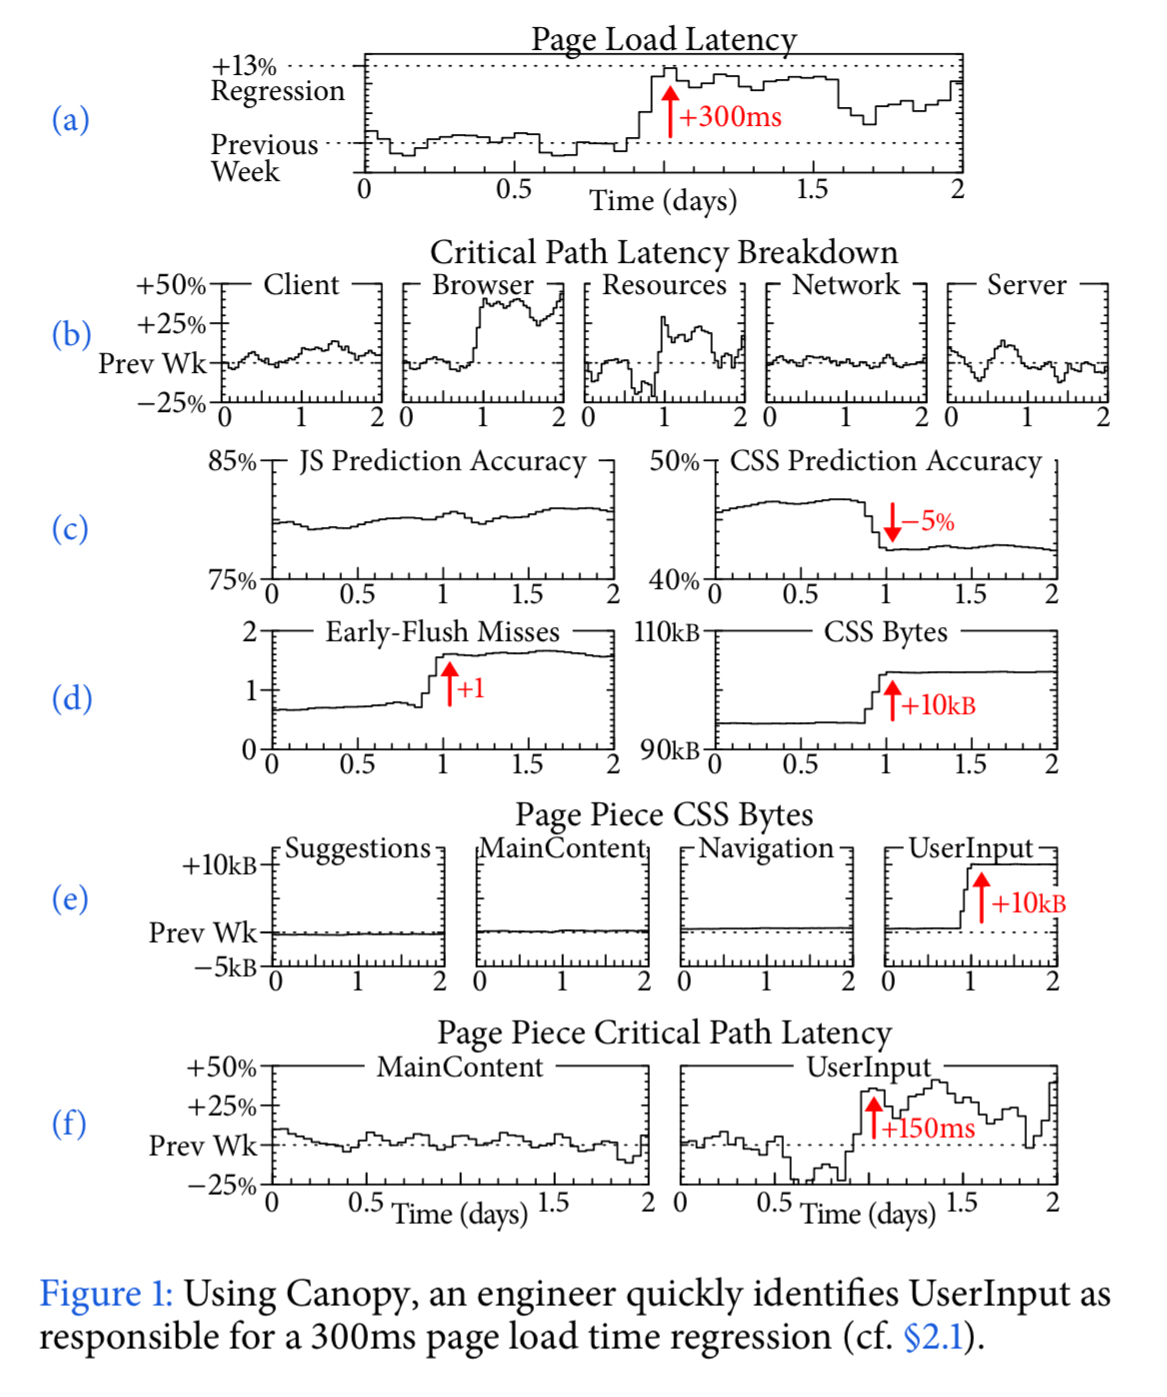
Canopy provides multiple different visualisations to engineers, as can be seen in the figure below:

The following sequence of charts illustrate the use of Canopy to discover the cause of 300ms regression in page load time for a particular page.

In (a) the jump in latency is clearly seen. At step (b) the latency is broken down into its constituent parts, revealing browser execution time and resource fetching time (CSS, JS, etc.) as the possible culprits. Diagnosing the change in resource loading time is made possible by drilling into the resource prediction accuracy (c) (server side determination of the resources necessary for initial page display), which showed a 5% drop in CSS prediction accuracy. In (d) we can see that an extra 10kB of CSS is being sent, and this is taking the place of useful resources forcing clients to wait. At step (e), it is possible to drill into the individual page components, revealing the UserInput component is the cause of the CSS bytes increase. This increases time on the critical path in the client (f). The problem was fixed by reconfiguring the early flush mechanism.
Over time, the trace model used by Canopy has evolved. It began with a block-based RPC model analogous to Dapper’s spans, including client-send (CS), client-receive (CR), server-send (SS) and server-receive (SR) events. “However, we were unable to express more fine-grained dependencies within services, such as time blocked waiting for the RPC response.” The second model — (b) in the figure below — introduced execution units.

This model was still insufficient to capture the wait time between receiving and processing an RPC response, and so client-queue (CQ) events were added to the model — (c) and (d) in the figure above.
As Canopy became more widely used, and encountered a wider range of patterns (one-away, multi-response, streaming, pub-sub, and so on) the model’s representation of RPCs was finally decoupled into sets of edges, where an edge is a one-way communication between any two blocks — (e) in the figure above.
Although we no longer require the four event types of the initial model, the existing instrumentation is still compatible with each revision of the model, as they simply translate to a pair of edges in the current model.
You’ll find more experiences and lessons learned in section 6 of the paper.
canopy instrumentation api generate log events flushed to local disk ?
or directly flushed to scribe system ?
thanks