“The Leicester City Fairytale?” : Utilizing new soccer analytics tools to compare performance in the 15/16 and 16/17 EPL seasons Ruiz et al., KDD’17
In England the cricket season is coming to a close and a new football (soccer) season is getting underway. Today’s paper choice is a bit of fun from the recent KDD’17 conference, where the data scientists from stats.com look into what can be learned from Leicester City’s winning 2015/16 season. Along the way, they develop a strategic gameplay features model that goes behind the usual shots on target etc., and proves useful in predicting the outcomes of games.
The fairytale of Leicester City winning the English Premier League (EPL) in 2015/16 has been well documented… there were many storylines and explanations that resonated with the footballing community.
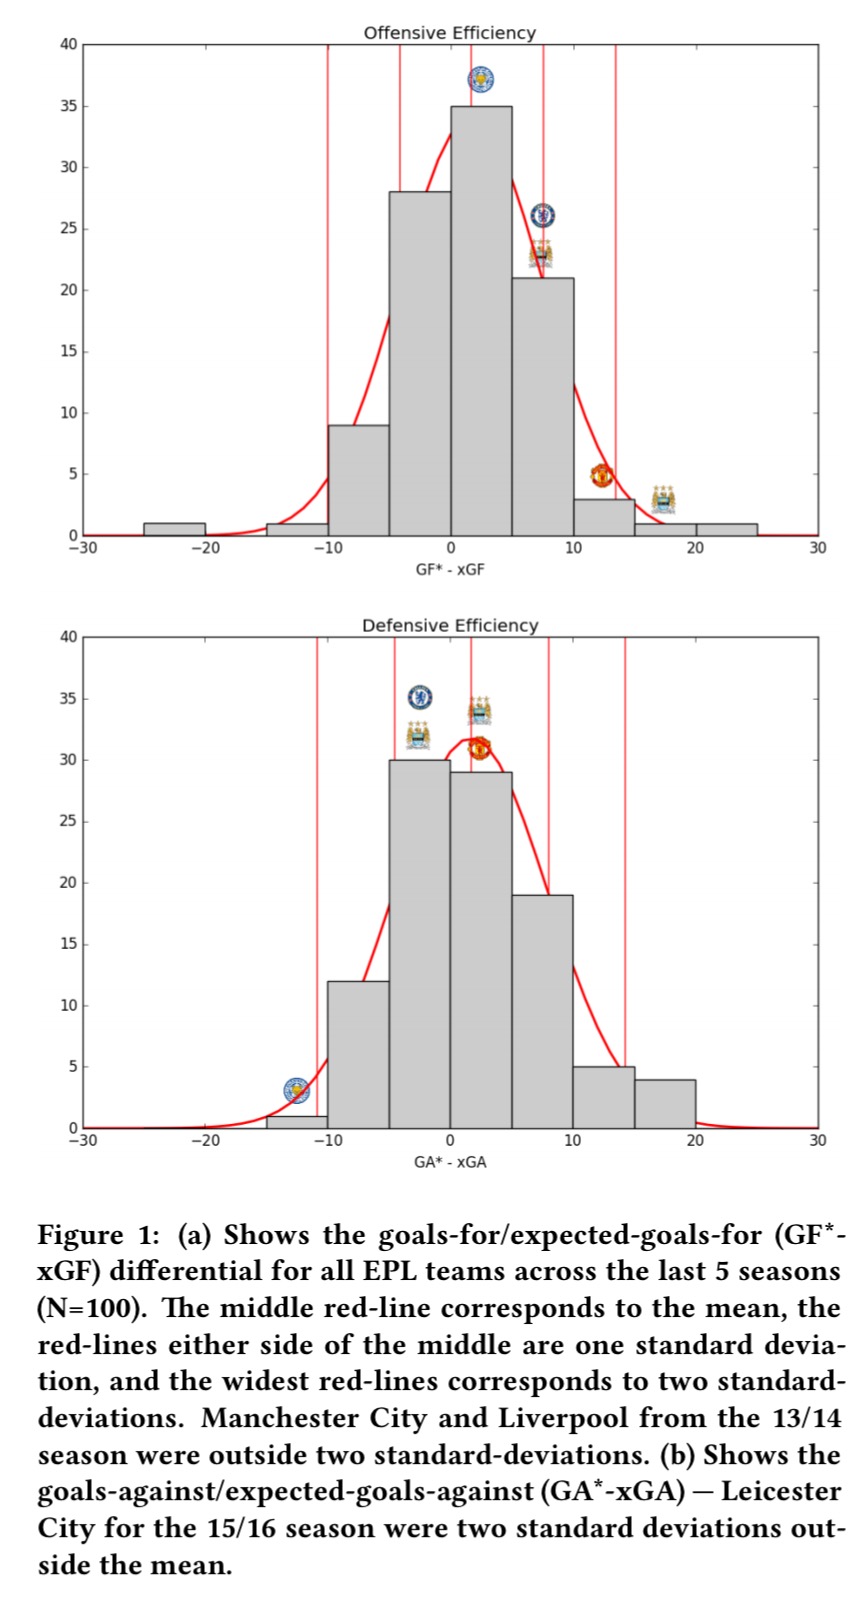
Much was made of Leicester City’s counter-attacking play: they tended to cede possession more often (43% possession vs a 55% average), and hit teams on the counterattack. If you look at their expected goal value though (the likelihood of an average player scoring from a given situation) they actually weren’t superior to the other top teams.
So if Leicester City were not more effective than other teams offensively due to their counter-attacking/direct style of play, how did they win the 2015/15 title? Well, there are two reasons…
- Absence of normal contenders – in the previous 5 years, each year a champion emerged with significantly better goal scoring effectiveness than the average. In the 2015/16 season, that did not happen.
- Leicester City had the most effective defence.
Three factors contributed to their defensive effectiveness: goal-keeping, their defensive strategy, and how effective they were at disrupting passes. Let’s quickly cover the goal-keeping and pass interception stats so that we can focus on the development of the strategy model.
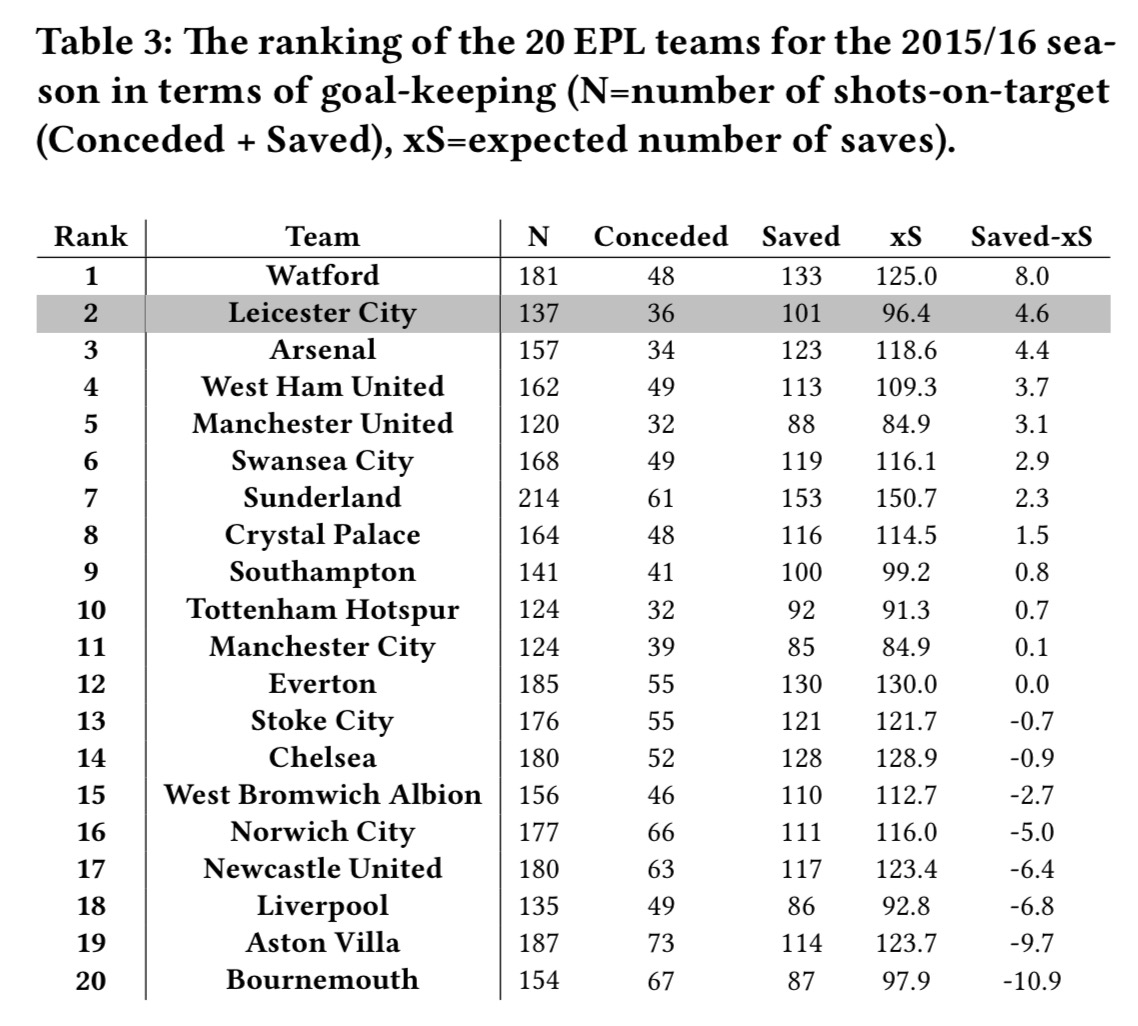
Goal-keeping
The expected save value measures the likelihood of a goalkeeper making a save from a shot. In the predictive model, shots are described with a collection of features including:
- Shot location coordinates
- Goal angle and distance
- Previous angle and distance (for the ball touch before the shot)
- Shot type: open play footed, headed, free-kick, penalty.
- Cutback – binary feature indicating whether the shot was preceded by a cutback pass
- First touch – binary feature to indicate whether the shot was a first-touch ball contact.
Three classifiers are trained on a dataset of all shots from the five most recent EPL seasons. We can now see how well an individual goalkeeper performs compared to average (predicted) outcome. The analysis shows that the Leicester keeper, Kasper Schmeichel, accounted for 4.6 of the 10.7 goal differential for Leicester.
Passing analysis
With current machine learning techniques, we can measure the difficulty of a pass – which can give us an indication on whether a defence is ‘forcing’ an attacker to attempt a more difficult pass than necessary or turning low probability transition situations into high probability transition situations such as a 50-50 challenge.
A pass difficulty model was trained on 480K labelled examples (pass made = 1, pass not made = 0). The passing model was based on prior work (e.g., ‘Beyond completion rate: evaluating the passing ability of footballers‘). In the following plot, based on “Hinton diagrams” the size of the square represents number of passes in each band, and the intensity of the colour represents the interception rate. Passes are broken into 5 bands based on proportion of passes completed according to passing difficulty (100% is the easiest pass).
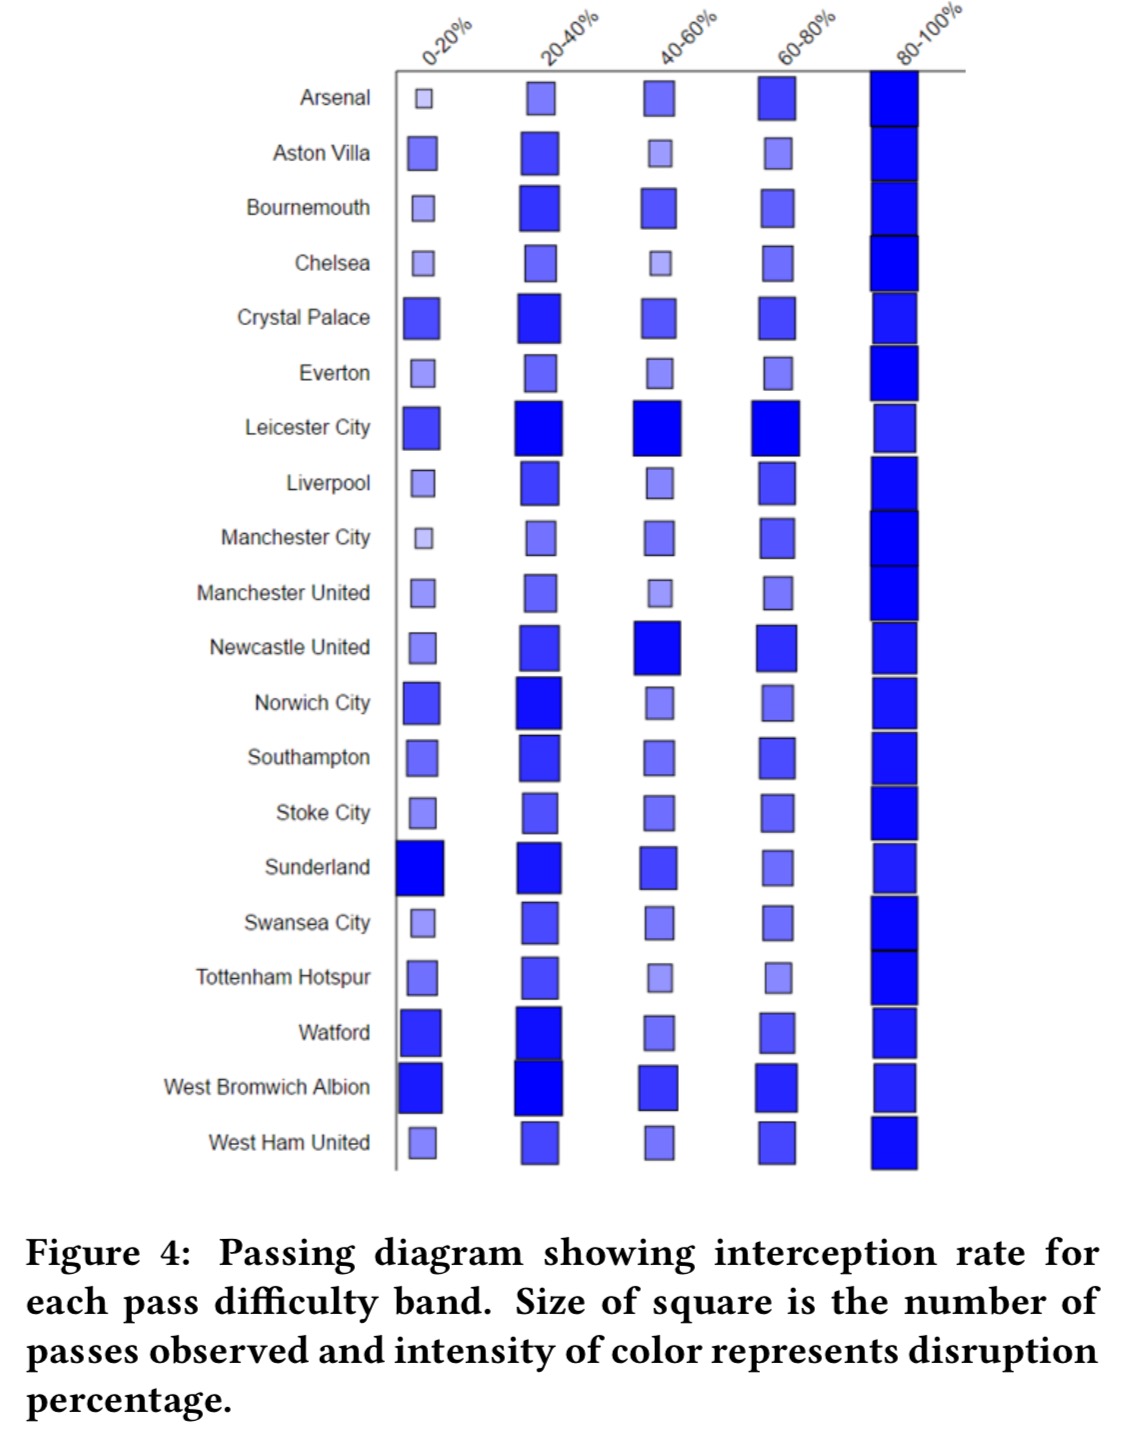
… Leicester City exceled (ranking 1st) at regaining the ball for passes in the 21-40%, 41-60%, and 61-80% bands. At an individual level, N’Golo Kanté was the highlight of the team; he was the midfield player with the highest interception rate for passes in the ` The interpretation of a strategy plot is quite simple – the size of the square corresponds to number of shots (relative to the maximum value observed in the league for that category) and intensity of color corresponds to the effectiveness of each method with respect to expected goals (light red = low expectation, dark red = high).
So you can see for example that Leicester conceded a comparatively large number of shots via direct play, but were effective in dealing with them.
Here’s a strategy plot comparing all the teams in the league for the 2015/16, and their attacking and defending efficiency across shot types:
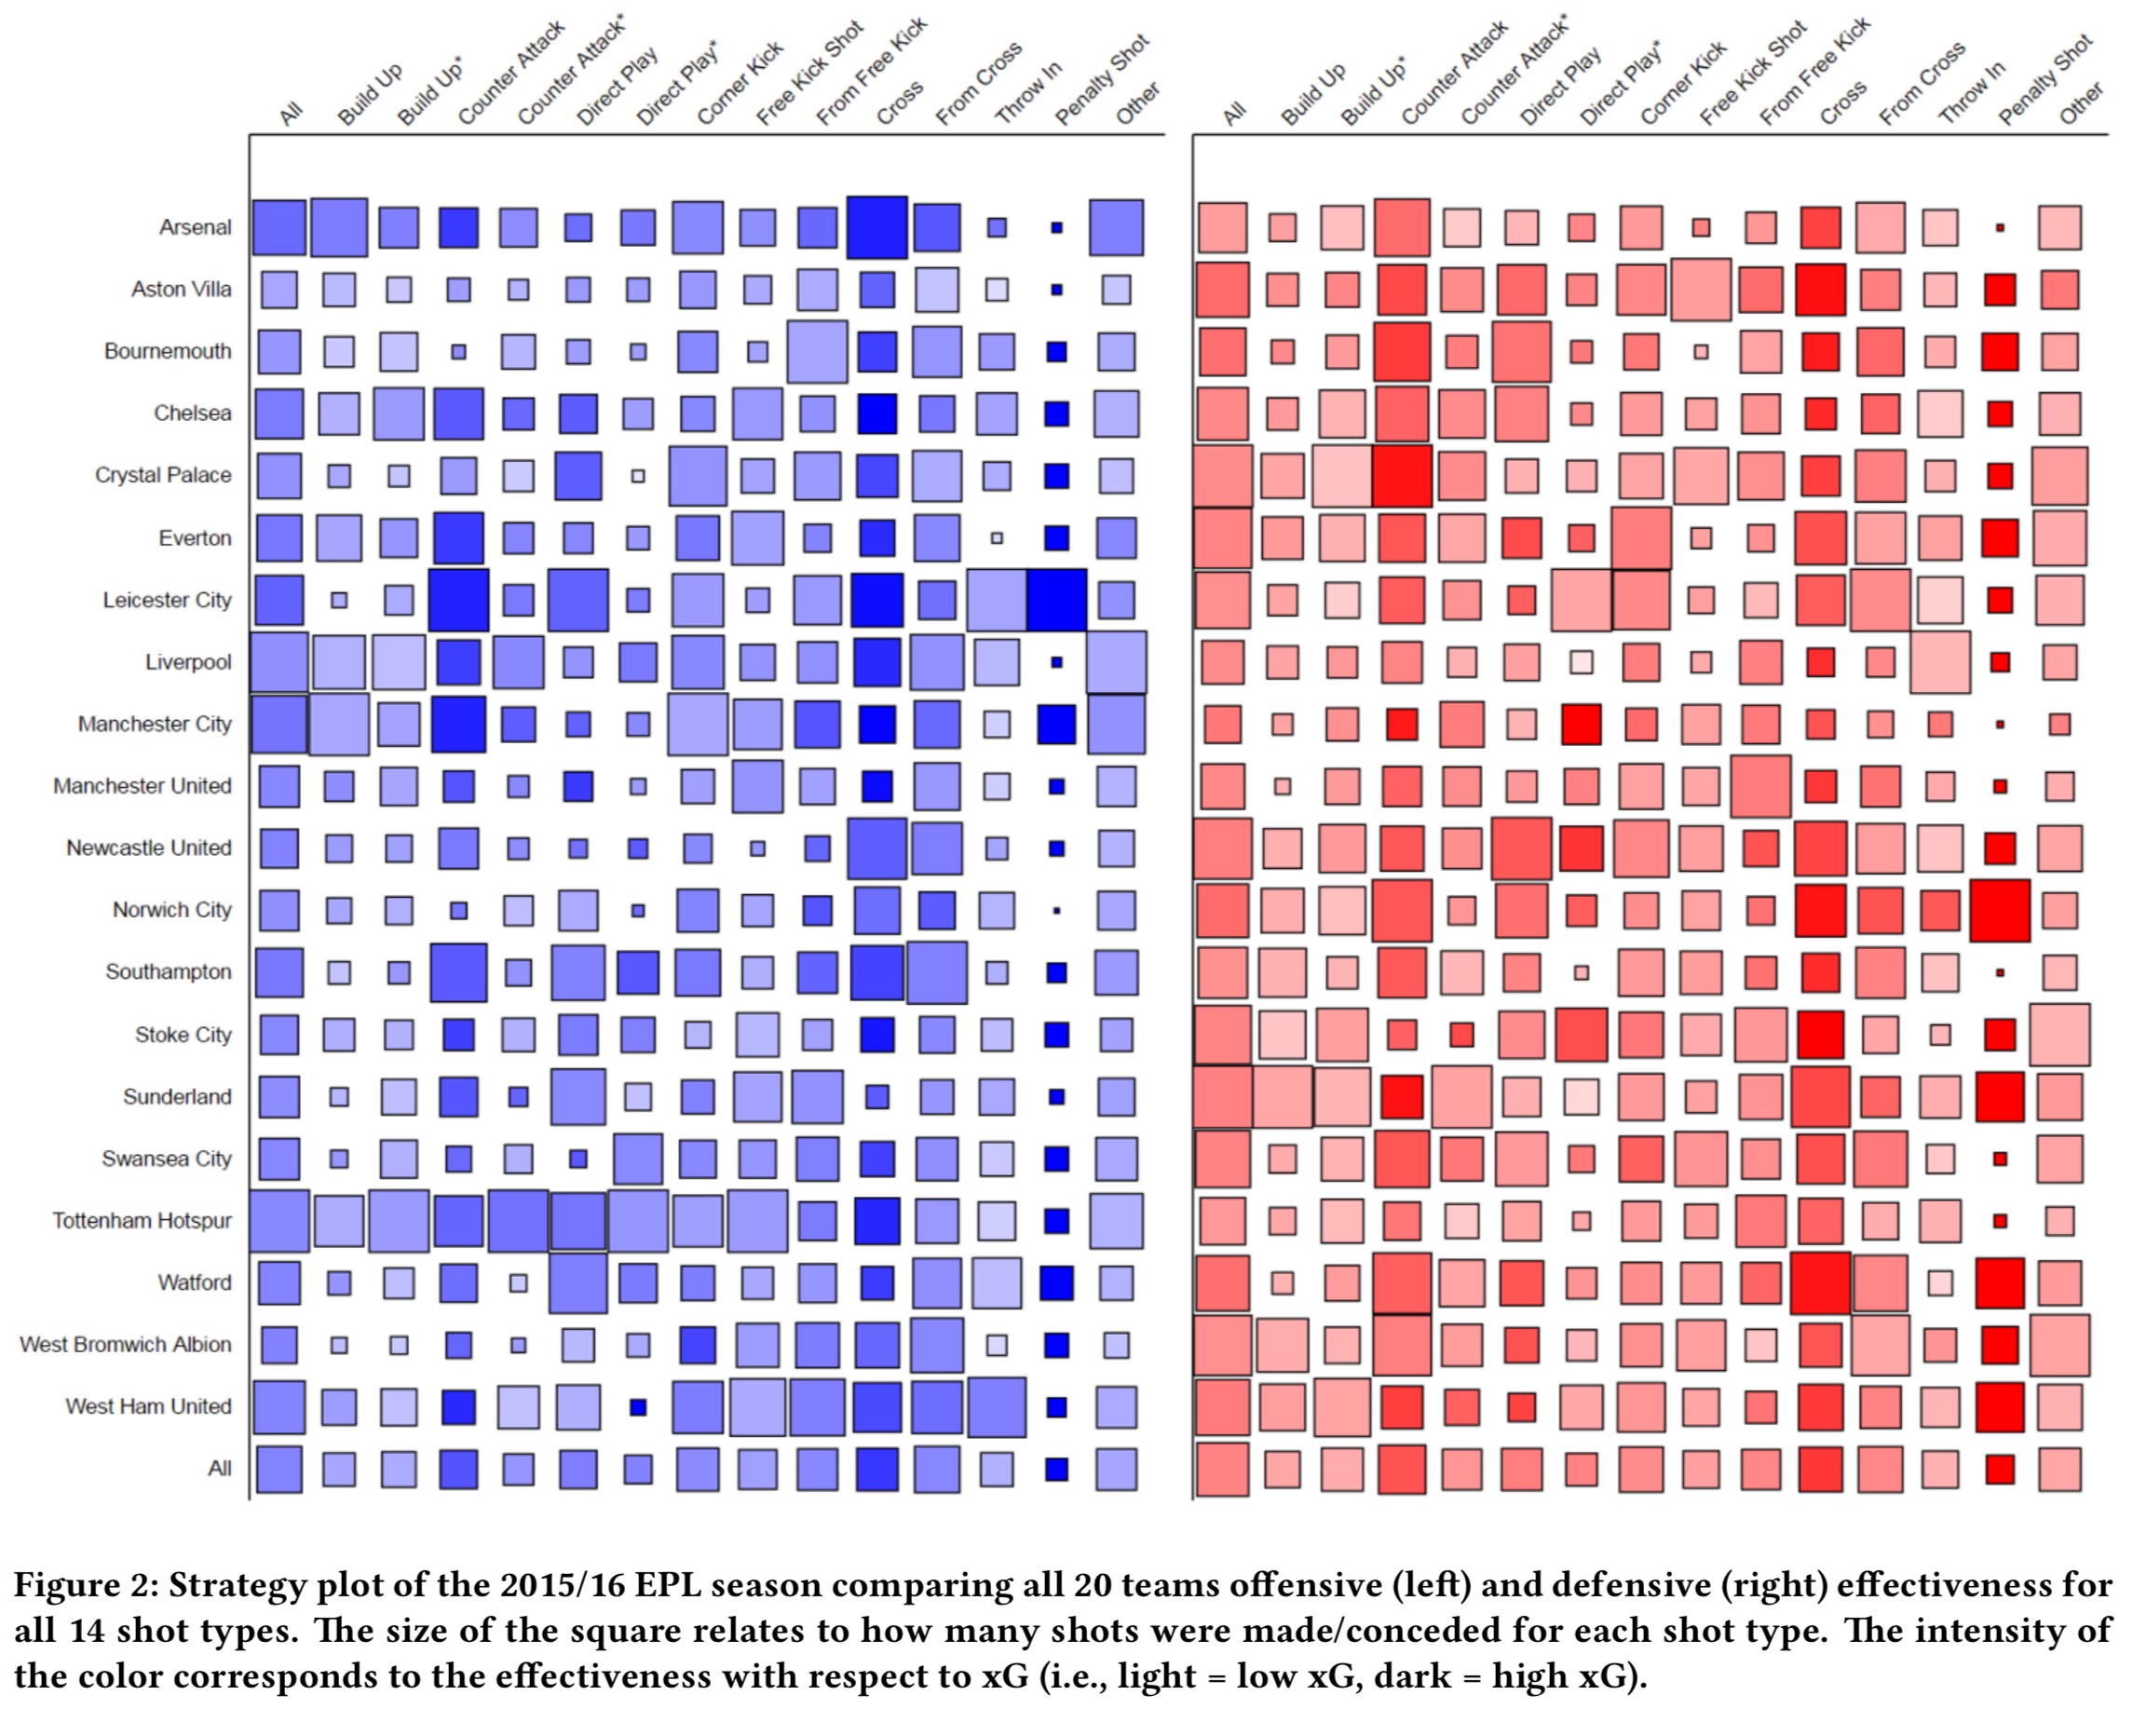
What immediately jumps out is that Leicester City had a lot of counter-attacks and were very effective using this method of scoring. They were also the team with the most penalties, 13 throughout the season.
Using strategic features for prediction
Can the strategic play features be useful for outcome prediction? The authors built four regression models to predict the number of shots and goals that a given team will score in a game. The models use increasing feature sets to see what impact adding in strategic play features has. In model 1 only the average number of shots and goals in the training dataset is available. Model 2 adds a binary input indicating home or away. Model 3 adds 14 inputs, one for each shot type indicating the number of types of each shot the team we are predicting for has made, and Model 4 adds another 14 inputs representing the average proportion of shots of each type taken by the opposition.
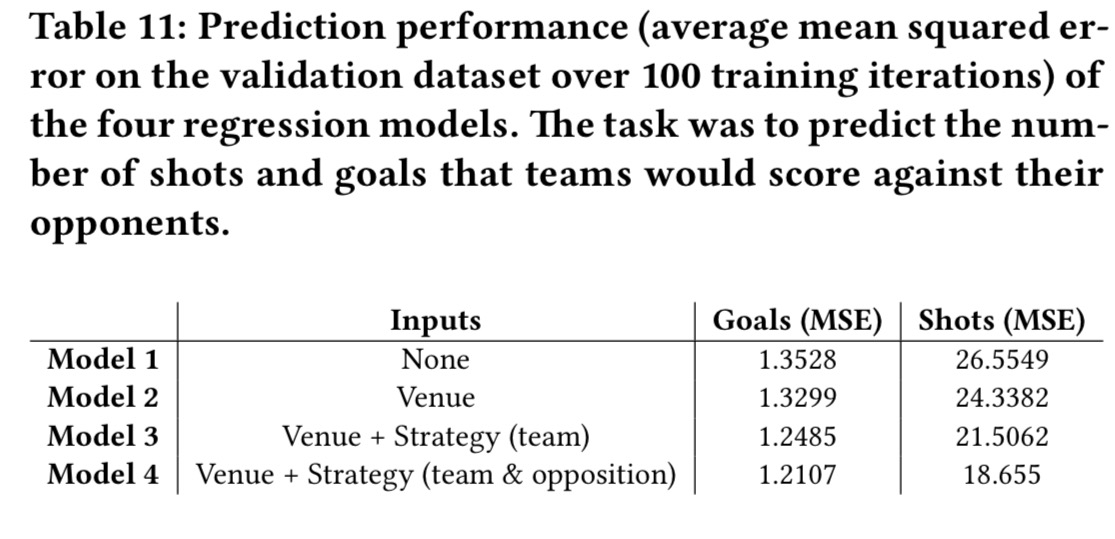
… the largest performance bump comes when we incorporate the strategy features for the team of interest, both in terms of number of goals and shots. Adding the style information of the opposition boosts the model once again. This confirms that the strategy plots and the data powering them are not just a description of teams’ preferences and habits, but that they are also correlated with their success or lack thereof on the pitch.
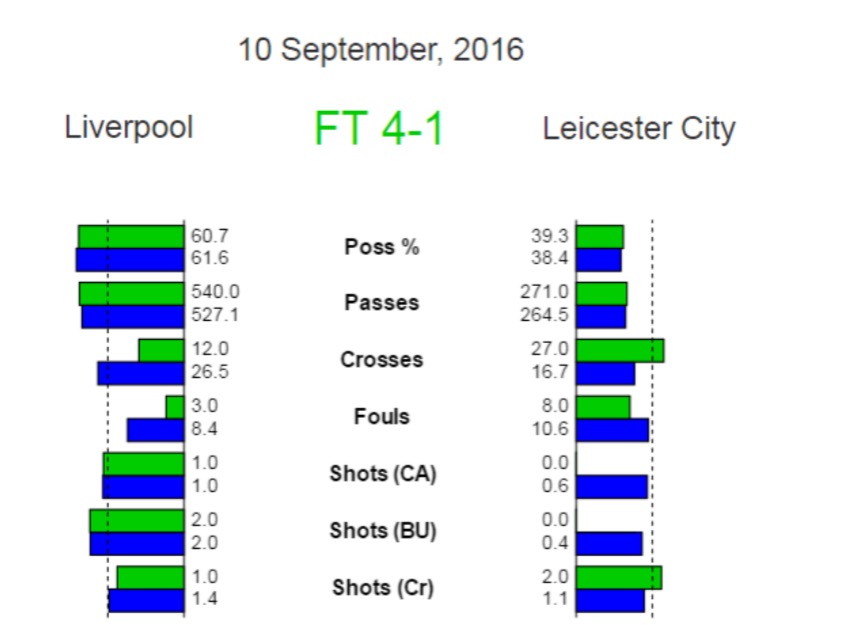
Extending this approach, a recommender was built to estimate the expected number of shots by type that teams will generate in an upcoming game.
Here we see predictions for Leicester City playing away against Liverpool (a tough opponent). Blue bars are the pre-match predictions, green bars are the actual match results.
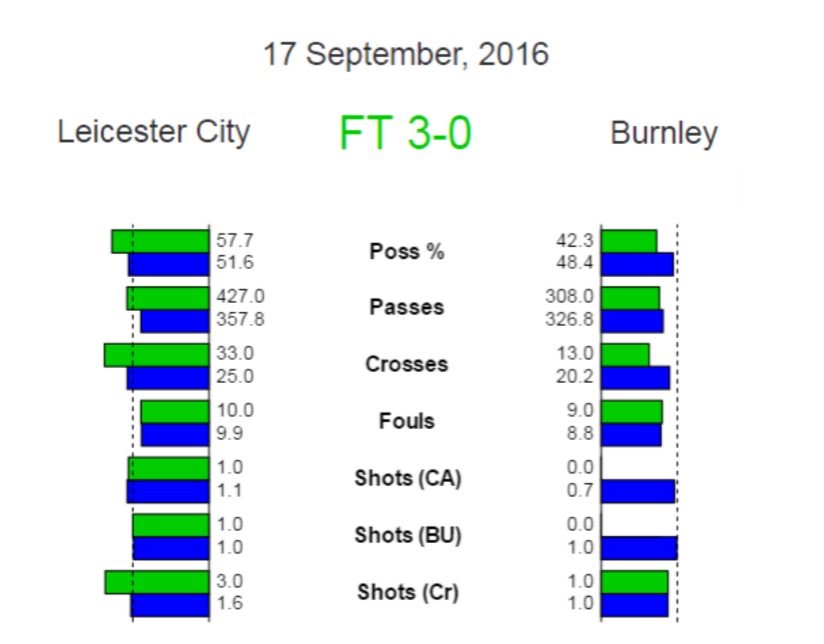
And these are the predictions for a home game Leicester played a week later at home against weaker opposition:
The analysis tool we have used in this case study provide insightful information about strategy and efficiency in soccer. Furthermore…, their descriptive nature has a predictive byproduct that allows for their use as the core of a ‘recommendation engine’ that can support professionals in the challenging task of pre-game preparation.

2 thoughts on ““The Leicester City fairytale?”: Utilizing new soccer analytics tools to compare performance in the 15/16 and 16/17 EPL seasons”
Comments are closed.