SyncPerf: Categorizing, detecting, and diagnosing synchronization performance bugs Mejbah ul Alam et al., EuroSys’17
This paper is an investigation into the causes of synchronisation-related performance issues in concurrent systems, together with a pair of tools that can help to detect and diagnose them. The main SyncPerf detection tool is very lightweight (average overhead 2.3%). It detects performance issues, and the information it provides is also enough to diagnose some of them. When the diagnostic information provided by the detection tool is not enough, the SyncPerf diagnostic tool can be used to make a deeper investigation. This tool has higher overhead (3.5x-9.9x), but is still considerably lower than similar tools – excessive performance overhead is avoided by only investigating the critical sections highlighted by the detection tool.
SyncPerf discovers many previously unknown but significant synchronization performance issues. Fixing them provides a performance gain anywhere from 2.5% to 42%. Low overhead, better coverage, and informative reports make SyncPerf an effective tool to find synchronization performance bugs in the production environment
Over and above the tools, the analysis of performance related issues is of interest in its own right.
Understanding synchronisation related performance issues
This work addresses performance issues related to synchronisation primitives such as locks, conditional variables, and barriers. Lock-free / wait-free techniques, transactional memory and so on are out of scope. In scope however, are performance problems outside of the usual hotspot of frequently acquired and highly contended locks.
Our first observation is that performance problems can also occur with locks that are not excessively acquired or highly contended.
There’s even a handy four-quadrant diagram to hammer home the point:
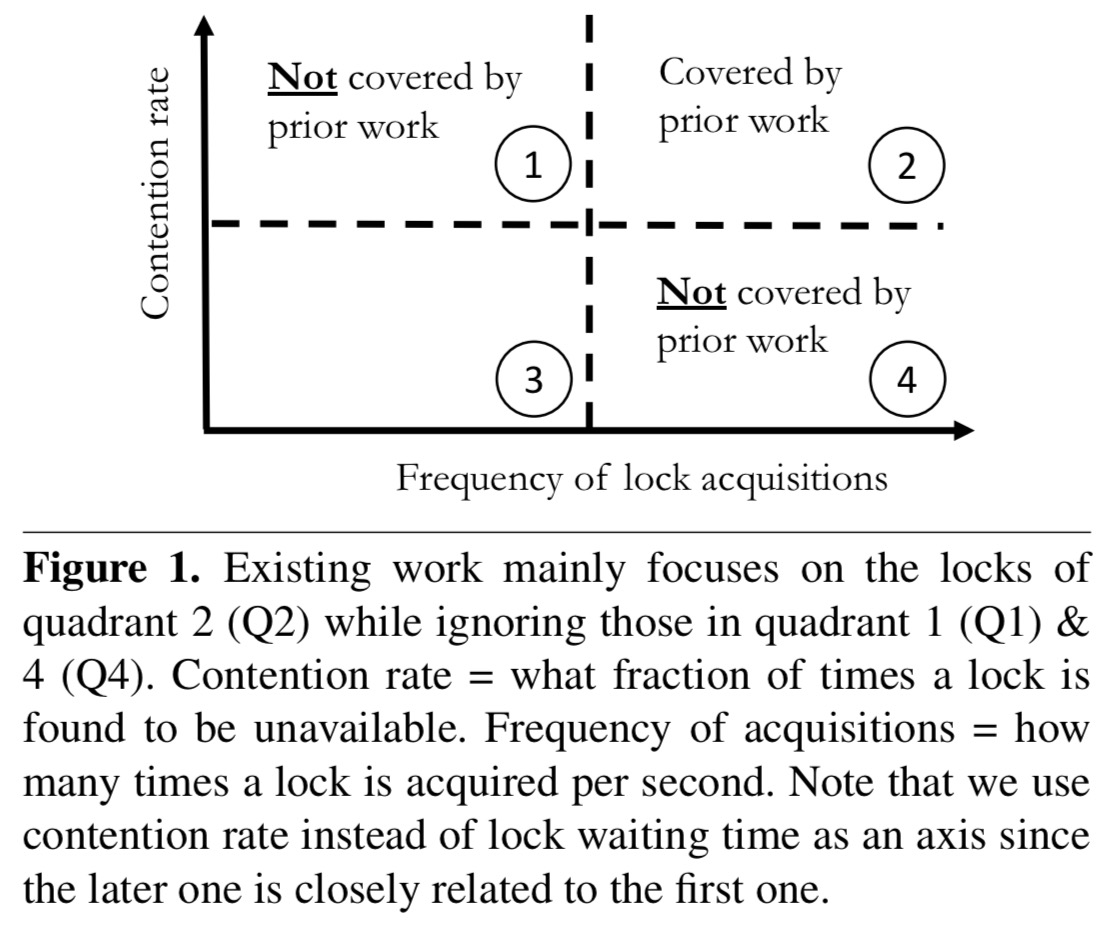
If we put the focus on performance issues, rather than prior publications, the quadrant looks something like this:
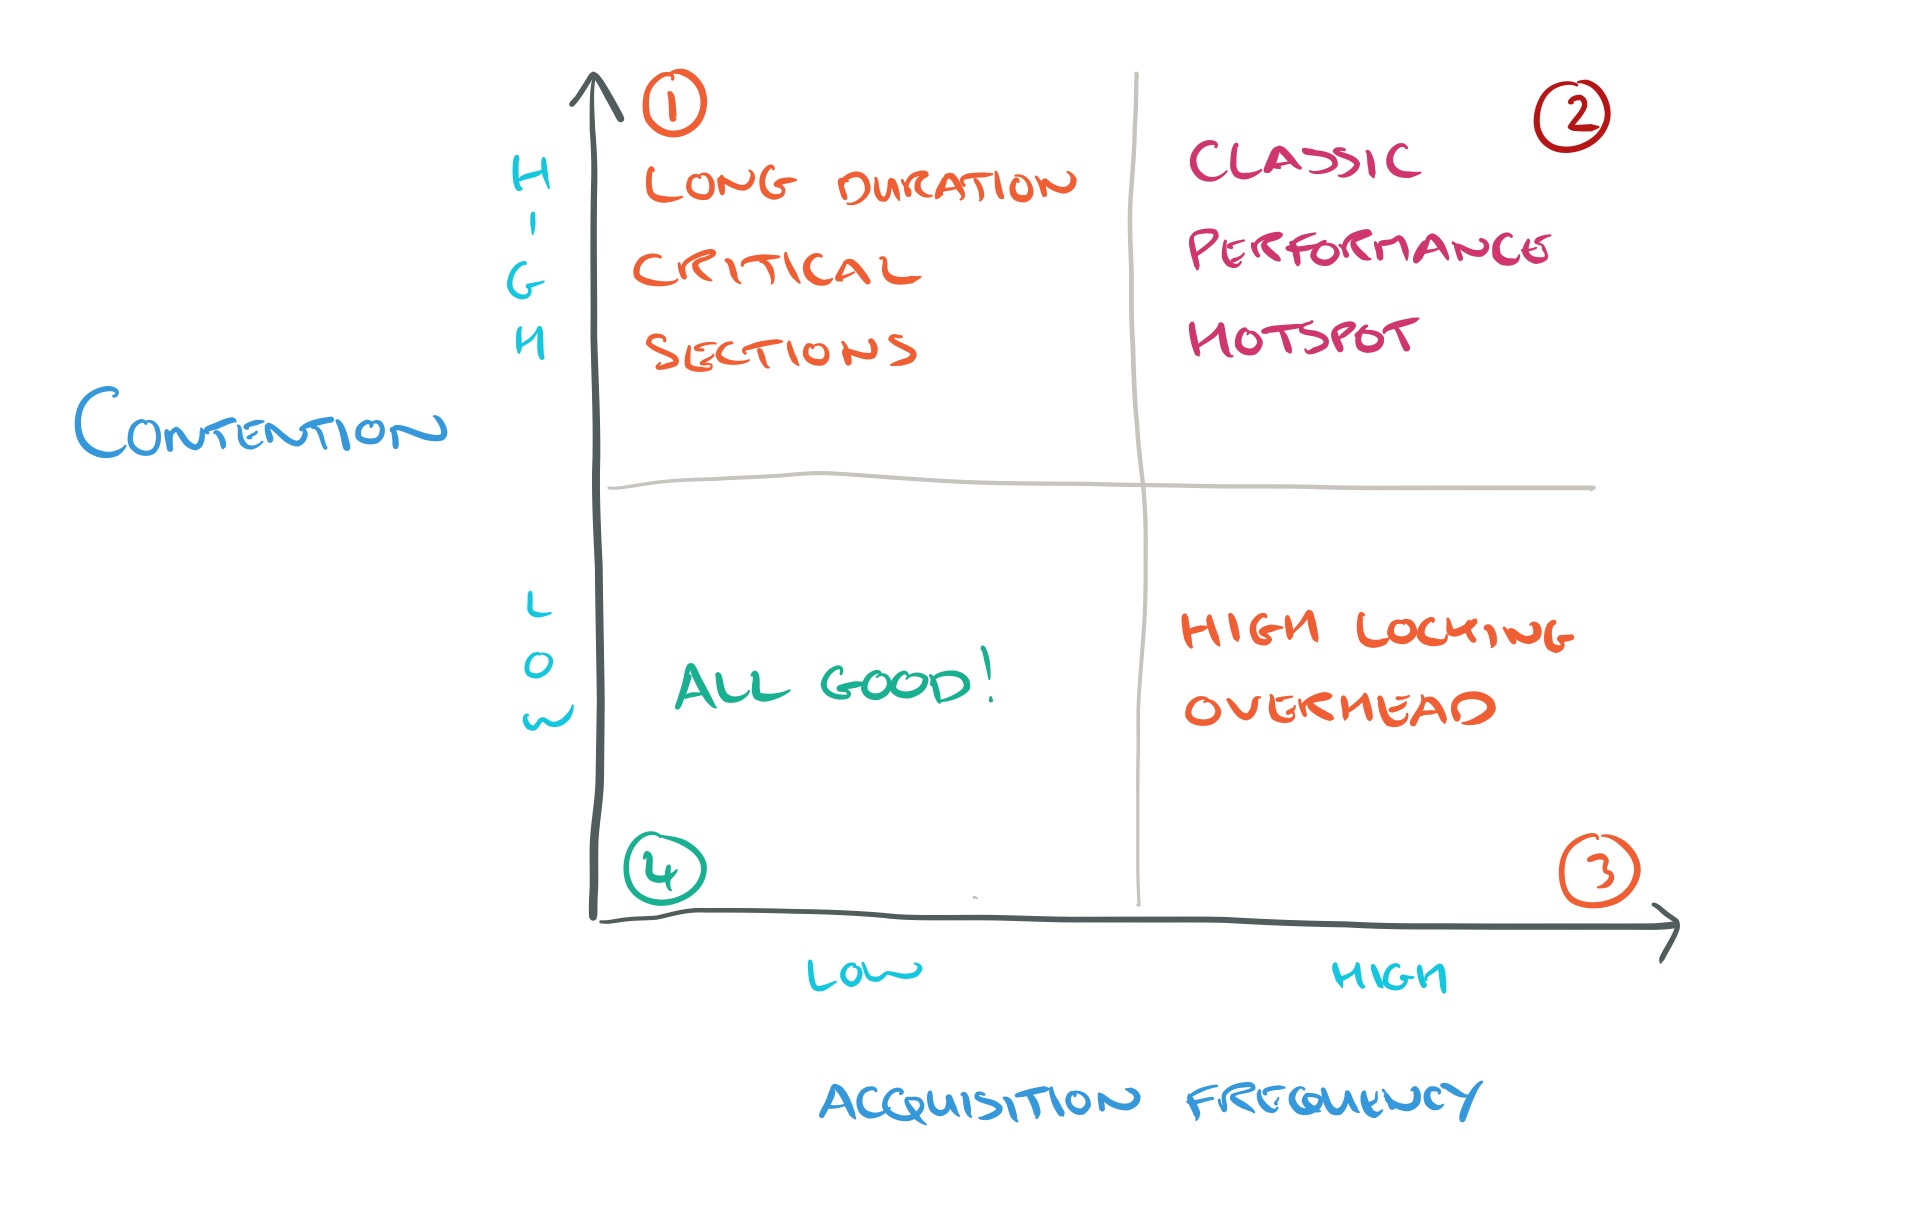
In quadrant one we find locks that are acquired relatively infrequently, but that are held for a long time when they are acquired. In quadrant four we find locks that are acquired excessively even though there is very low contention, leading to high locking overheads.
Of course it wouldn’t matter that prior work didn’t cover quadrants 1 and 4 if they turned out to be uninteresting. What we see in the evaluation though, is that these are fruitful quadrants for seeking out performance improvements.
Our second observation is that it is not always sufficient to identify root causes of a problem based on the behavior of a single synchronization.
For example, there may be a collection of locks protecting a data structure, and these need to be considered together.
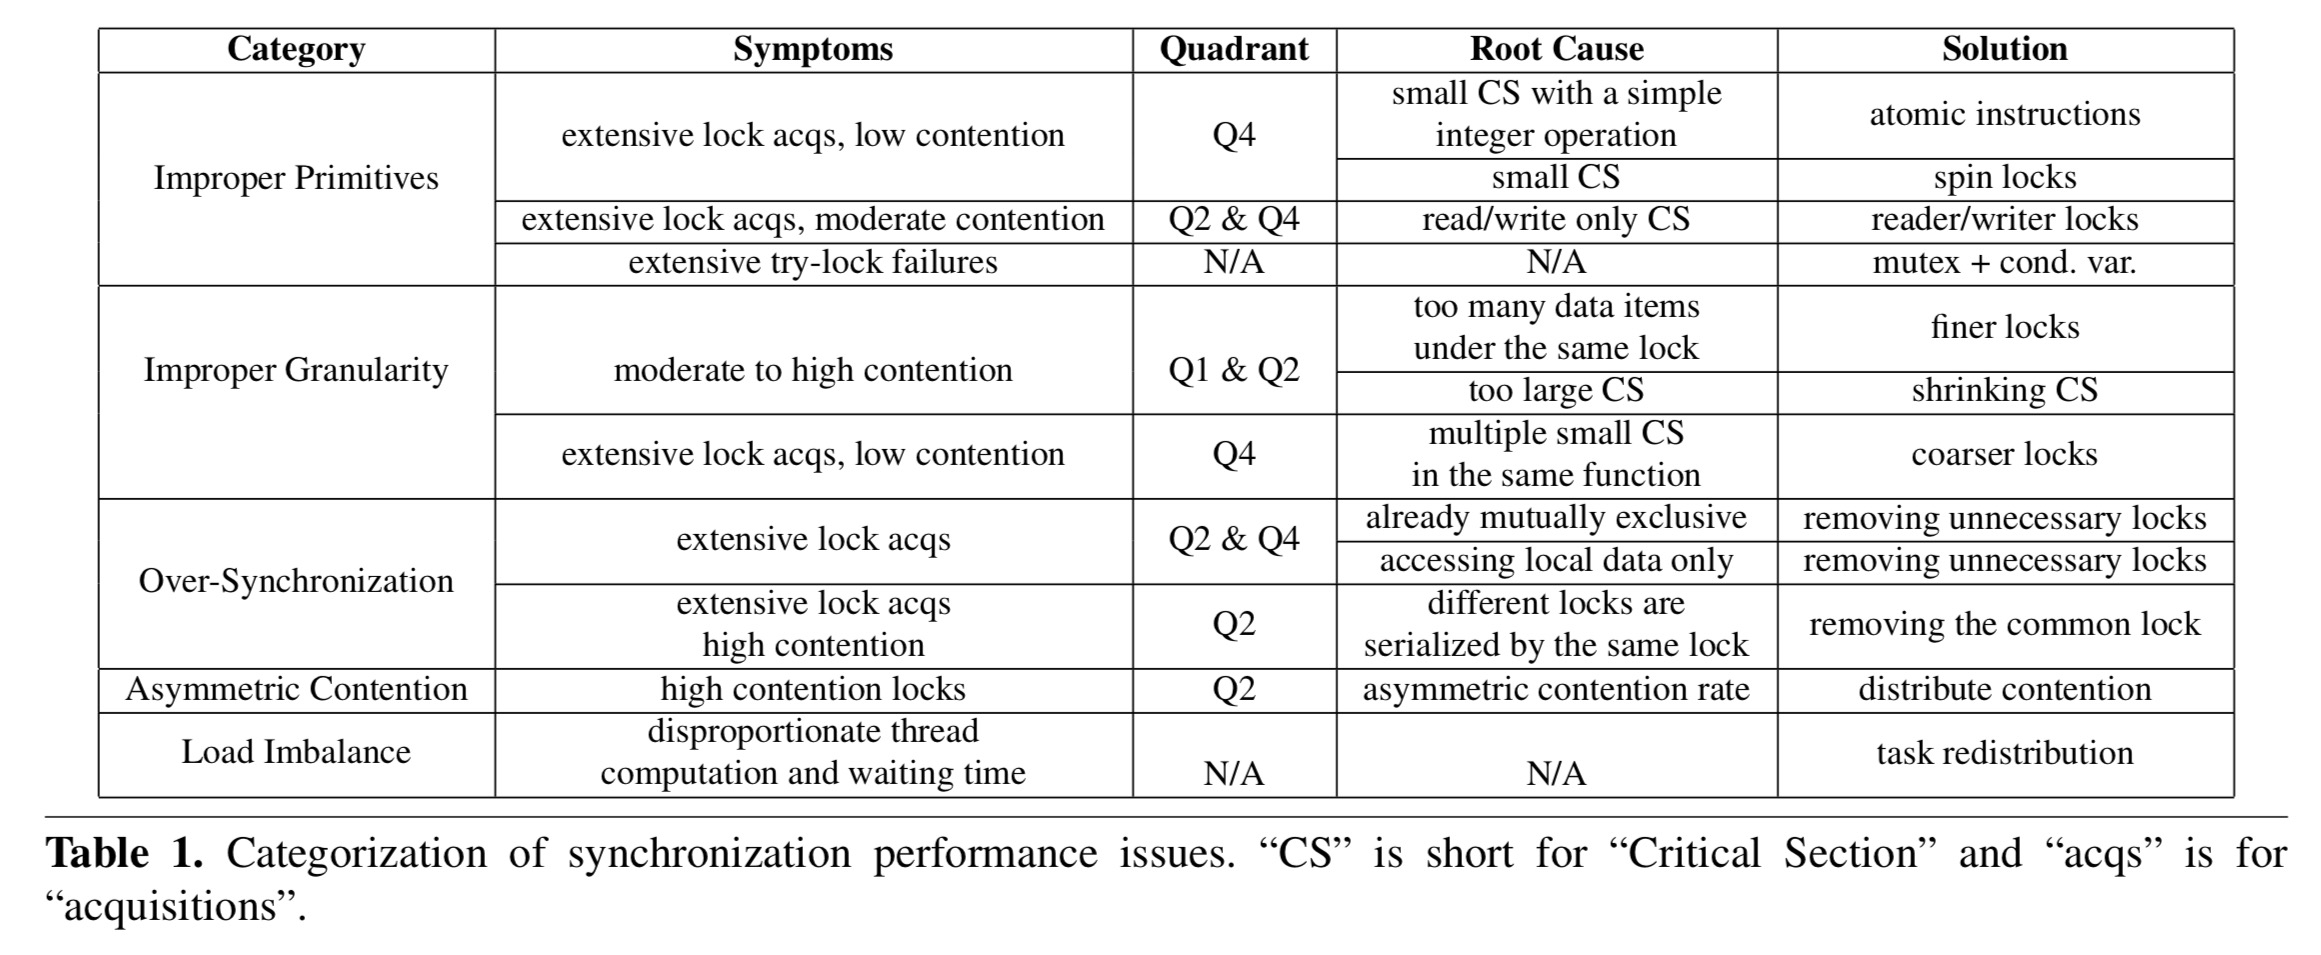
Let’s now look at the five classes of performance issues identified by the authors:
- Improper primitives. There are many different synchronisation primitives, with differing runtime overheads. Each mechanism suits a different use case, and deviation from the preferred use cases can result in performance issues.
-
Atomic instructions are best suited to perform simple integer operations on shared variables.
- Spin locks are effective for small critical sections that have very few instructions but cannot be finished using a single atomic instruction.
- Read/write locks are useful for read mostly critical sections
- Try-locks allow a program to pursue an alternative path when locks are not available
-
Mutex locks are used when the critical sections contain waiting operations and have multiple shared accesses.
-
Improper granularity. This could be a lock protecting too many data items (too coarse-grained), a lock protecting a large critical section with many instructions (too long a duration), or very frequent acquisition of very fine-grained locks leading to high locking overheads.
- Over-synchronisation. A situation where a synchronisation is actually unnecessary because the computations don’t need protection or are already protected by other synchronisations. For example, you don’t need a lock if a critical section only accesses local data, or if the protected computations are already atomic.
- Asymmetric contention. Consider a hash-table using locks at a bucket level. If the hash function doesn’t distribute accesses uniformly, then some buckets will be hot and have more contention than others. “Asymmetric contention occurs when some locks have significantly more contention than others that protect similar data.“
- Load imbalance. If one group of threads is found to have a waiting period much longer than other groups, it may indicate a performance issue caused by a load imbalance. (SyncPerf can do a neat thing here and recommend the optimal number of threads for each pool). An example makes this clearer:
ferretsearches images for similarity. ferret has four different stages that perform image segmentation, feature extraction, indexing, and ranking separately. By default, ferret creates the same number of threads for different stages. SyncPerf detects that different types of threads have a completely different waiting time, such as 4754ms, 5666ms, 4831ms, and 34ms respectively. This clearly indicates that some stages may not have enough threads and others may have too many threads. SyncPerf predicts the best assignment to be (1-0.2-2.5-12.2). Thus either (1-1-3-11) or (1-1-2-12) can be an optimal distribution. We experimented with all possible assignments and found the best assignment to be (1-1-3-11). Using the suggested task assignment (1-1-3-11) improves the performance of ferret by 42%.
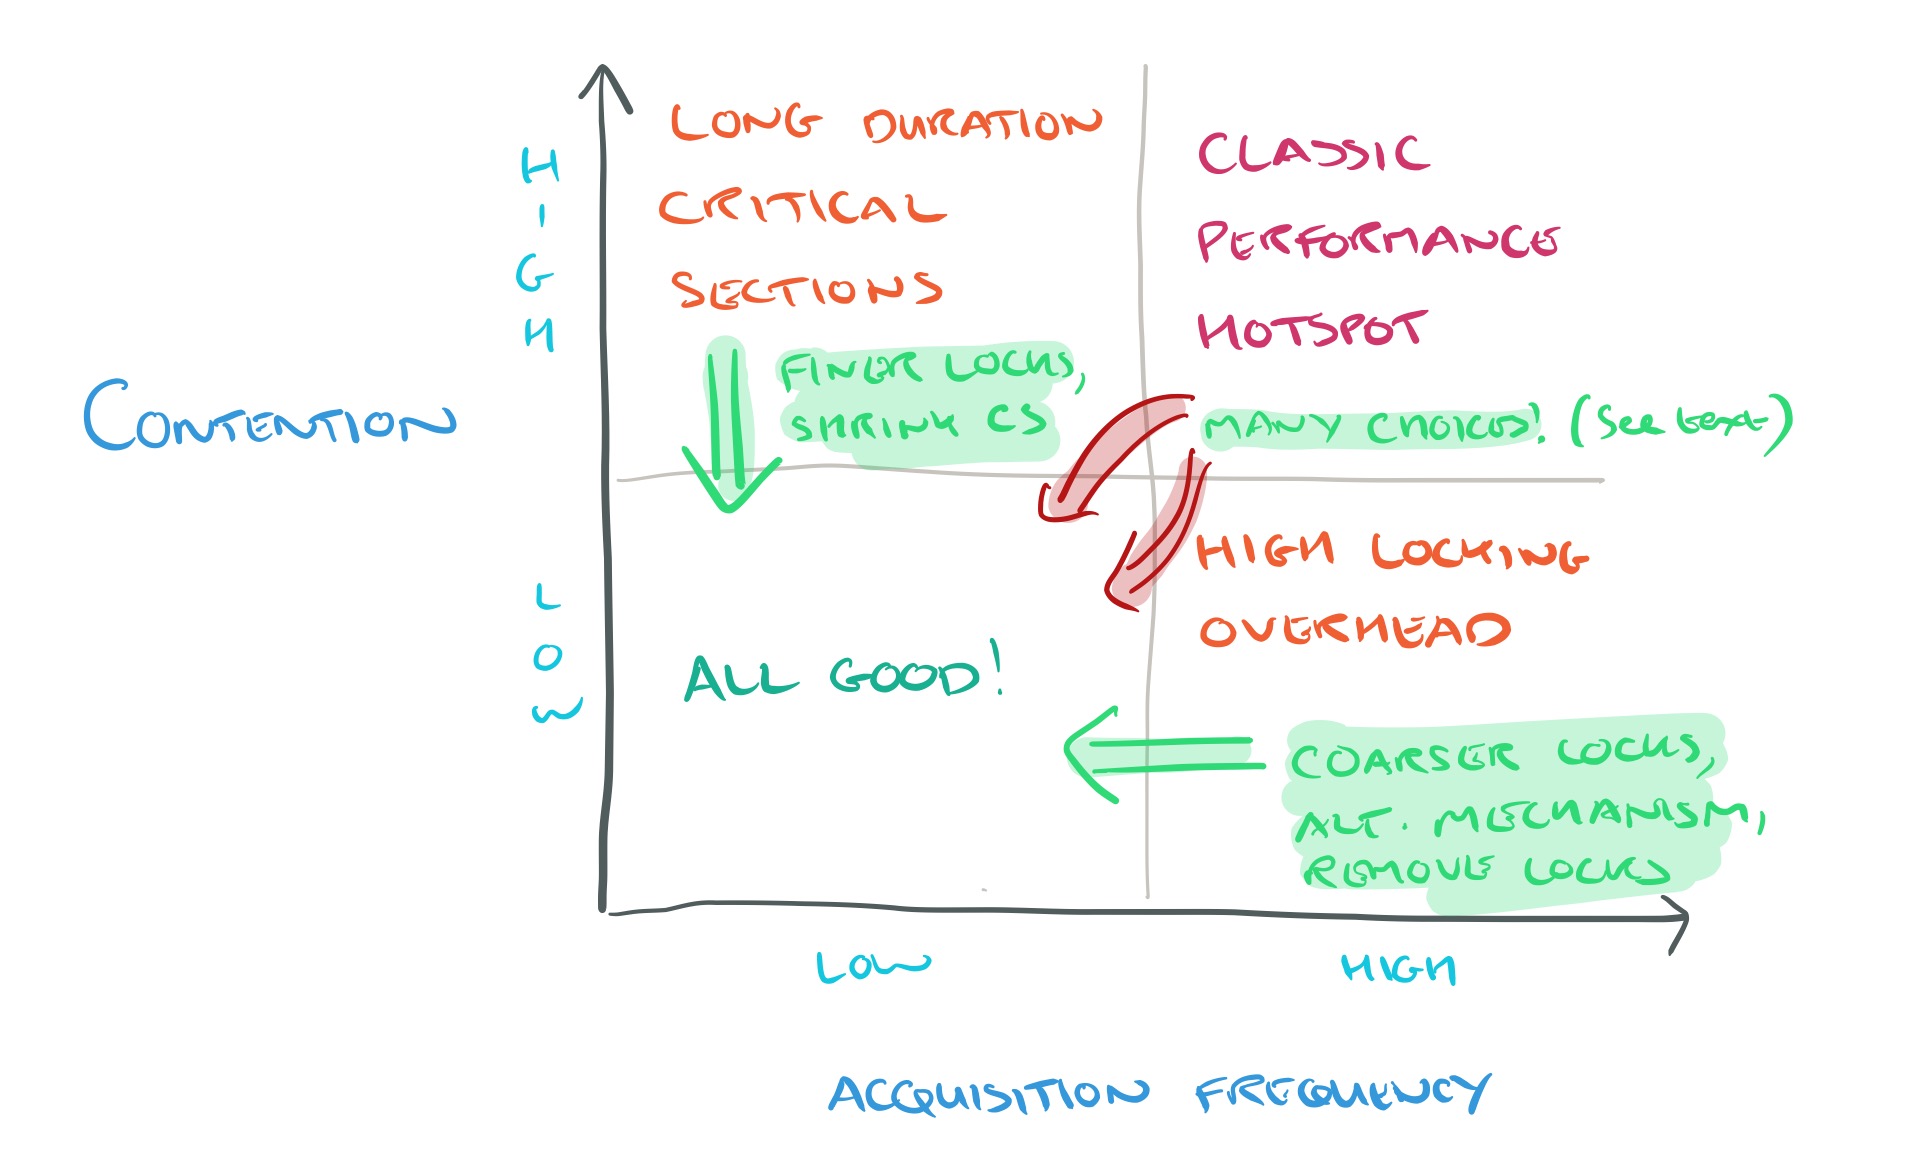
The following table summarises the different kinds of performance issues, and also suggests appropriate solutions:
If we overlay that on the quadrant diagram, we get something like this:
SyncPerf
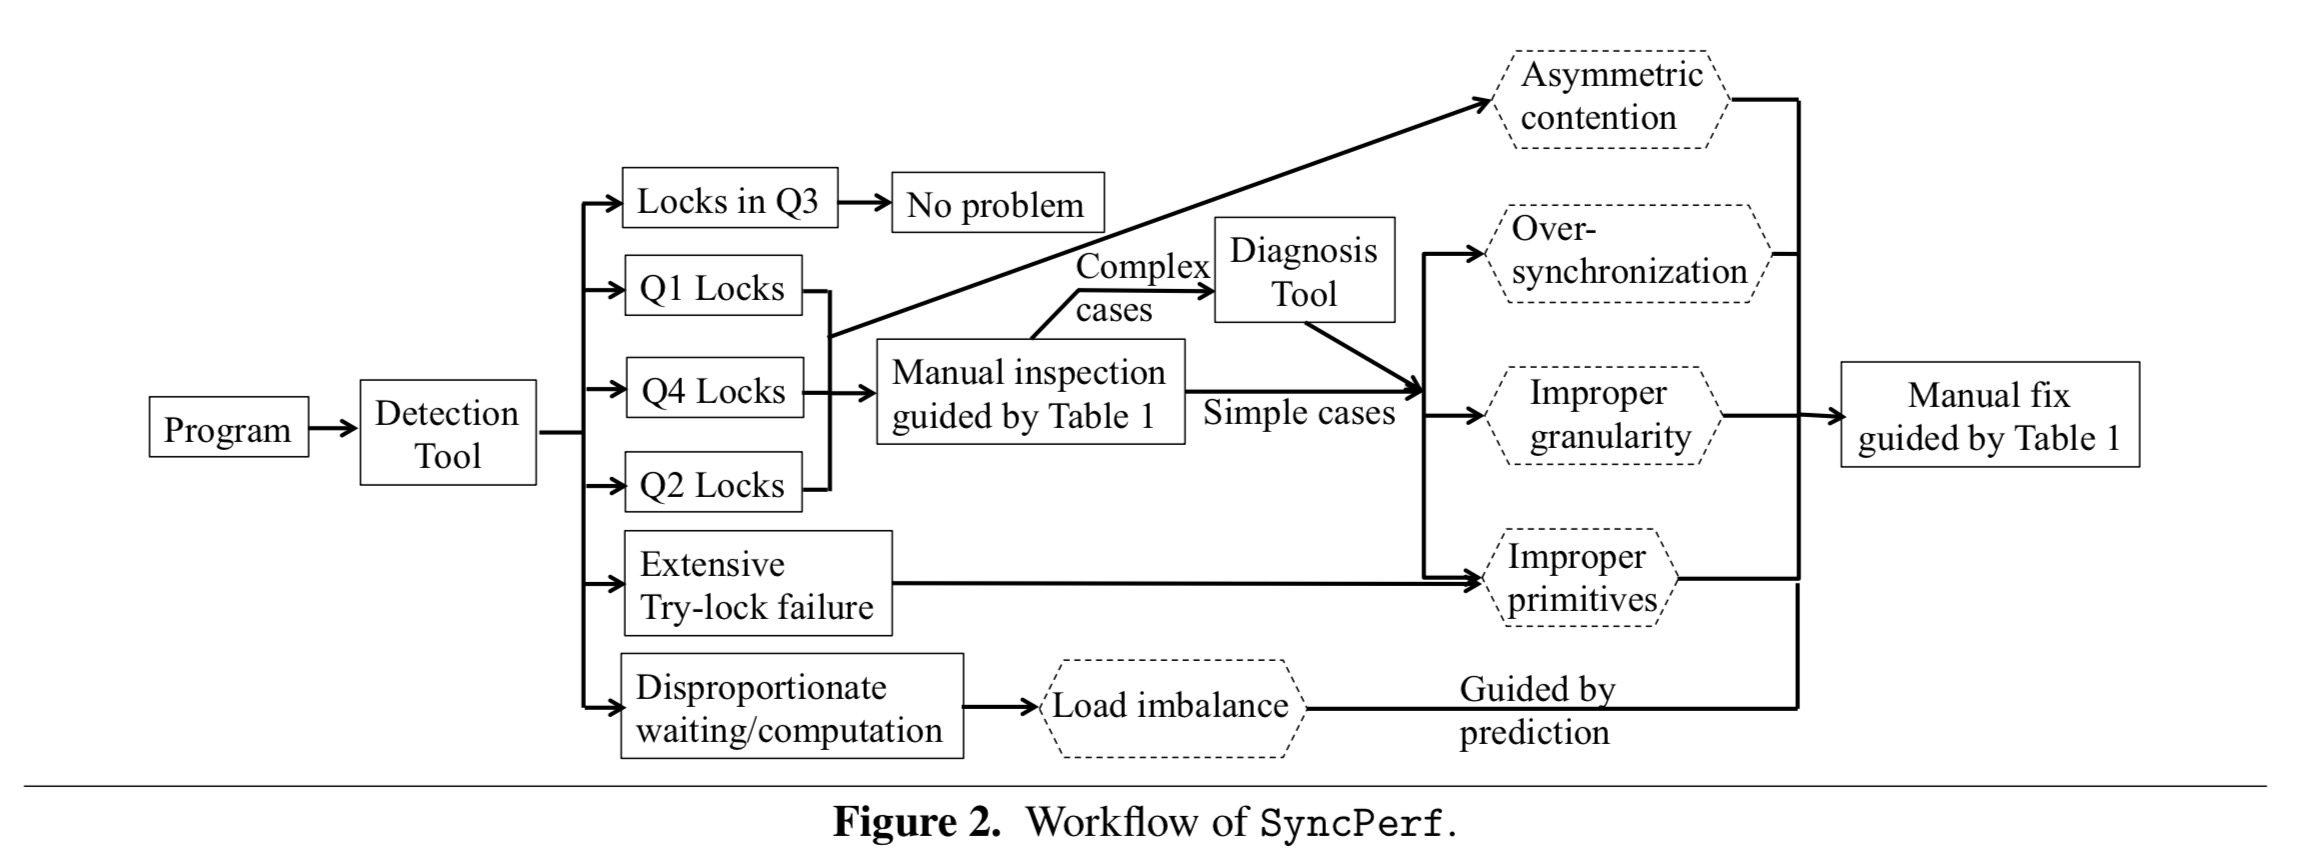
SyncPerf provides two tools to assist programmers in identifying bugs and fixing them: a detection tool and a diagnosis tool. By combining these two tools, SyncPerf not only answers “what” and “where” questions, but also “why” and “how to fix” (partially) questions for most synchronization related performance bugs.
SyncPerf takes your program, instruments it with very low overhead (see section 3.1 for details), and investigates locks inside quadrants 1, 2 and 4 as well as lack failure rates and load imbalances. Initial results are presented to the programmer, which may be sufficient to determine the appropriate solution (e.g., consult the table above). If more detail is needed, the diagnosis tool can be run.
I contacted the authors to see if there’s a version somewhere you can get your hands on, and I’m pleased to say that SyncPerf is now available at https://github.com/mejbah/SyncPerf. Many thanks to the team for making this available.
Finding performance bugs with SyncPerf
SyncPerf was evaluated on a 16 core machine using the PARSEC benchmark suite, as well at Apache, MySQL, and Memcached.
Here’s the bottom line:
SyncPerf is effective in detecting synchronization related performance bugs. The results are shown in Table 2 [below]. SyncPerf detected nine performance bugs in PARSEC and six performance bugs in real world applications. Among the 15 performance bugs, seven were previously undiscovered, including three in large real applications such as MySQL and memcached. We have notified programmers of all of these
new performance bugs. The MySQL-I bug does not exist
any more because the corresponding functions have been removed in a later version (MySQL-5.7). Remaining bugs are
still under review.
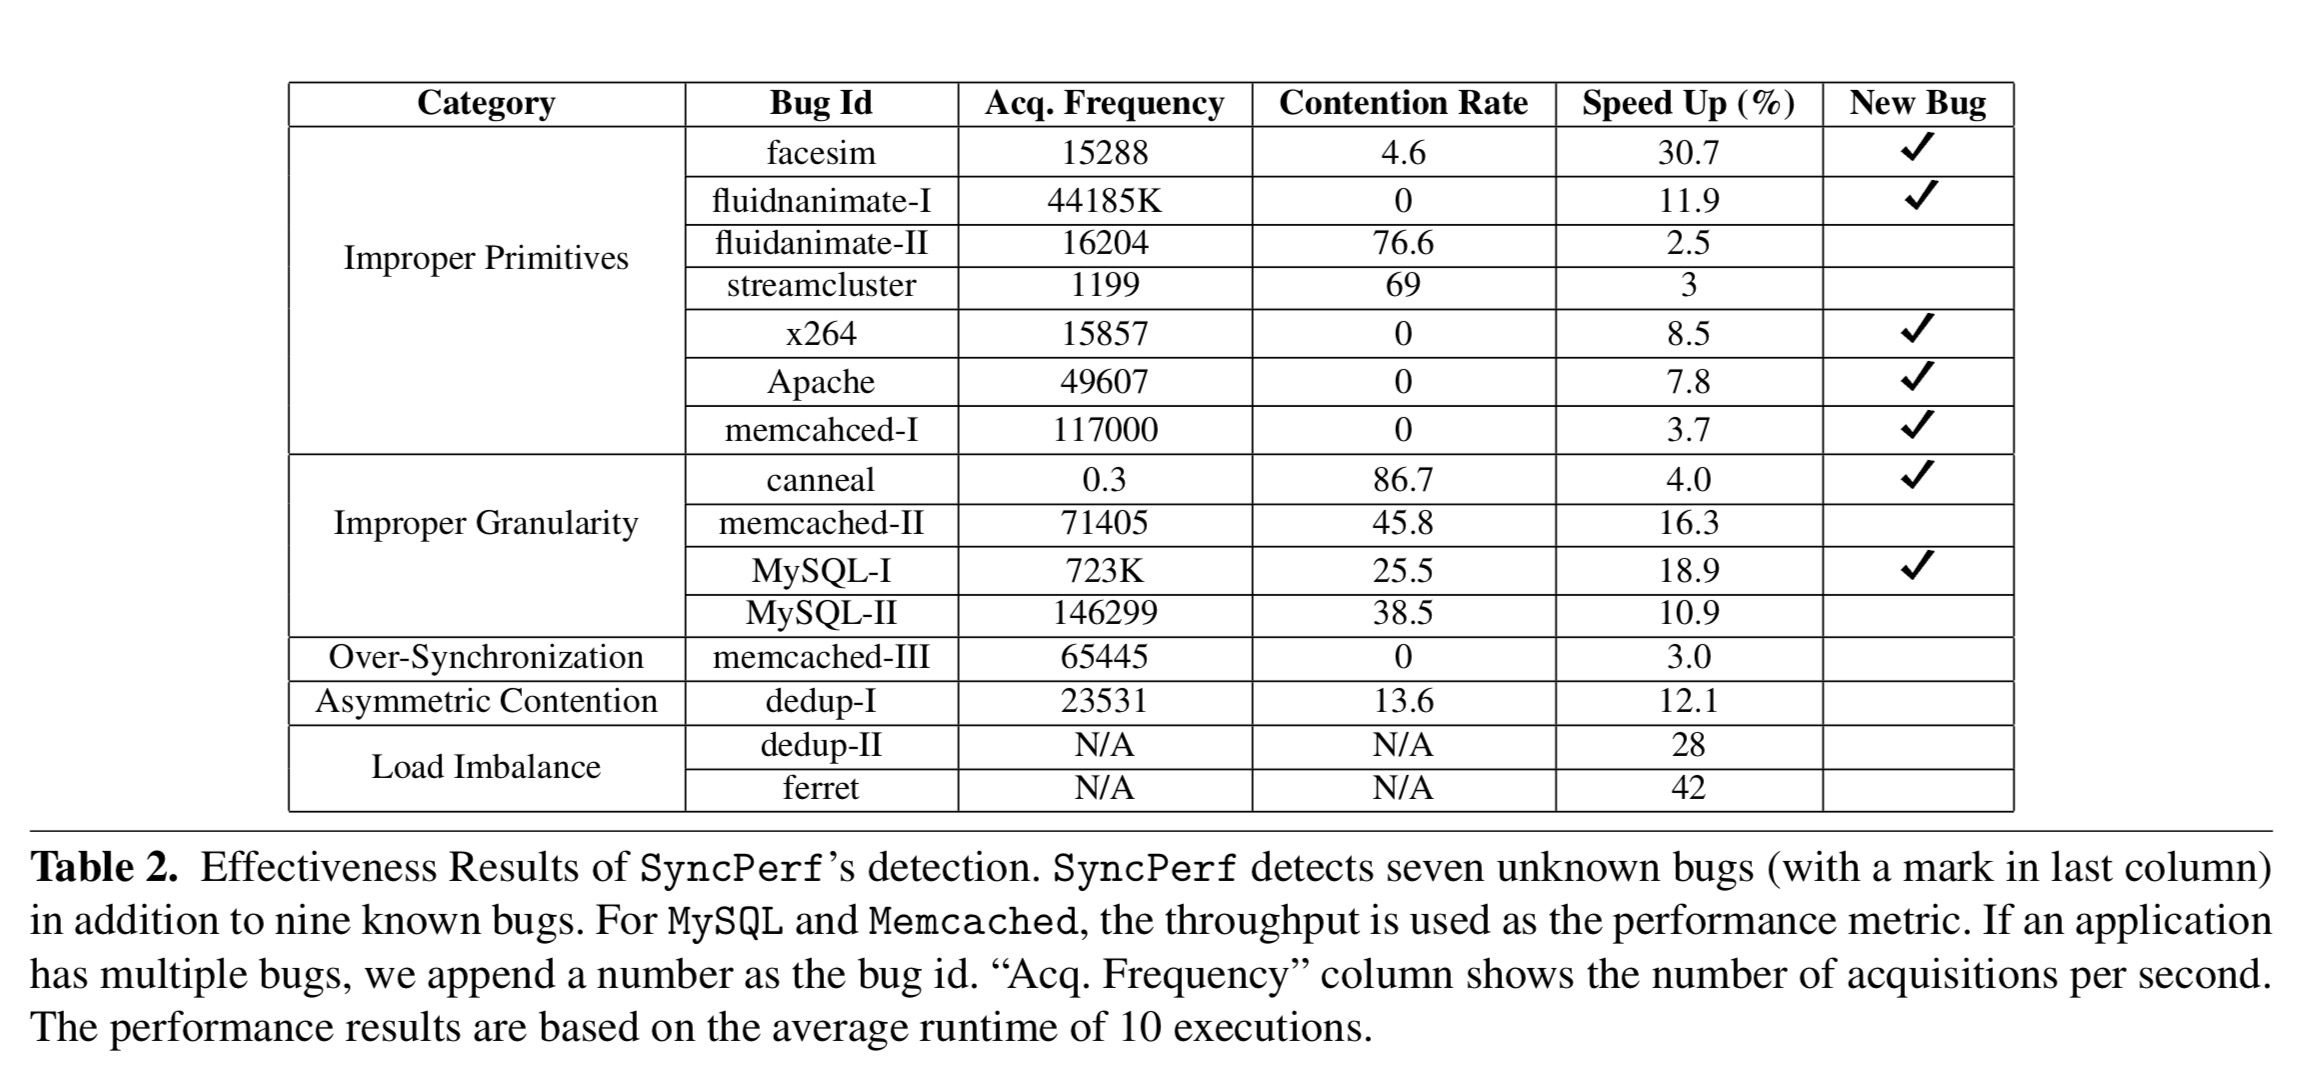
Five of the fifteen bugs fall into the previously unexplored fourth quadrant! For example, SyncPerf finds that the g_timer_skiplist_mtx mutex in Apache has a high acquisition frequency (49,607 per second) with almost 0% contention rate. Replacing pthread_mutex_lock with pthread_spinlock results in a 7.8% performance improvement!
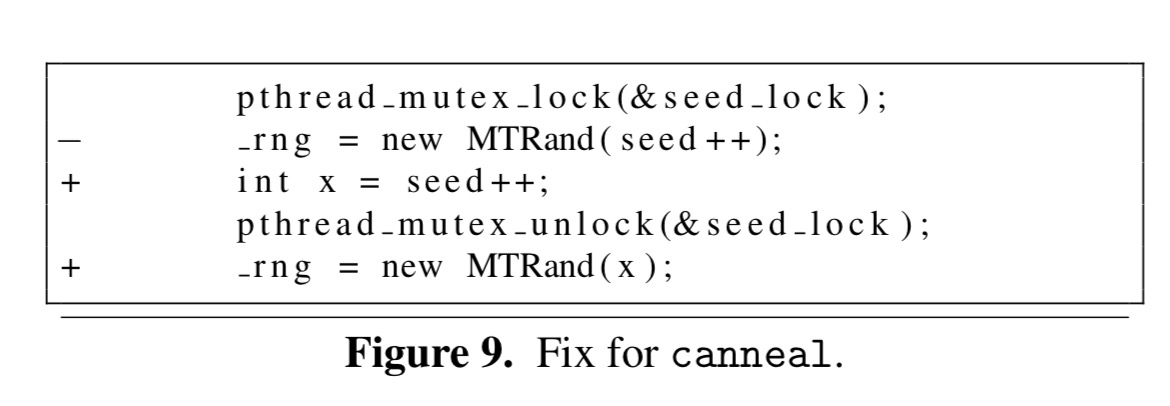
The canneal application provides an example of a quadrant two performance bug: seed_lock is acquired only 15 times, but the contention rate is around 86%. SyncPerf’s diagnosis tool showed that of 46,979 instructions inside the critical section, only 28 instructions access a shared variable. It turned out an entire random number generator routine was inside the critical section. Moving it outside, as per the patch below, resulted in a 4% performance improvement.
Section 4.4 of the paper contains discussions of several more of the performance bugs found by SyncPerf. It’s worth reading to gain a deeper appreciation of common problems and their solutions.
Love reading these as always. Just wanted to leave a note that in the first hand-drawn diagram the numbering of quadrants 3 and 4 is switched.
Good catch, thank you! The quadrant numbers in the text should follow the numbering in the ‘official’ figure. Thanks, A.