Who controls the Internet? Analyzing global threats using property traversal graphs Simeonovski et al., WWW’17
Who controls the Internet? How much influence do they have? And what would happen if one of those parties launched an attack or was compromised and used to launch an attack? Previous works have looked at the individual core services, but this paper focuses on their inter-dependencies along attack propagation paths.
An increasing number of reports and studies are showing that a limited number of players have an important influence on the overall security of the Internet infrastructure… we have a rather limited capability to assess the impact of attacks against, or performed by, core service providers.
What kind of attacks are we talking about? Three large-scale security incidents form the initial motivation:
- The Great Cannon DDoS Attack of March 16th 2015, a massive DDoS attack caused by malicious JavaScript code injected into TCP connections crossing Chinese network borders. The injected code aggressively requested resources from the DDoS targets.
- The PRISM program (2013), an NSA surveillance program with direct access to Internet communications and stored information. “While the direct involvement of popular tech providers is still unclear, in this paper we make the assumption that establishing the this type of collaboration is possible and can be voluntary, or coerced by authorities by means of law and court orders.”
- The DDoS attack against Dyn.com of October 21st 2016. The attack caused Dyn.com customers including Amazon, Netflix, Twitter, Reddit, and Spotify to experience outages on name resolution, affecting hundreds of millions of Internet users who could not access their services.
Four different attack vectors are analysed: email sniffing, redirection via malicious domain resolution, in-path content injection, and hosting malicious content.
Gathering information
The authors crawl the web starting from the top 100K Alexa domains, expanding to server and network information, and then adding in organisations and countries. This ultimately leads to a labeled graph containing 1.8M nodes, of which 350K are unique IP addresses. The nodes are connected by 4.7M relationships.
The following table shows labels (think node and edge types) in the graph:
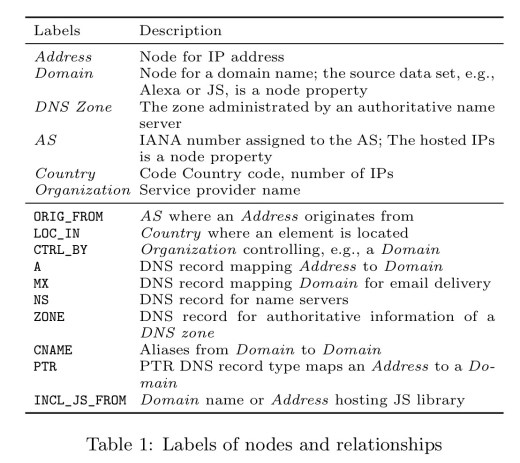
When considering the impact of an attack nodes can be marked at one of three different compromise levels: comprised, partially compromised, and non-compromised. Taint-style propagation rules can then be written which capture how attacks can spread through the network. For example, if a node n is compromised and there is an edge from n to m labeled as A (name lookup) then m is marked as compromised.
Identifying the most promising attack targets
Before assessing attacks, we use our model to select entities that can be either attack victims or the attackers. The selection criteria are based on metrics that reflect the popularity and the influence of entities.
The most promising attack targets (or viewed from another perspective, the entities with the most power over Internet infrastructure) are identified via six metrics.
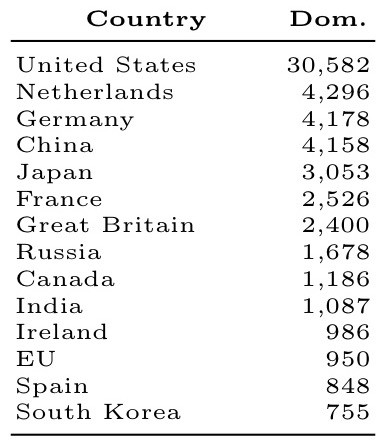
Who hosts the most Alexa domains?
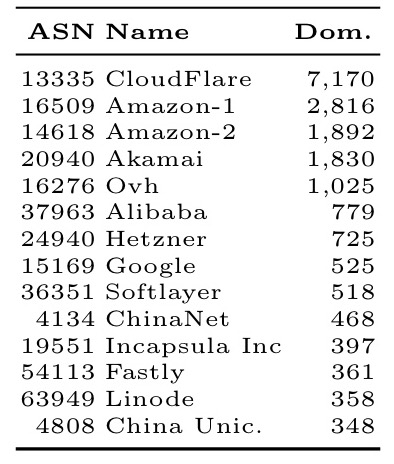
The analysis is done by country (giving a lens into the power of nation-state attackers), and also by ‘Autonomous Systems’ (AS) – a collection of IP networks and routers under the control of a given network operator.
Under this metric, these are the most powerful countries:
And these are the most powerful network operators:
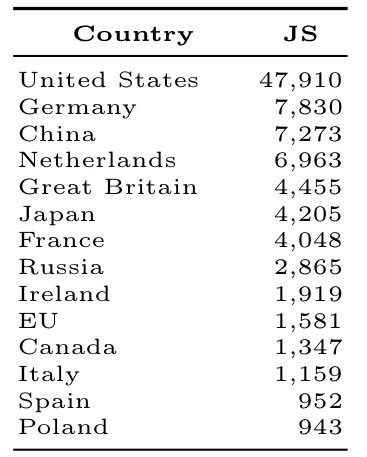
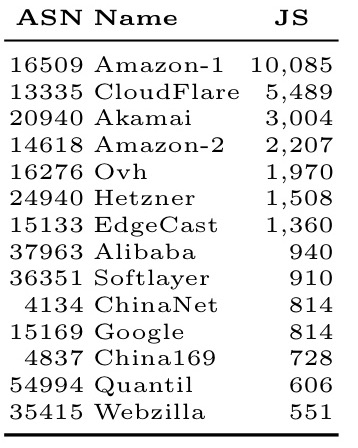
Who has the most JavaScript hosting servers?
By country:
And by network operator:
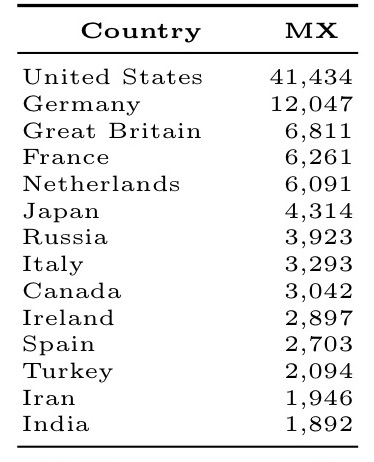
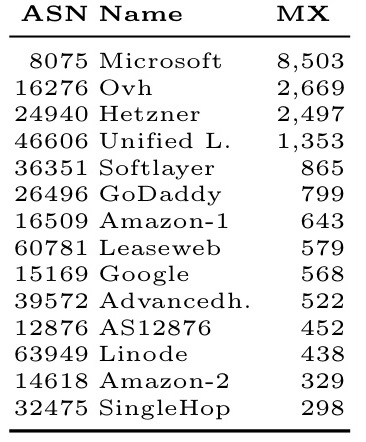
Who hosts the most email servers?
By country:
And by network operator:
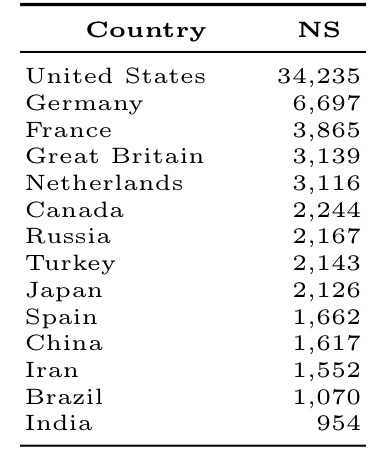
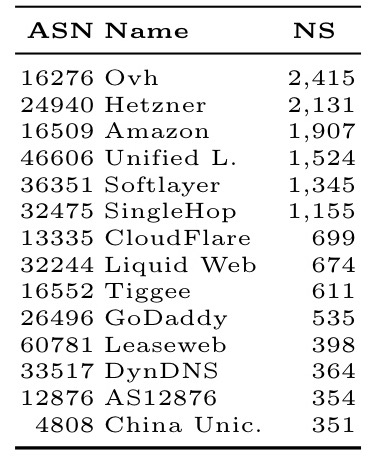
Who hosts the most name servers?
By country:
And by network operator:
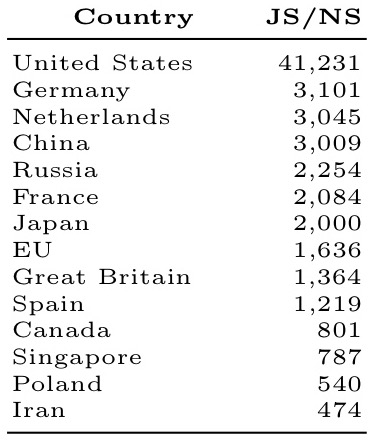
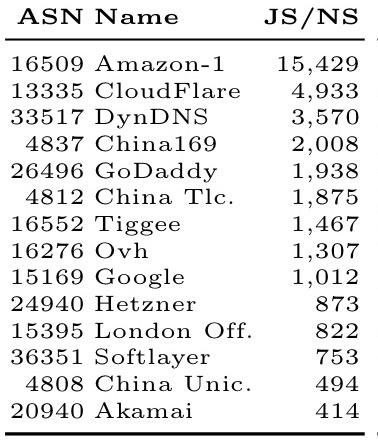
Who has the most power over JavaScript providers?
This metric measures the number of JS hosting servers whose authoritative name server is hosted in a given country or by a given network operator.
By country:
And by network operator:
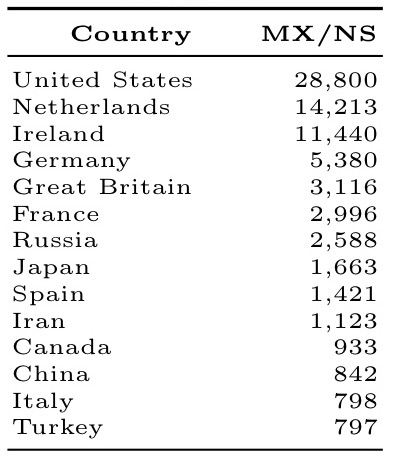
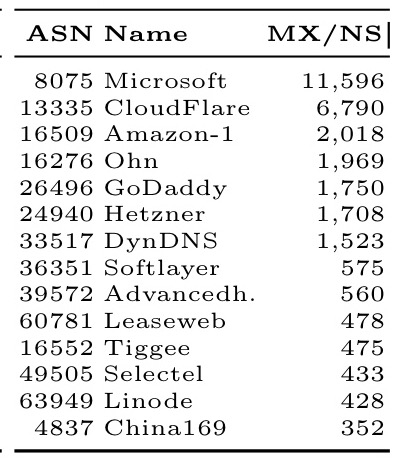
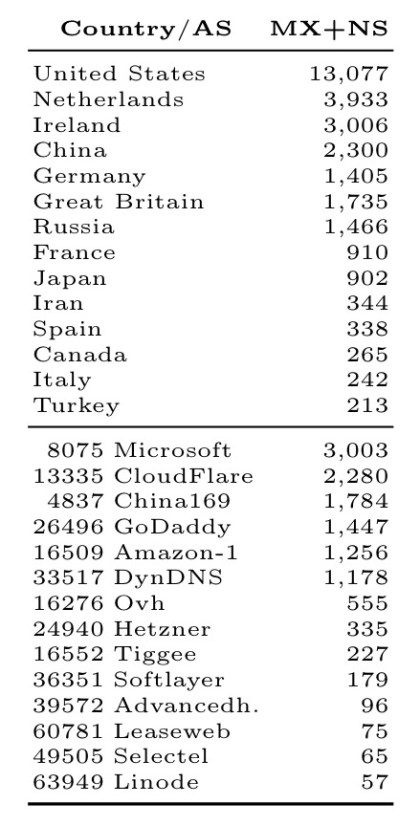
Who controls the most email server name servers?
The number of domains of email servers hosted by a given country or network operator.
By country:
And by network operator:
Evaluating the impact of potential attacks
Now we’re in a position to evaluate the potential impact of three different attacks: distribution of malicious JavaScript content, email sniffing, and a DDoS attack against a core service provider. In each case a target can be selected by consulting the tables above.
Distributing malicious JavaScript content
The authors consider three ways to do this: – directly compromising (or colluding with) web servers hosting JS code; injecting malicious JavaScript when JS libraries are accessed over unprotected connections (HTTP instead of HTTPS); and redirecting requests for JS content via compromised name resolution.
Here we see the number of Alexa domains that can be reached via the first two of these:
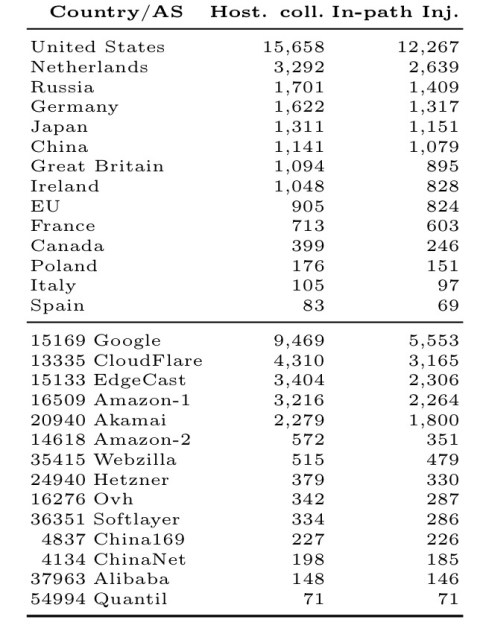
The attack results show that countries can be very powerful attackers. For example, the United States hosts 47K JS hosting providers, which could distributed malicious code to about 16% of the top 100K Alexa domains. However, ASes are also very powerful and affect a fraction of websites that is even larger than than of individual countries, and even groups of countries. For example, the AS of Google can affect about 9% of Alexa domains.
When we look at JS inclusion over unprotected connections, 1,079 of them cross the Chinese network borders, but the United States, the Netherlands, Russia, Germany, and Japan all have even greater influence.
In malicious name resolution redirection the authoritative name server of a domain hosting JS redirects users to a malicious server. The attack result is the number of websites including a resource hosted on a server whose name server is colluding or compromised.
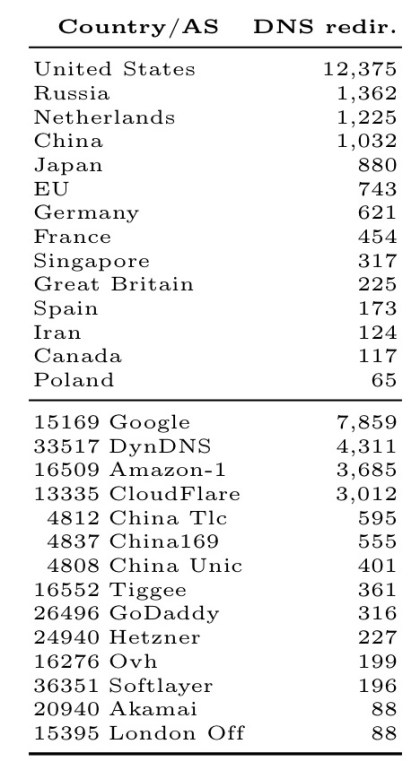
The United States, Google, and DynDNS stand out here.
Email sniffing
To acquire a large number of emails, an attacker can rely on various techniques. In this paper we consider two. The first one is by acquiring them directly from the email server. The second one is by redirecting an email client toward a malicious mail server, which will accept the email, keep a copy, and forward it to the intended recipient. This attack can be performed by a provider or by a country. Tables 3(c)and 3(d) show the attack results. All values are the number of Alexa domains that will be affected by this attack grouped by technique and attacker.
Email sniffing by a malicious email provider:
The United States alone can acquire emails for 25% of the most popular websites!
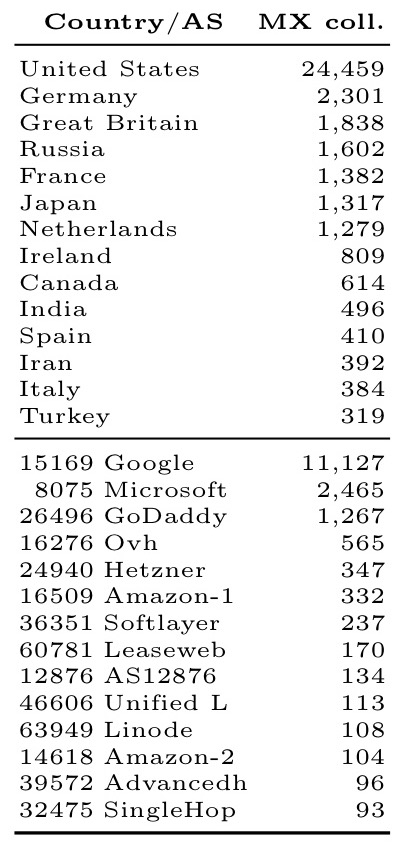
Malicious name resolution for email sniffing:
Note how Google has much less power in this attack vector – most websites that use Google’s email servers do so via name servers which are not hosted by Google.
DDoS against a core service provider
What happens if a service provider is the victim of an attack and is made unavailable? The data we already have can be used to figure this out. For example, consider the Dyn.com DoS attack from October 2016. DynDNS does not host a relevant number of mail servers and JS hosting providers, but it does host 364 domain servers.
These name servers are authoritative for 3,570 domains hosting JS that provide JS to 5,559 top 100K Alexa domains (not shown in Table 3), of which 4,331 are unprotected JS inclusion. Furthermore, the name servers hosted by DynDNS are authoritative for 1,523 domains running mail servers which are used by 1,178 top Alexa domains. If the Dyn.com DNS infrastructure is attacked, then a fraction that ranges from 1 to 5% of the top 100K Alexa domains would be affected.
So who controls the Internet?
Our results show that already just a few players may have an extensive power: 14 countries and 14 autonomous systems can, directly or indirectly, affect the security of about 23% of websites… In addition, our results show that little has been learned from past attacks. For example, 70% of JavaScript (JS) inclusion is still done over unprotected connections, i.e., via HTTP URLs, which can be used to mount the Great Cannon attack.

I’d be interested in grokking your dataset. Can it be made publicly available?
Hi Dustin, I don’t see any reference to dataset availability in the paper, but you might have some luck emailing the authors directly, e.g. simeonovski at cs.uni-saarland.de
Regards, Adrian.
Does an updated version of this exist?