Rex: preventing bugs and misconfiguration in large services using correlated change analysis, Mehta et al., NSDI’20
and
Check before you change: preventing correlated failures in service updates, Zhai et al., NSDI’20
Today’s post is a double header. I’ve chosen two papers from NSDI’20 that are both about correlation. Rex is a tool widely deployed across Microsoft that checks for correlations you don’t have but probably should have: it looks at files changed in commits and warns developers if files frequently changed with them have not been changed. CloudCanary on the other hand is about detecting correlations you do have, but probably don’t want: it looks for potential causes of correlated failures across a system, and can make targeted recommendations for improving your system reliability.
Improving system reliability through correlation
"If you change the foo setting, don’t forget that you also need to update all the clients…"
Large-scale services run on a foundation of very large codebases and configuration repositories. To run uninterrupted a service not only depends on correct code, but also on correct network and security configuration, and suitable deployment specification. This causes various dependencies both within and across components/sources of the service which emerge organically. When an engineer changes a certain region of code or configuration, these dependencies require them to make changes to other code or configuration regions…. Engineers, with no documentation or specification to go by, often miss making necessary changes to code or configuration files. This can delay deployment, increase security risks and, in some cases, even disrupt the service completely. Disruptions due to such correlations are surprisingly frequent.
Rex is aimed at eliminating these disruptions. Widely deployed at Microsoft, including the Office 365 and Azure teams, it caught 4,926 changes over a period of 14 months, some of which could have led to severe service disruption. "Rex has had significant impact in avoiding bad deployments, services outages, build breaks, and buggy commits."
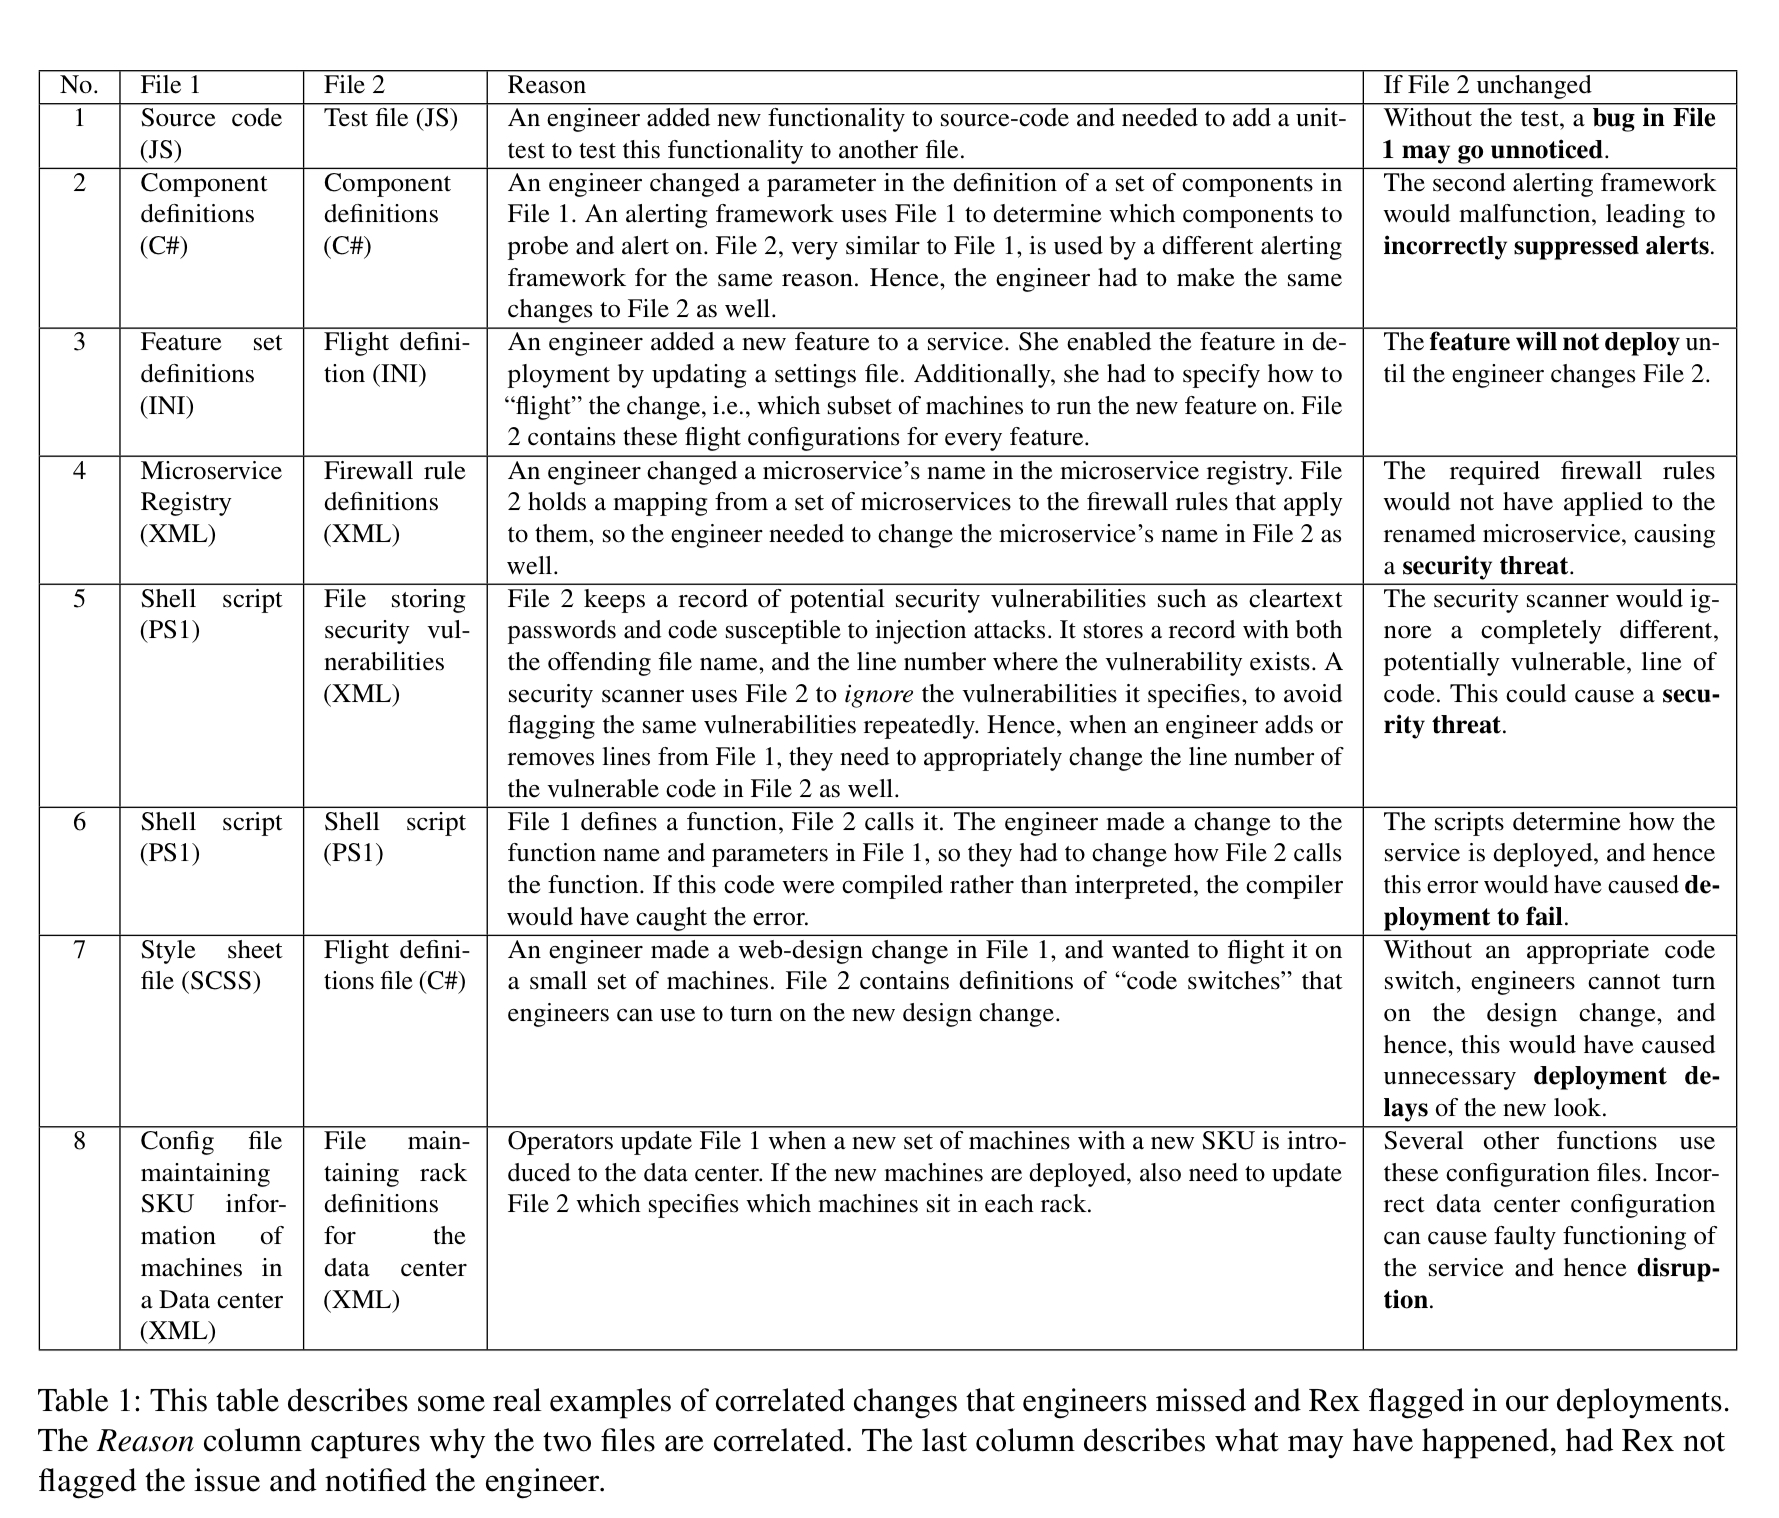
The following table highlights some examples of correlated change requirements to give a feel for the kind of things we’re talking about: everything from failing to update javascript tests through to coordinated changes of data center rack configuration files.
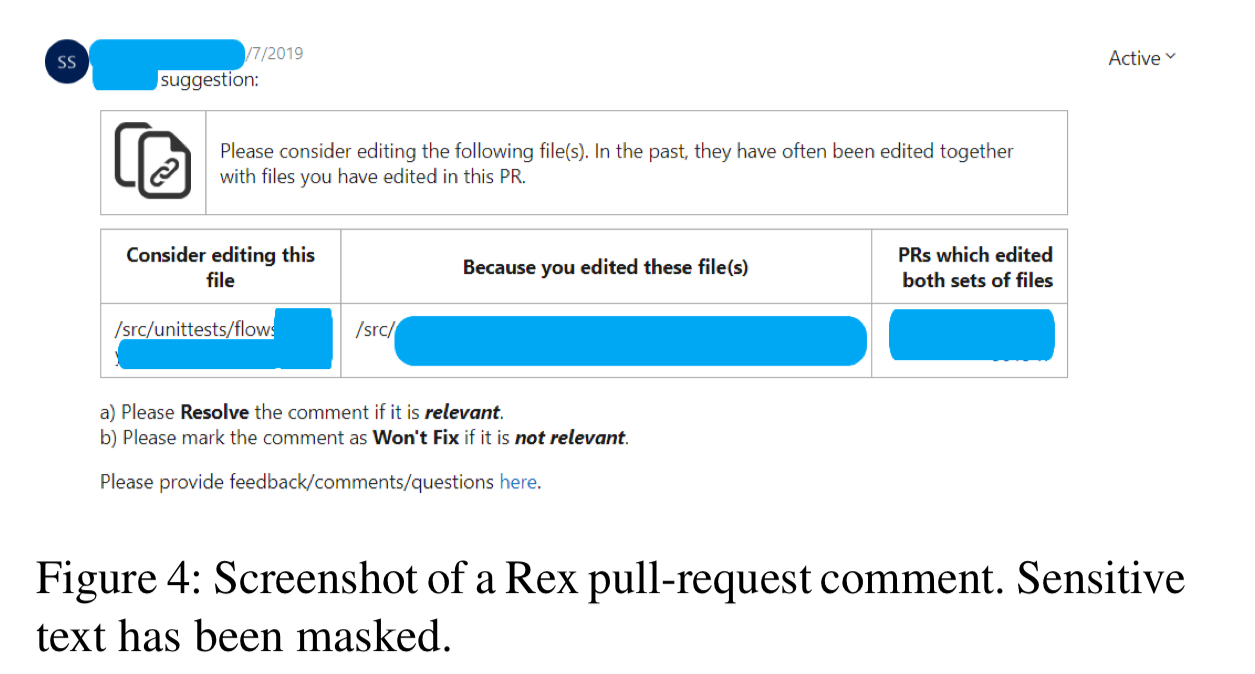
For developers’ Rex’s advisories appear as comments on pull-requests, alerting developers to potential correlated changes that might need to be investigated before merging.
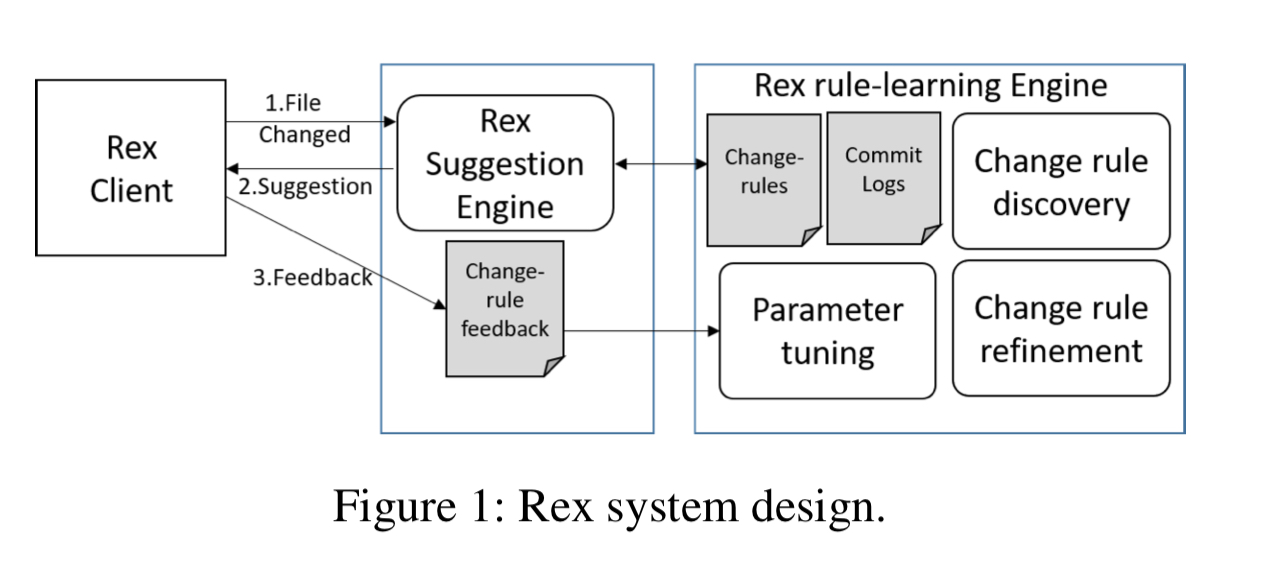
Rex works by mining commit logs to find correlated changes (at the file level). In the first stage, called change rule discovery Rex uses association mining over six months of commit log data: the FP-Growth algorithm is used to find frequent item-sets (sets of files that change together very often), and then these items sets are turned into change rules. Take a frequent item-set F, partioned into subsets X and Y. A rule suggesting the files in Y should be changed if all the files in X are changed is added if the confidence in the rule is above a threshold. Confidence is defined as the number of times all the files in F change together, divided by the number of times all the files in X change together.
The second stage refines the discovered change rules. First Rex looks at the changes introduced to files in X and creates the most specific generalisation of the differences as a regular expression (i.e., the most specific regular expression that captures all of the changes in the set). Then it guards change rules with a test that the difference is matched by the discovered regex.
The models for a given repository are fine-tuned on a daily basis. The actions of developers in response to Rex’s suggestions (i.e., whether or not the PR is modified to include changes to the suggested files) is used to determine whether a suggestion was a true- or false-positive.
Rex currently runs on 360 repositories, and its adoption is increasing rapidly… Rex has had significant impact in avoiding bad deployments, service outages, build breaks, and buggy commits.
Improving system reliability by removing correlations
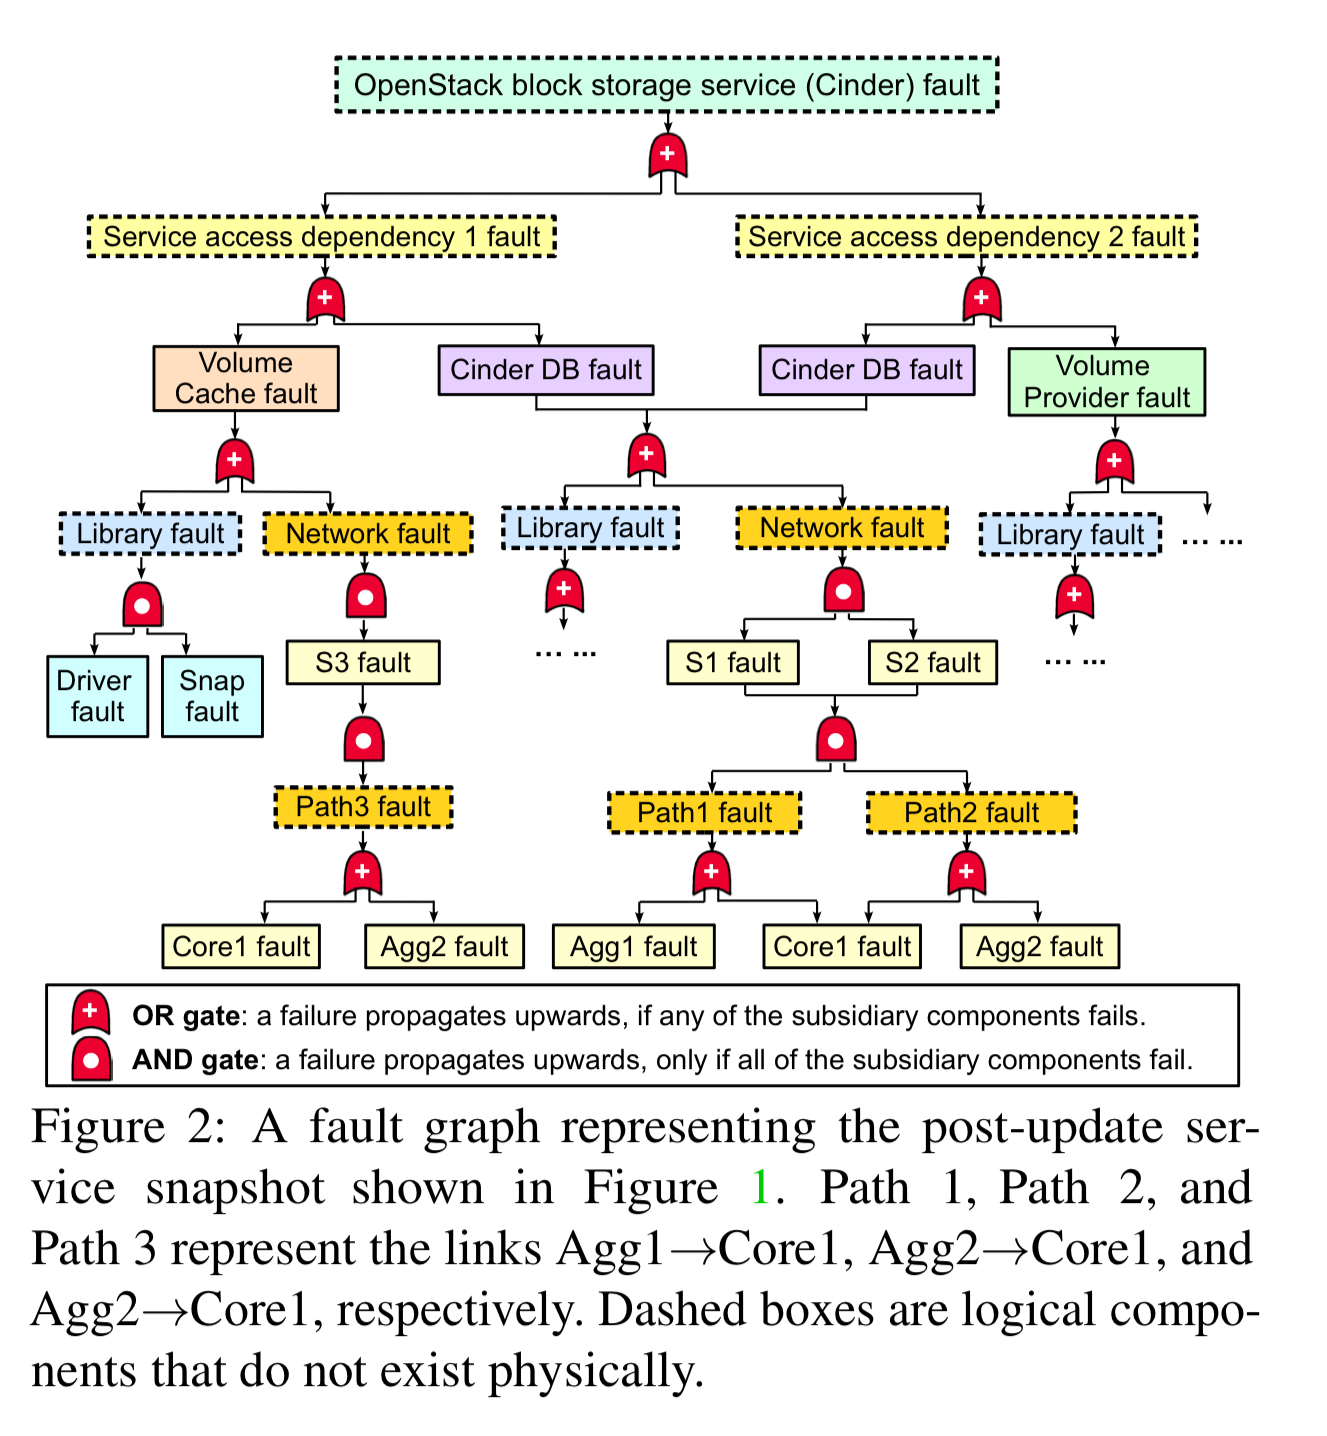
Fault-graphs model all of the structural dependencies between components in a system and can be used to identify weak links – i.e. points in the graph with larger blast radii.
A fault graph is a layered DAG representing the logical relationships between component faults within a given system… The root node in a fault graph represents a target service fault, which indicates the failure of the entire service. The rest of the nodes are intermediate faults, which describe how basic faults may cause larger service disruptions.
Prior to CloudCanary, the state-of-the-art for fault graphs was one-shot service audits: discovering and analysing fault-graphs was too intensive a process to be used for real-time audits during operation. CloudCanary contains two key components:
- SnapAudit uses an incremental auditing algorithm that identifies differential fault graphs capturing the delta between the before and after state of the service following an update. To speed up analysis, SnapAudit then turns a differential fault graph into a boolean formula and uses a a high performance MinCostSAT solver. The goal of the analysis is to extract minimal risk groups. A risk group is a set of components such that if they all failed the service will fail. A minimal risk group is one that ceases to be a risk group if any one component is removed from it.
The top-k risk groups of a given fault graph G are a ranked list of minimal risk groups by size or failure probability. Extracting minimal risk groups in a fault graph is NP-hard.
- DepBooster allows an operation to specify a reliability goals, and then generates a set of improvement plans to enable the system to meet that goal. Reliability goals can be specified as combination of risk group size goals (e.g., no minimal risk group should contain less than 3 items), and failure probability goals. If the specified goals are not currently satisfied by the system, then DepBooster generates improvement plans consisting of move and add replica actions.
Our results show that SnapAudit can identify correlated failure root causes in a 1,183,360 component service within 8 minutes, 200x faster than the state-of-the-art systems, and the DepBooster can find high-quality improvement plans within minutes.
The evaluation of CloudCanary includes an analysis of a ‘real-world update trace collected from a major service provider.’ The trace contains over 300 updates ranging from software updates to microservices to changes to power sources and network switches. It makes a compelling case for the deployment of this kind of real-time analysis:
- CloudCanary found 50+ risk groups in the microservice updates, and the operator confirmed that 96% of these could lead to correlated failures.
- CloudCanary found 10+ risk groups in power sources. The operators confirmed that all of them could lead to correlated failures, and 30% of them had actually led to service downtime in the past.
- CloudCanary found 30+ network risk groups, including ToR/aggregation switches, and shared fiber. All of these were confirmed by the operators.
The fault graphs and risk groups that CloudCanary finds are another great tool in your resilience engineering toolbox, and a great compliment to chaos engineering techniques.

One thought on “When correlation (or lack of it) can be causation”
Comments are closed.