Characterizing, modeling, and benchmarking RocksDB key-value workloads at Facebook, Cao et al., FAST’20
You get good at what you practice. Or in the case of key-value stores, what you benchmark. So if you want to design a system that will offer good real-world performance, it’s really useful to have benchmarks that accurately represent real-world workloads. In this paper, Facebook analyse three of their real-world RocksDB workloads and find (surprise!) that they all look quite different. More interesting, is that there are important differences between the way these real-world workloads behave, and workloads generated by the venerable YCSB benchmark.
Therefore, using the benchmarking results of YCSB as guidance for production might cause some misleading results… To address this issue, we propose a key-range based modelling and develop a benchmark that can better emulate the workloads of real-world key-value stores. This benchmark can synthetically generate more precise key-value queries that represent the reads and writes of key-value stores to the underlying storage system.
The tracing, replay, and analysis tools developed for this work are released in open source as part of the latest RocksDB release, and the new benchmark is now part of the db_bench benchmarking tool.
TL;DR: YCSB workload generation doesn’t take into account the distribution of hot key locations within the key space. That matters if your store reads data in (multi-key) blocks. Modeling the key range distribution for hot keys produces more realistic synthetic workloads.
RocksDB essentials
RocksDB is a key-value (KV) store derived from LevelDB by Facebook and optimised for SSDs. It’s used by Facebook, Alibaba, Yahoo, LinkedIn, and more. It has the usual get, put, and delete operations, as well as an Iterator operation for scanning a range of consecutive K-V pairs from a given start key, a DeleteRange operation to delete a range of keys, and a Merge operation for read-modify-writes. Merge stores write deltas in RocksDB, and these deltas can be stacked or combined. Getting a key requires combining all previously stored deltas using a user-provided combine function.
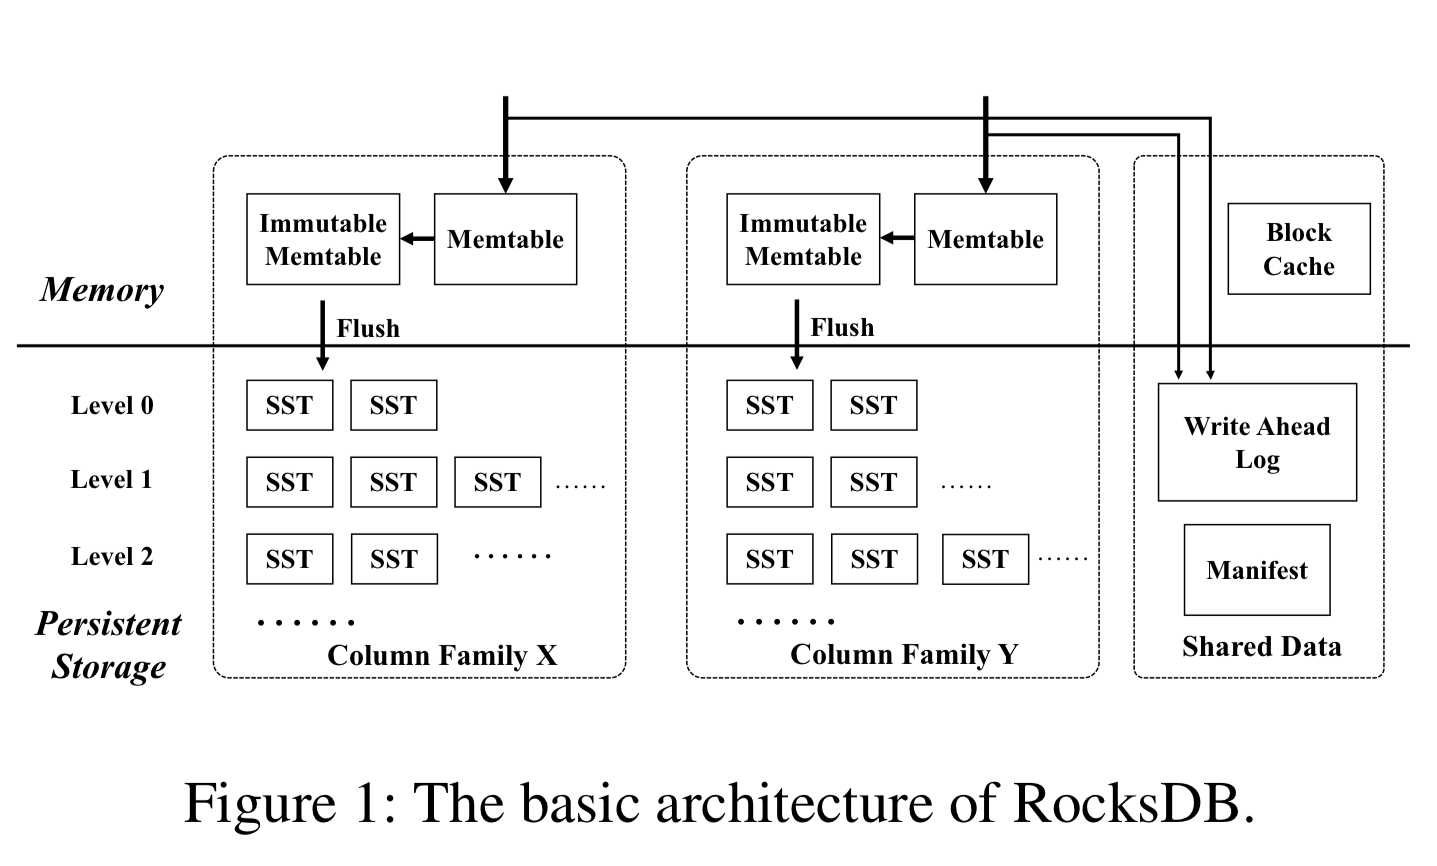
Internally RocksDB uses a Log-Structured Merge Tree to maintain KV-pairs. ColumnFamilies have their own in-memory write buffer which is flushed to the file system when full and stored as a _Sorted Sequence Table (SST) file. There are multiple levels of SST files, with downward merges when one level reaches its capacity limit.
Three workloads
The paper examines three different uses of RocksDB at Facebook:
- UDB, the underlying storage engine for the MySQL databases storing the social graph data. All cache read misses and all writes go through UDB servers, with SQL queries being converted into RocksDB queries. For one representative UDB server, about 10.2 billion queries were handled in a 14-day period. Gets and Puts dominate the workload.
- ZippyDB, a distributed KV-store using RocksDB for storage nodes, used to store metadata for photos and other objects in object storage. Upper layer queries in ZippyDB are mapped directly to RocksDB. It’s a read-intensive workload handling about 420 million queries a day on a representative node.
- UP2X is a distributed key-value store built to support counters and other statistics (e.g. user activity counts) used in AI/ML prediction and inferencing. UP2X makes heavy use of the Merge operation for updates. It handled about 111 million queries a day on a representative node, dominated by Merge.
Under the microscope
Given how different these use cases are, it’s not suprising that they stress RocksDB in different ways. The authors compare the workloads along the following dimensions:
- Query mix (e.g. gets vs puts vs merges vs iterators…)
- Query volume (qps)
- The sizes of keys and their values
- The key access frequency distribution (hot keys)
- The key-range distribution of hot keys
The most interesting of these turns out to be the key-range distribution for hot keys. Let’s zip through the other dimensions first and then we can come back to that.
Query mix
Get is the most frequently used query type for UDB and ZippyDB, with Merge dominating UP2X queries (over 90%). Within the same application, the query mix can vary by column family.
Query volume
Per server, per day, an average of just over 700M queries for UDB, 420 million for ZippyDB, and 111 million for UP2X. Some column families in UDB show strong diurnal patterns, whereas the access patterns for ZippyDB and UP2X show only slight variations.
Key and value sizes
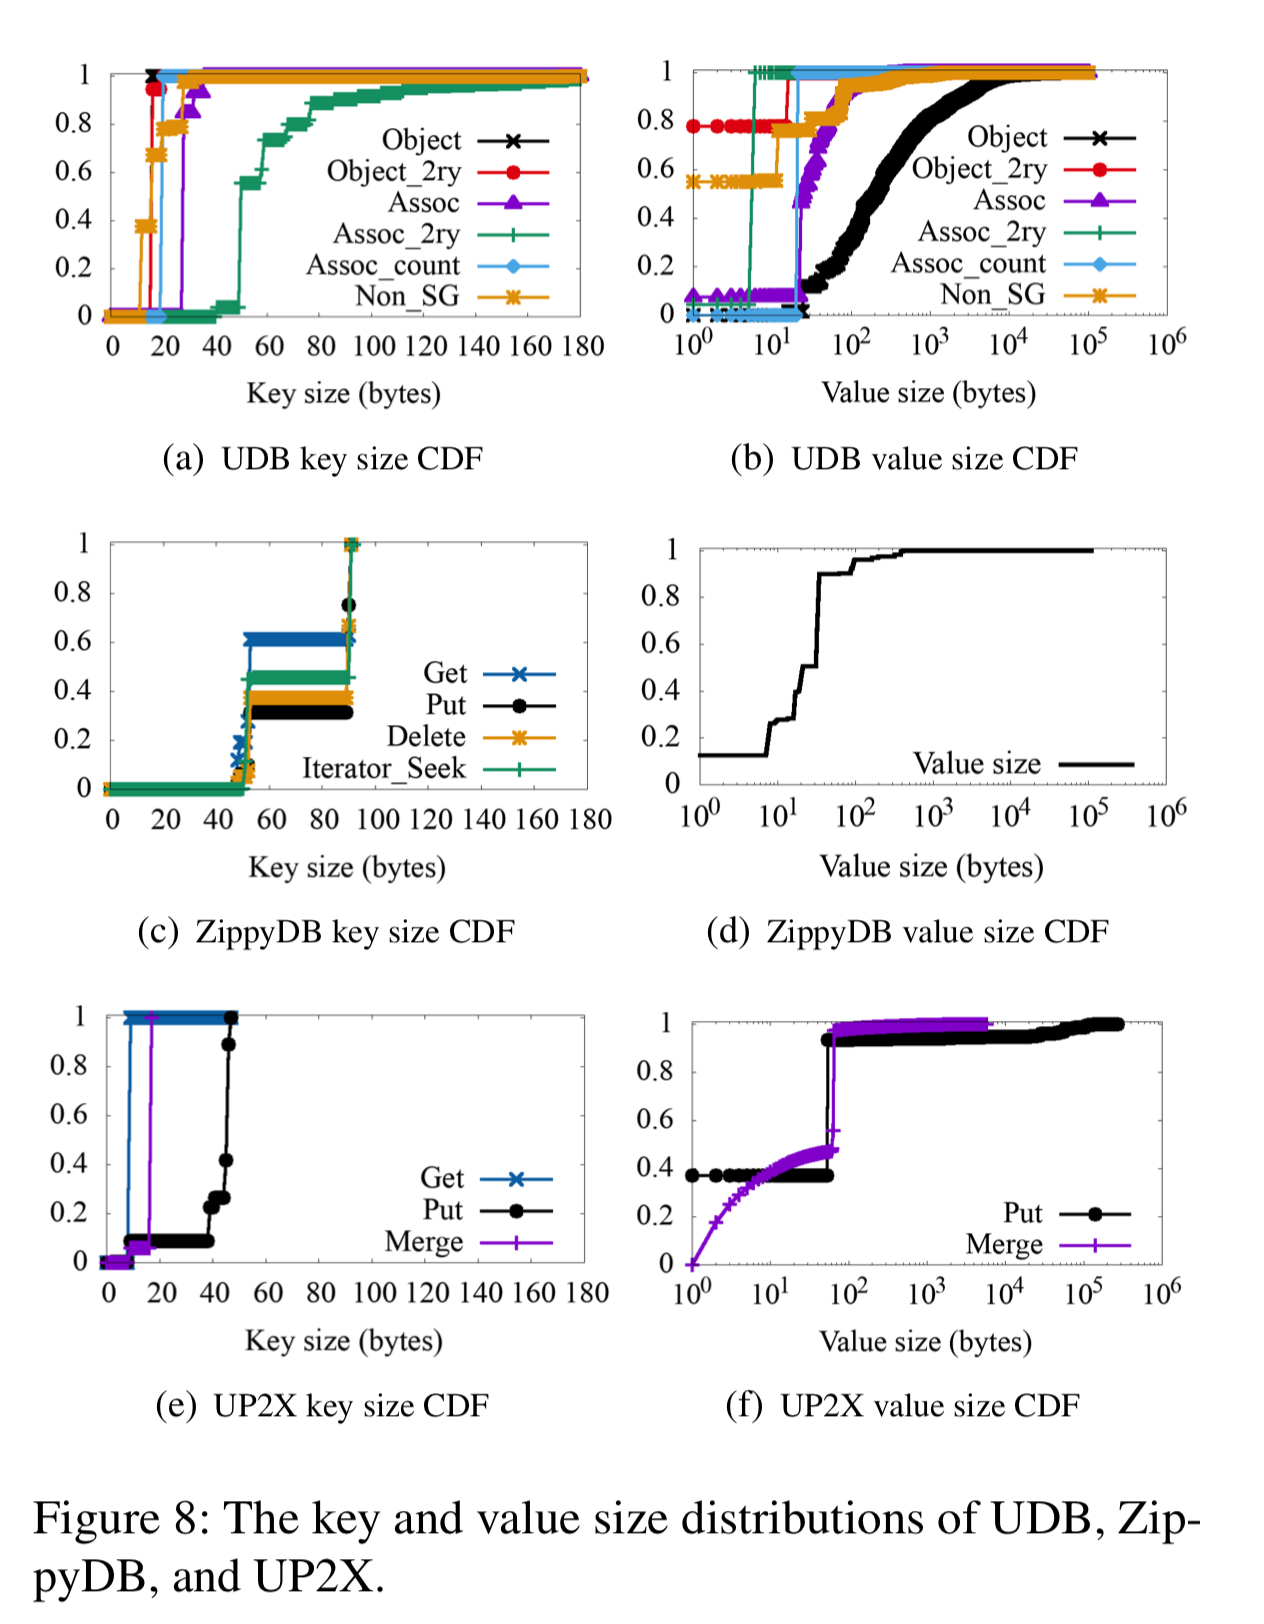
Key sizes are generally small with a narrow distribution. Value sizes have a large standard deviation, with the largest value sizes appearing in the UDB application.
Key access frequency distribution
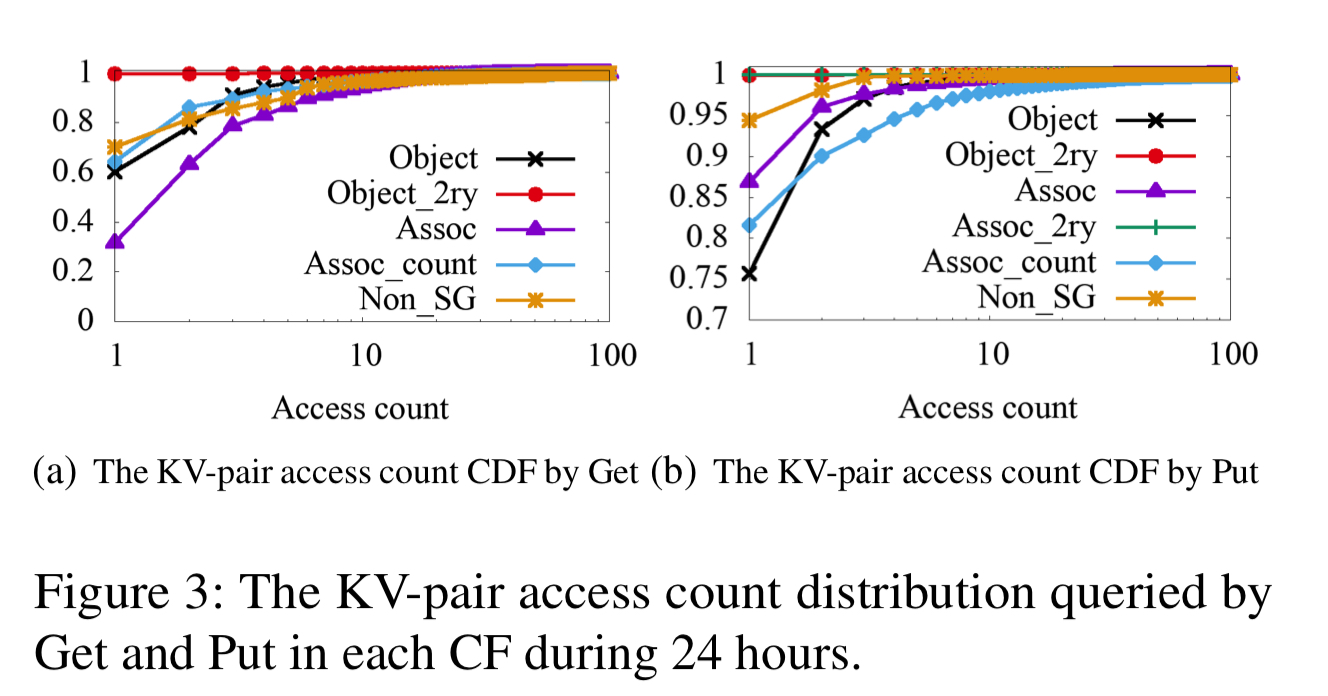
For UDB and ZippyDB, most keys are cold and the majority of KV-pairs are rarely updated. For UDB, many read requests for popular data will be handled by the upper cache tiers and so never hit RocksDB. Less than 3% of keys are accessed in a 24 hour period.
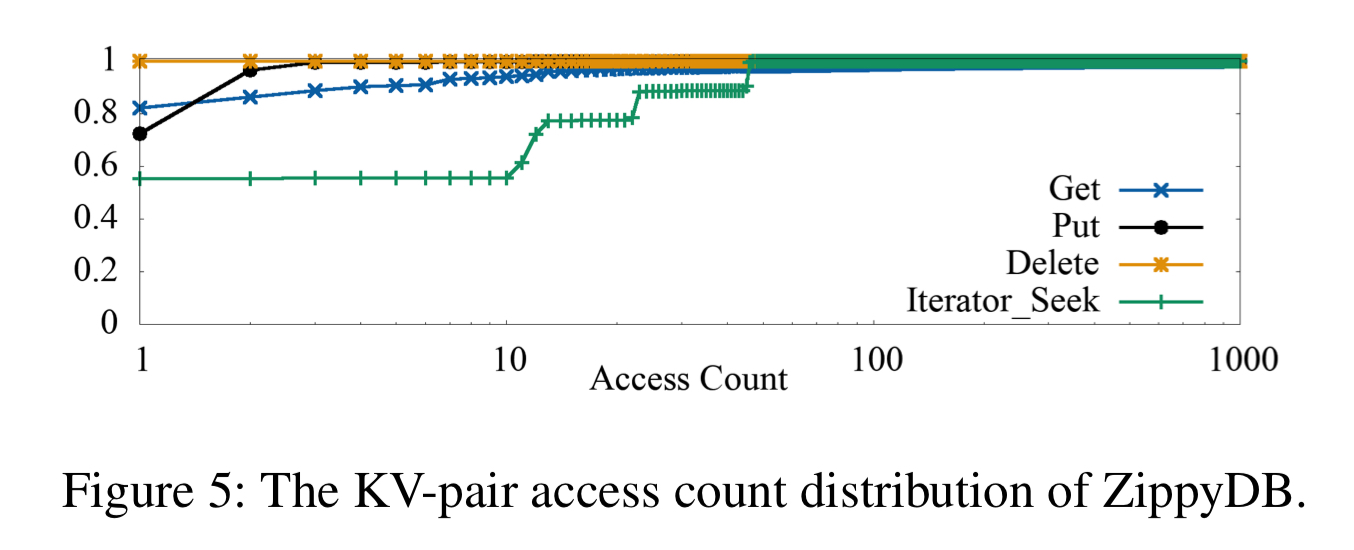
ZippyDB shows average key access counts of 15 get operations per day, and only 1 put or delete operation.
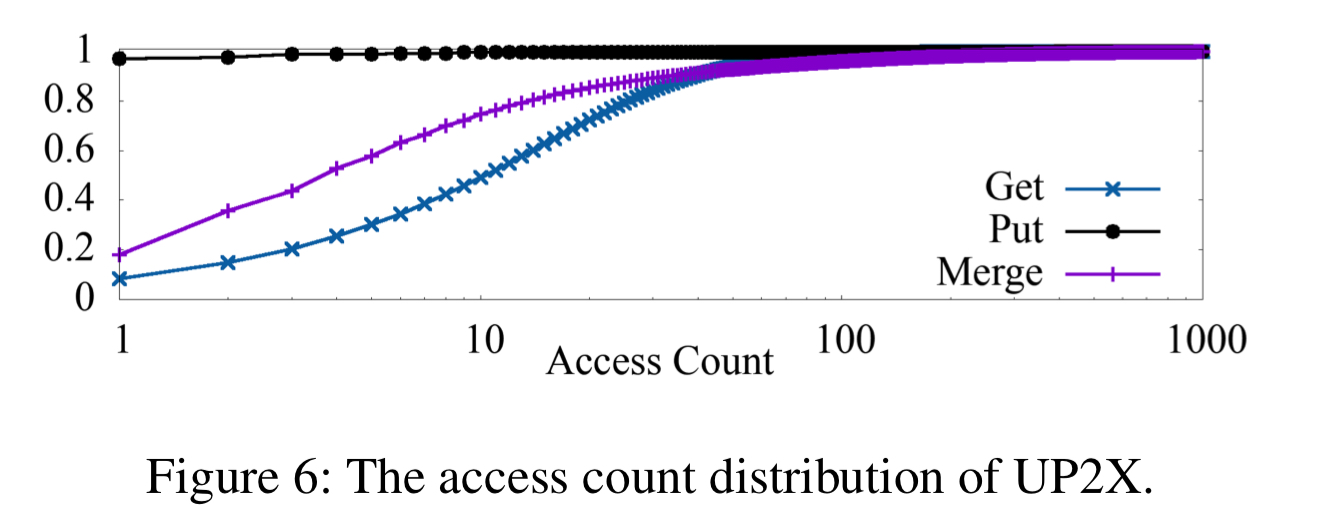
For UPX about 50% of the KV-pairs accessed by Get, and 25% of the KV-Pairs accessed by Merge are hot.
The key-range distribution of hot keys
This turns out to be one of the most important factors in being able to generate synthetic YCSB workloads that mirror Facebook workloads. It matters because RocksDB reads from storage in data blocks (e.g. 16KB). So if a workload has good key locality many less reads from storage will be needed.
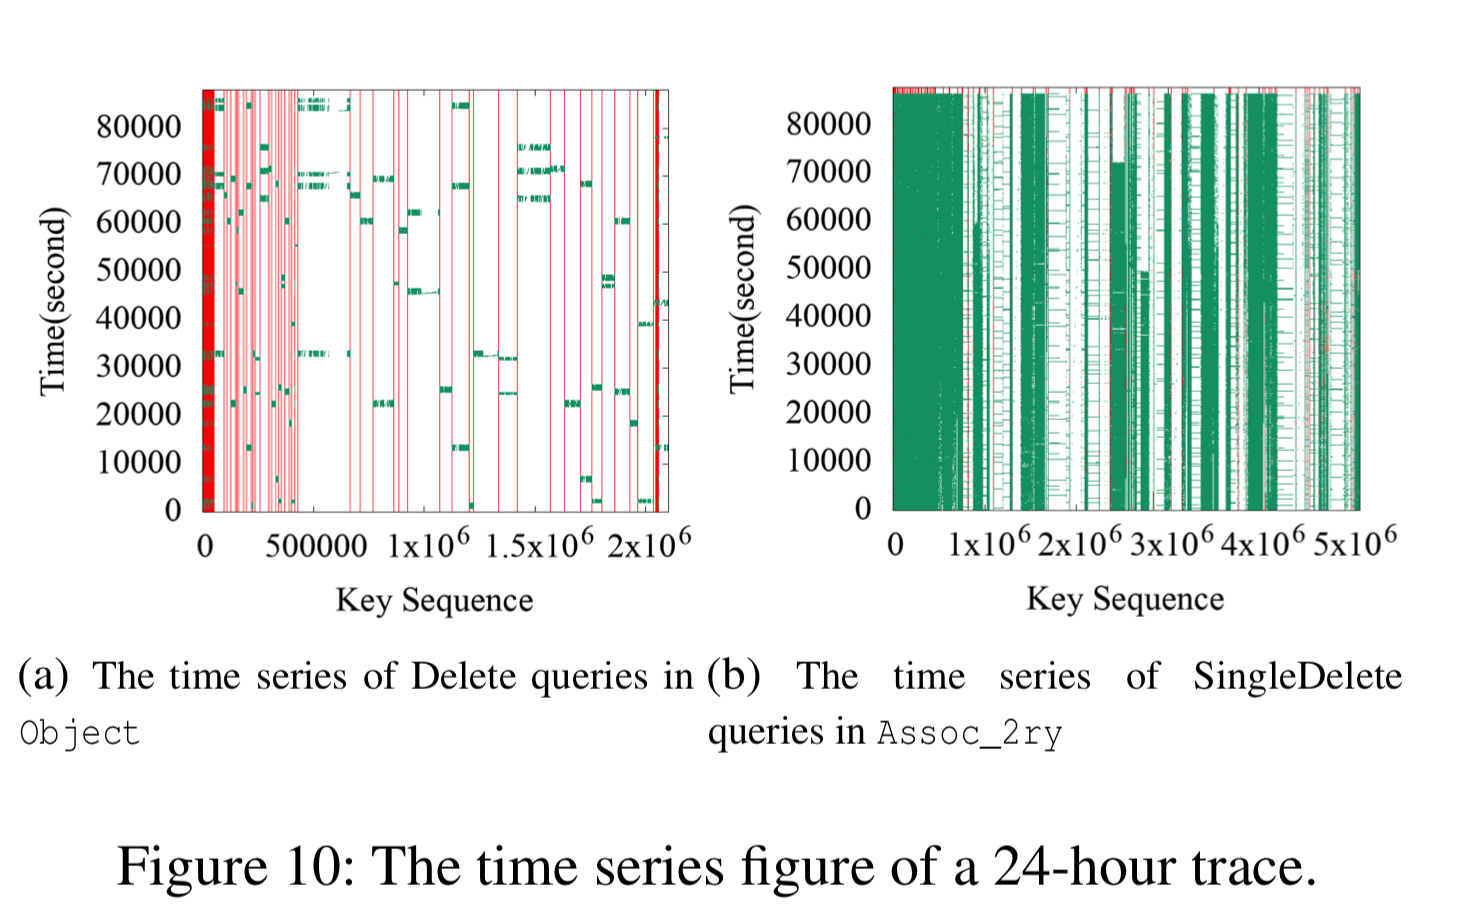
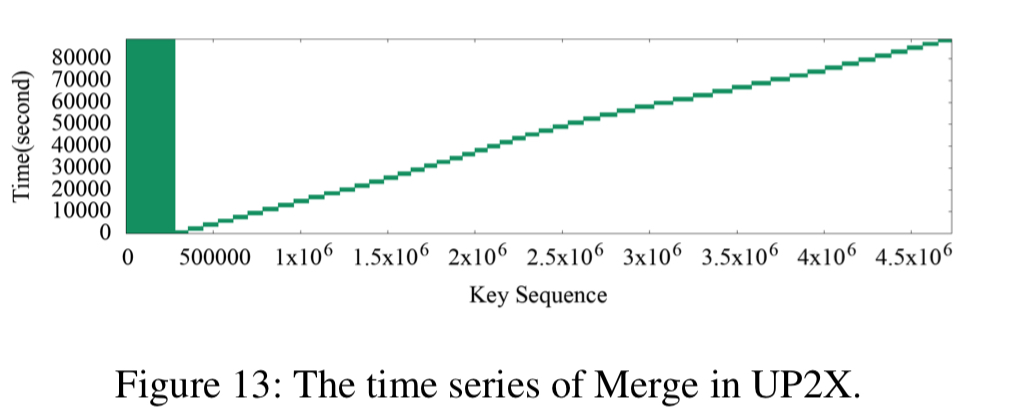
The heat maps of the three use cases show a strong key-space locality. Hot KV-pairs are closely located in the key-space. The time series figures of Delete and SingleDelete for UDB and Merge for UP2X show strong temporal locality. For some query types, KV-pairs in some key-ranges are intensively accessed during a short period of time.
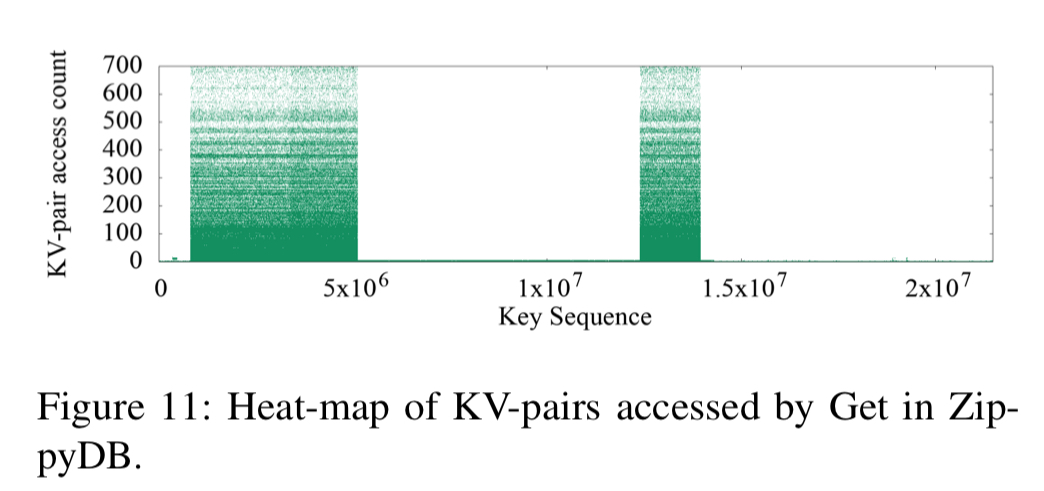
ZippyDB’s hot keys are concentrated in several key ranges:
A small range of KV-pairs are intensively called during UP2X Merge in half-an-hour:
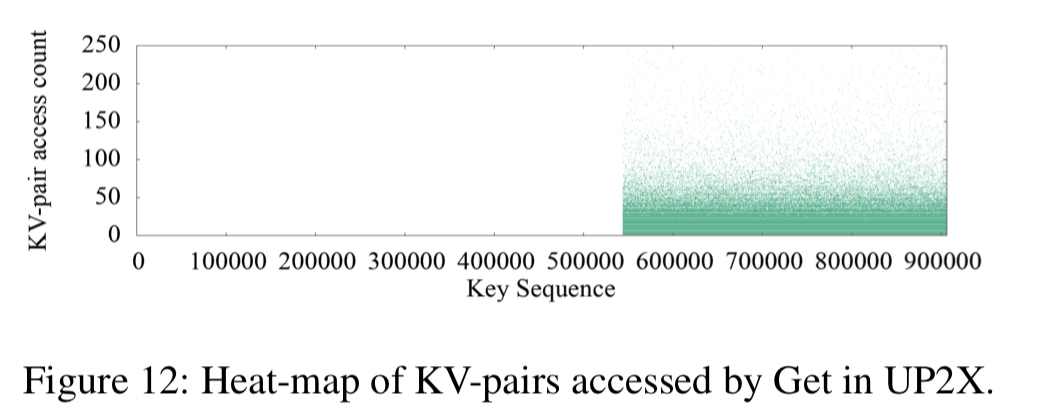
And UP2X is interesting here for the clear boundary between hot and cold KV-pairs for gets:
Better benchmarks
Armed with the detailed traces for these workloads, the key question is whether or not they can be accurately replicated with YCSB:
Researchers usually consider the workloads generated by YCSB to be close to real-world workloads.
YCSB lets you tune the query type ratio, KV-pair hotness distribution, and value size distribution. But it doesn’t let you control the key-range distribution of hot keys. Does that matter? The authors generated YCSB workloads to get as close as possible to the parameters of the ZippyDB workload (used as typical distributed KV-store) and measured the resulting storage I/O statistics to compare them to those from the real workloads being emulated (e.g. block reads, block cache hits, read-bytes, write-bytes).
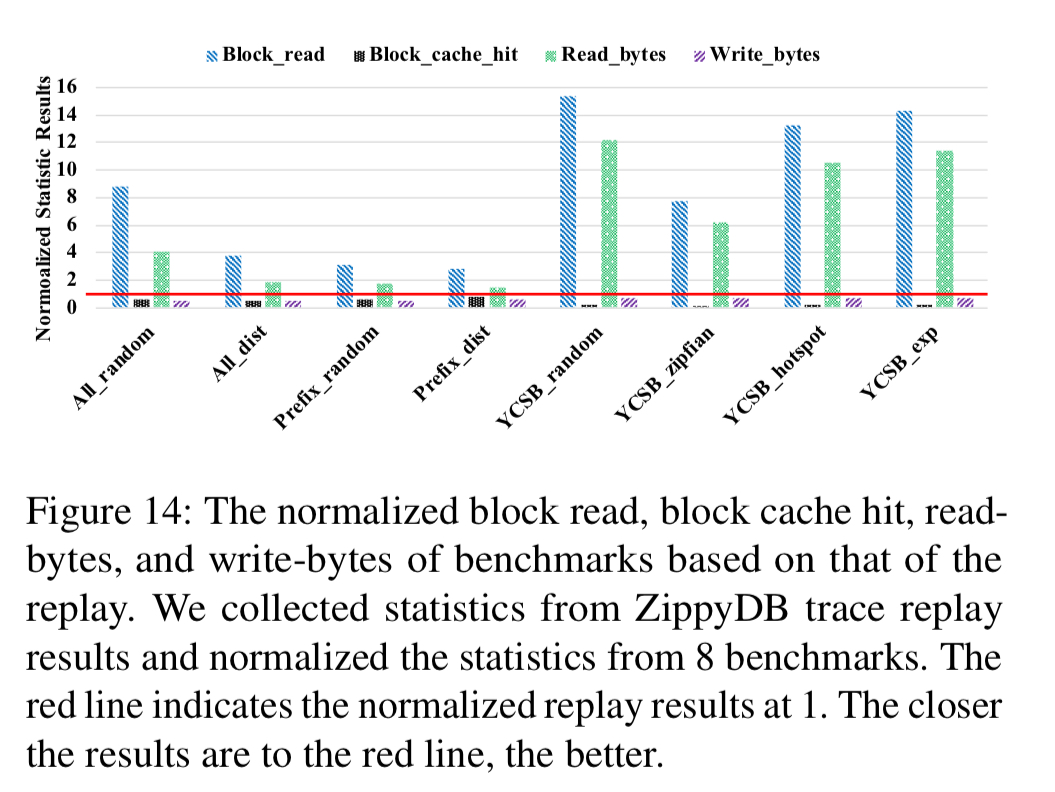
The YCSB workload showed very high read amplification (7.7x block reads, 6.2x bytes) compared to the true ZippyDB workload.
This evaluation shows that, even though the overall query statistics (e.g., query number, average value size, and KV-pair access distribution) generated by YCSB are close to those of ZippyDB workloads, the RocksDB storage I/O statistics are actually quite different.
db_benchhas a similar situation. Therefore, using the benchmarking result of YCSB as guidance for production might causes some misleading results…. The main factor that causes this serious read amplification and fewer storage wries is the ignorance of the key-space locality.
The obvious thing to do therefore, is to consider the key-range distribution when generating operations for a synthetic workload. The key space is split into ranges (using the average number of KV-pairs per SST as the range size), and the average accesses per KV-pair of each key-range is calculated and fit to the distribution model with the minimal fit standard error to the real workload (e.g. Power, Exponential, Webull, Pareto, Sine). This technique is integrated into db_bench. A QPS model controls the time intervals between two successive queries. When a query is generated:
- The query type is drawn from the query type probability distribution
- The key size and value size are determined from the fitted models for size
- A key-range is chosen based on the key-range access probabilities
- A key within the chosen range is selected based on the distribution of KV-pair access counts
The following chart shows that the resulting workload (Prefix_dist) is much closer to the true statistics (normalised line) than any of the YCSB generated workloads.
In the future, we will further improve YCSB workload generation. with key-range distribution. Also, we will collect, analyze, and model the workloads in other dimensions, such as correlations between queries, the correlation between KV-pair hotness and KV-pair sizes, and the inclusion of additional statistics like query latency and cache status.
2 thoughts on “Characterizing, modeling, and benchmarking RocksDB key-value workloads at Facebook”
Comments are closed.