Gandalf: an intelligent, end-to-end analytics service for safe deployment in cloud-scale infrastructure, Li et al., NSDI’20
Modern software systems at scale are incredibly complex ever changing environments. Despite all the pre-deployment testing you might employ, this makes it really tough to change them with confidence. Thus it’s common to use some form of phased rollout, monitoring progress as you go, with the idea of rolling back a change if it looks like it’s causing problems. So far so good, but observing a problem and then connecting it back to a given deployment can be far from straightforward. This paper describes Gandalf, the software deployment monitor in production at Microsoft Azure for the past eighteen months plus. Gandalf analyses more than 20TB of data per day : 270K platform events on average (770K peak), 600 million API calls, with data on over 2,000 different fault types. If Gandalf doesn’t like what that data is telling it, it will pause a rollout and send an alert to the development team.
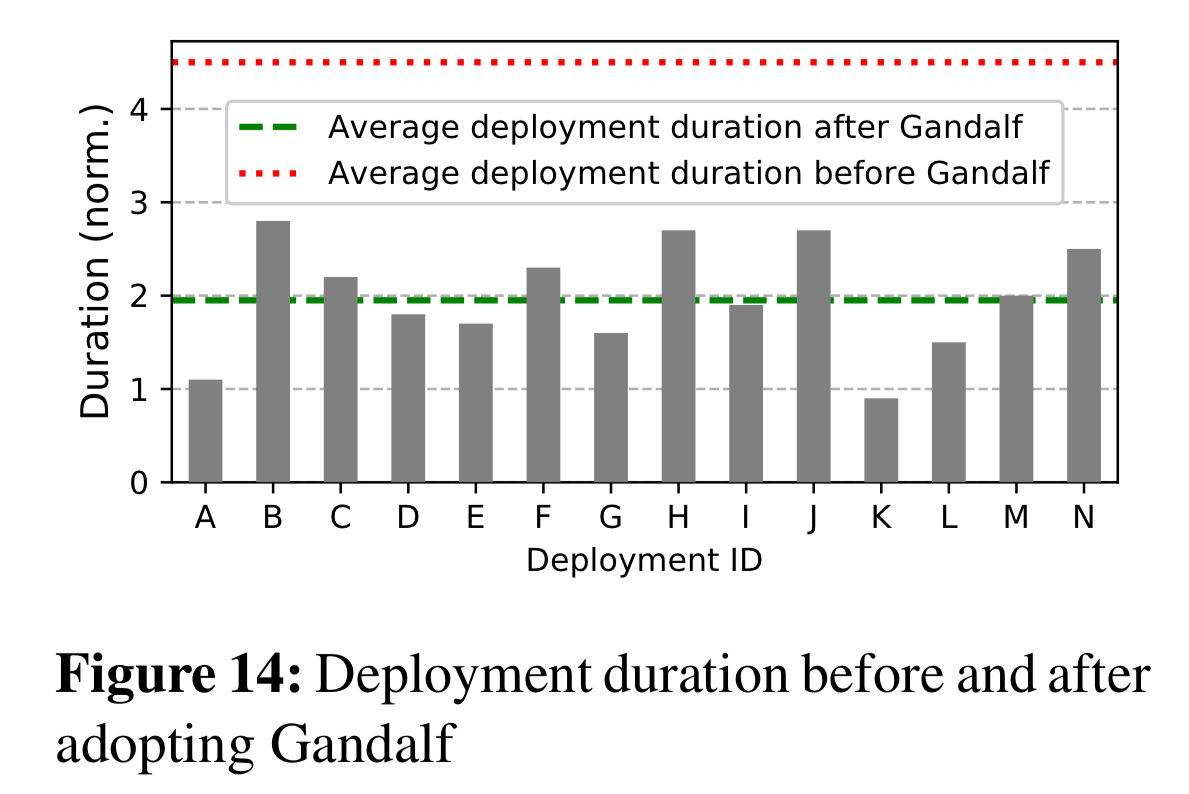
Since its introduction, Gandalf has significantly improved deployment times, cutting them in half across the entire production fleet. As teams gained more experience with Gandalf, and saw how it was able to detect complex failures that even human experts can miss, their initial mistrust of an automated system turned around completely:
For many teams, the deployment policy has become that the rollout will not continue to the next region unless Gandalf gives a green light decision.
The transparency that Gandalf gives to all its decisions, providing full interactive access to all of the supporting evidence, has played a big role in it gaining that trust.
Why is it so hard to spot a bad rollout?
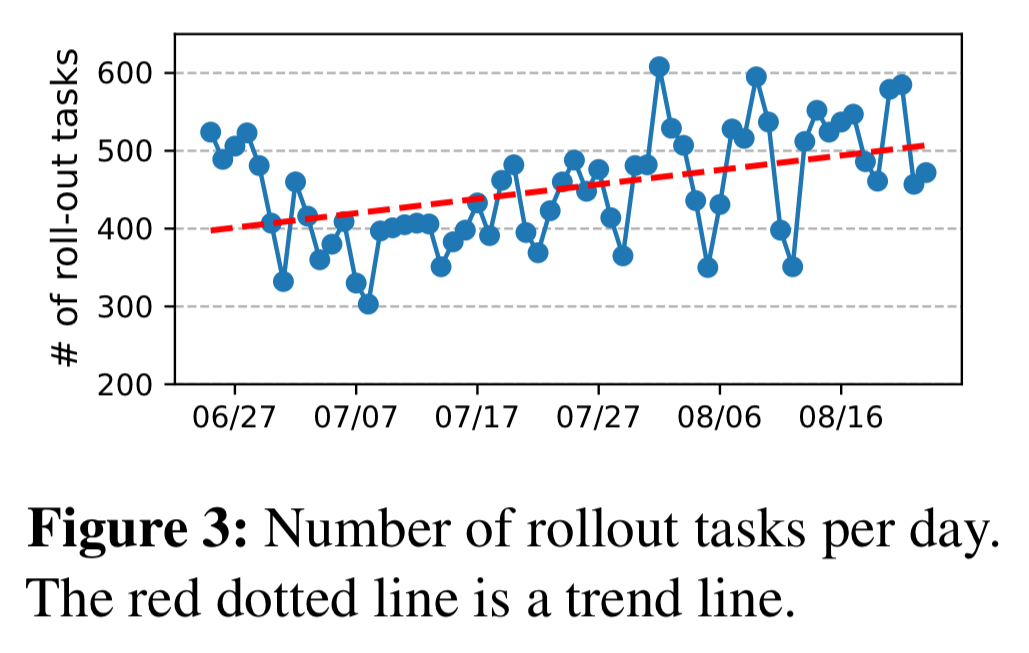
First off, there are a lot of them! So it’s not like you’re trying to assess the impact of one change against a stable base. Instead there are multiple waves of change rolling out through the fleet at any point in time.
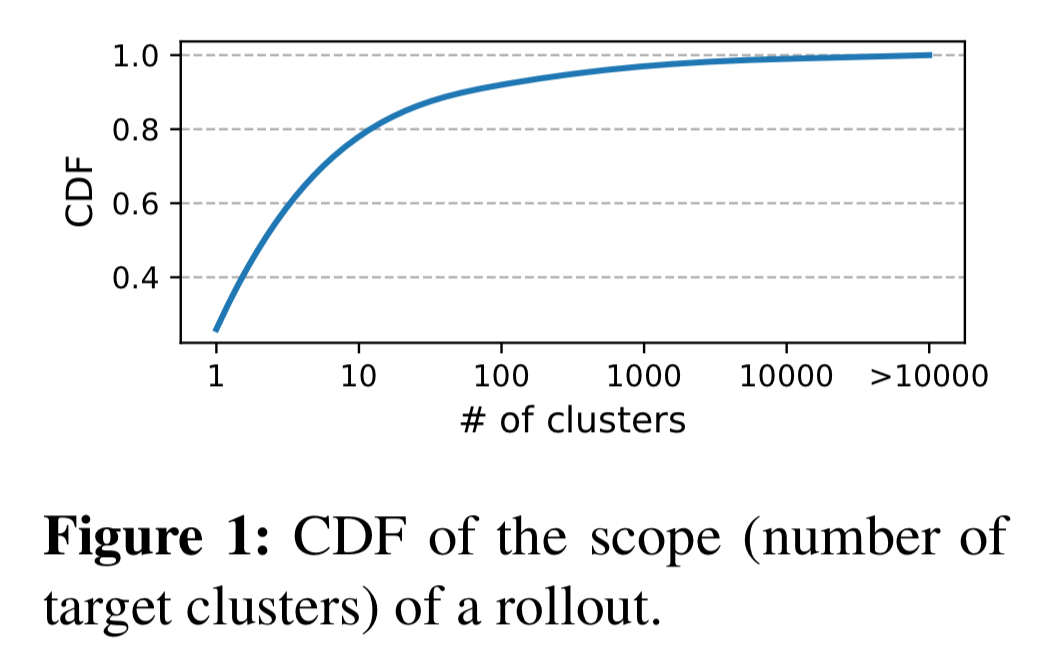
Each of those changes will go through a phase deployment typically consisting of stage, canary, light region, heavier region, half region pairs, and the other half of region pairs. More than 70% of the rollouts target multiple clusters.
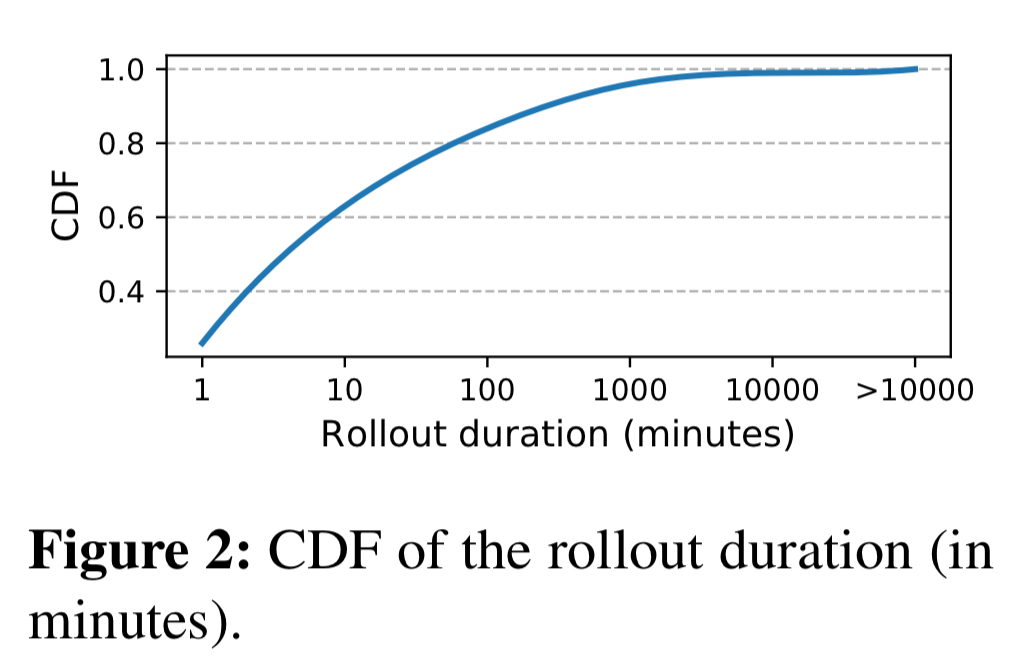
More than 20% of rollouts last for over 1,000 minutes.
And that’s before we stay to layer in some of the confounding factors: there are faults going on all the time, not all of them caused by software rollouts (we don’t want false alarms); there can be substantial delays between a rollout and the occurrence of problems (e.g. memory leaks that take hours to build up into an issue); and there can be problems that only exhibit themselves with certain user, hardware, or software configurations.
All of this means that Gandalf faces four key challenges in making sense of all that data:
- Gandalf needs to be able to cope with constant change in systems and signals: new components emerge, and existing components evolve, changing the failure patterns and telemetry signals.
- Ambient faults due to e.g. hardware faults, network timeouts, and gray failures are occurring all the time, and many of these are unrelated to deployments. Gandalf therefore operates in a very noisy environment.
- Detecting problems quickly, while also gathering comprehensive information over time to catch delayed issues.
- Once a genuine problem has been detected, figuring out which change is the likely cause!
An n-to-m mapping relationship exists between components and failures: one component may cause multiple types of failure, while a single type of failure may be caused by issues in multiple components. Figuring out which failure is likely caused by which component is not easy due to the complexity of component behaviors.
Gandalf system design
At a high level Gandalf looks like this:
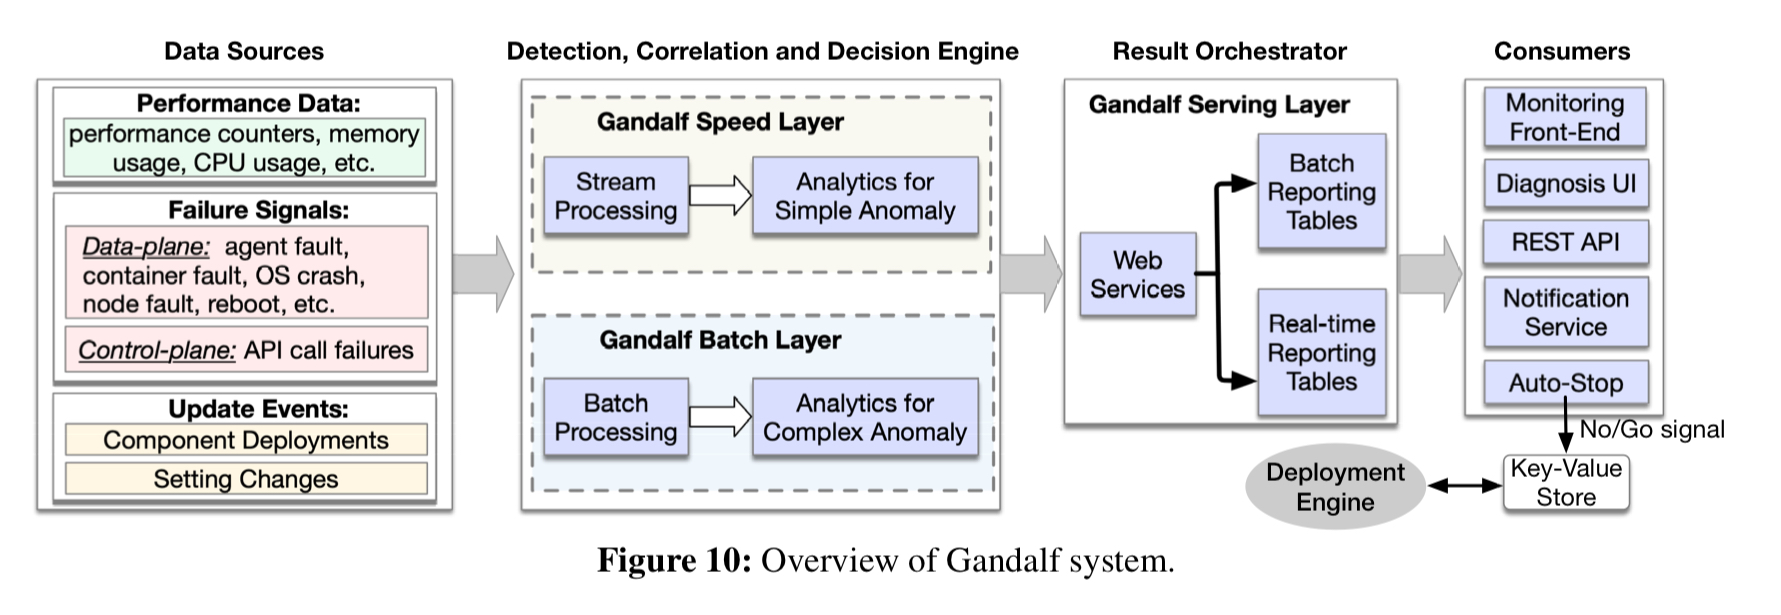
It ingests performance data, failure signals, and component update events and passes them through both fast and slow paths (a lambda architecture). The fast path is able to detect simple, immediate issues and provide quick feedback (within 5 minutes). The batch layer can detect deferred (latent) issues, analyse more complex failure scenarios, and also provide more detailed supporting evidence.
The analysis engine in the speed layer only considers fault signals that happen 1 hour before and after each deployment in each node, and runs lightweight analysis algorithms to provide a rapid response. In Azure, most catastrophic issues happen within 1 hour after the rollout. Latent faults occurring after 1 hour will be capture by the batch layer later.
The combined outputs of the fast and slow paths are fed into Gandalf’s system interface, with a front-end that developers used to view rollout status in real-time and a UI for diagnosing issues. The Azure deployment engine subscribes to Gandalf’s go/no-go decisions, and stops a rollout if a ‘no-go’ decision is published.
From signals to decisions
In designing the algorithms for Gandalf, we considered existing options from supervised learning, anomaly detection and correlation analysis but found major limitations for each of them.
Supervised learning struggles with the constant changing of signal and failure patterns in the underlying system. Anomaly detection is insufficient since there are many rollouts occurring simultaneously and it can’t tell them apart. Correlation analysis based on Pearson correlation can’t capture the complex causal relationships that arise.
The authors ended up with a three-phase analysis pipeline: anomaly detection, correlation analysis, and then a decision engine.
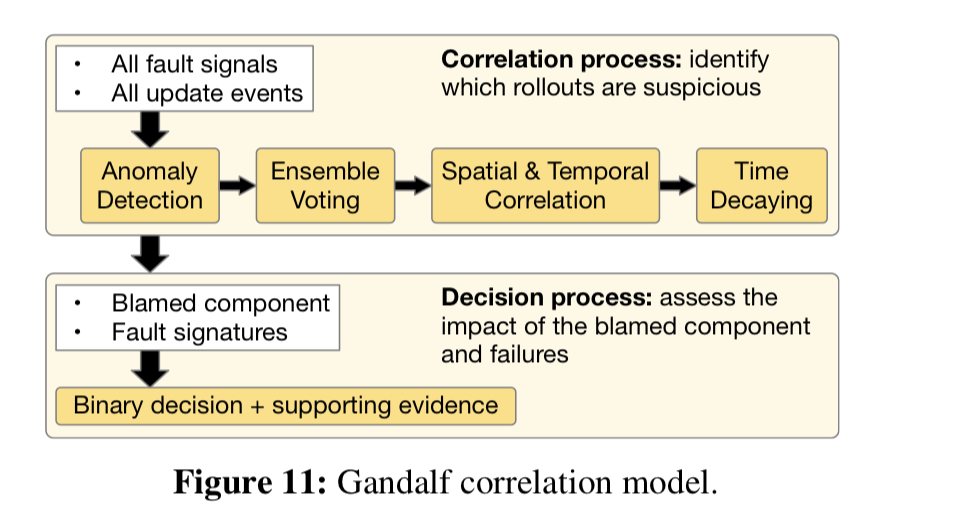
Gandalf does the normal trick of text clustering around log messages to generate fault signatures, and then applies anomaly detection based on the occurrences of each signature. Given the changing nature of workloads and the system itself, simple thresholding isn’t sufficient and so Gandalf uses Holt-Winters forecasting to estimate a baseline using the previous 30 days worth of data, and a one hour step interval.
It’s the job of the correlation analysis phase to try and figure out which component might be responsible for a detected anomaly (if any). Correlation is based on ensemble voting with vetoes. For a component change deployed on some node at time t, a fault happening after t votes for that component change as a possible cause. A fault happening before t vetoes that component change as a possible cause. Four different time windows are used for ‘before’ and ‘after’ (1 hour, 1 day, 3 days, …). The votes and vetoes from each time period are weighted (exponential decay) so that smaller intervals contribute more.
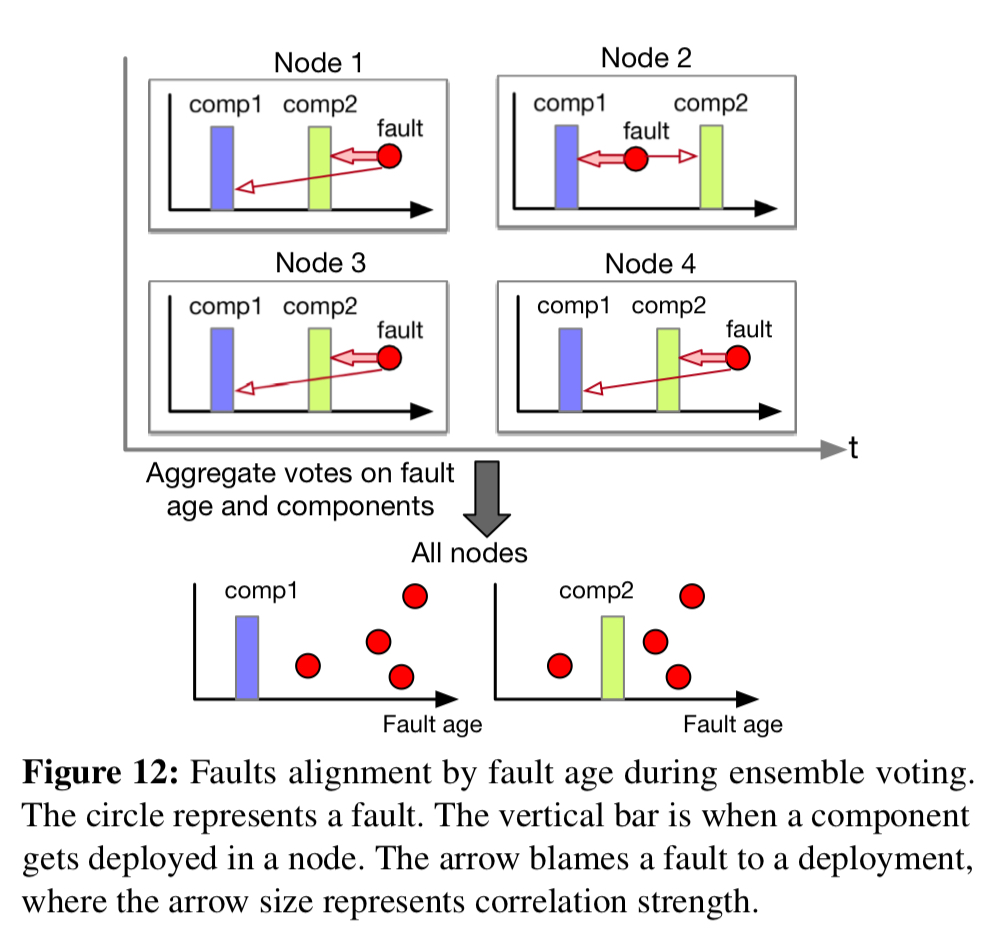
To produce the final blame score the a second exponential time decay factor is incorporated that gives more weight to recent rollouts.
Given a component and a blame score, it’s time to make a go/no-go decision.
We make a go/no-go decision for the component
by evaluating the impacting scopes of the deployment such as the number of impacted clusters, the number of impacted nodes, number of customers impacted, etc.. Instead of setting static thresholds for each feature, the decision criteria are trained dynamically with a Gaussian discriminant classifier. The training data is generated from historical deployment cases with feedback from component teams.
Gandalf in action
Gandalf makes decisions in about 5 minutes end-to-end on the fast path, and in about 3 hours on the batch layer. In a 8 month window Gandlef captured 155 critical failures at an early stage of data plane rollout, achieving a precision of 92.4% and 100% recall (no high impact incidents got past Gandalf). For the control plane, Gandalf filed 39 incidents with 2 false alarms. Precision here was 94.9%, with 99.8% recall.
The most common issues Gandalf caught are compatibility issues and contract breaking issues. Compatibility issues arise with updates are tested in an environment with the latest hardware or software stack, but the deployed nodes may have different hardware SKUs or OS or library versions. Contract breaking issues occur when the component does not obey its API specifications and breaks dependent components.
Fascinating! I wish I’d known about this sooner.