Debugging data flows in reactive programs Banken et al., ICSE’18
To round off our look at papers from ICSE, here’s a really interesting look at the challenges of debugging reactive applications (with a certain Erik Meijer credited among the authors).
… in recent years the use of Reactive Programming (RP) has exploded. Languages such as Elm and libraries such as Reactor, Akka, and Rx are being used by companies such as Netflix, Microsoft, and Google, to build highly responsive and scalable systems.
The rise of reactive programming fits well with the increasing need to process streams of data. In a reactive program, you set up a data processing pipeline and then wait for input to arrive.
Many RP implementations share a notion of a collection that abstracts over time, in contrast to space like standard collections. This collection comes in different flavors, such as Observable (Rx)… the implementations differ in the precise semantics of their collections, their execution model (push/pull) , and the set of available operators.
While in theory events and threads are duals, in practice the RP abstraction works very well for expressing streaming pipelines. If you have an abstraction over time though, then one consequence is that the program control flow is also abstracted. That brings us to the central problem statement:
RP borrows from functional programming (FP) for its abstractions, its laziness, and its use of “pure” functions. Those features contribute to a control flow that is hidden inside the RP implementation library and leads to non-linear execution of user code. This results in non-useful stack traces, while breakpoints do not help either, as relevant variables are frequently out of scope. Furthermore, using a low-level debugger makes it harder to interact with the high-level abstractions that RP provides. (Emphasis mine).
Banken et al. set out to find out how experienced RP programmers deal with these issues in practice. Then having understood the state-of-the-art (spoiler alert: printf), they set out to see if it’s possible to build a debugging environment better suited to RP applications. The result is RxFiddle, which you can experiment with online. The source code is available on GitHub.
The Rx model and Marble diagrams
Observables define the data flow and produce data, while Observers receive data. In the following example, of() creates a simple Observable, and map and filtercreate dependent Observers. The call to subscribe starts the flow of data.
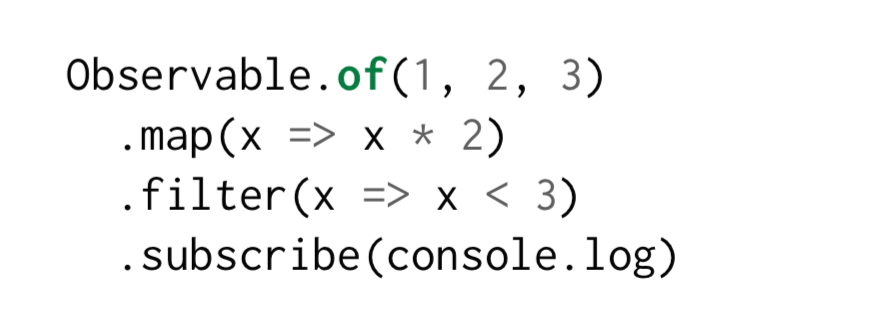
Until that call to subscribe, we are just in the assembly phase, building up the pipeline. When subscribe is called on an Observable, the subscription propagates back upstream. This is the subscription phase.

In the runtime phase Observables with subscriptions start emitting data. Rx defines three types of events that can occur during the runtime phase: next, error, and complete.
More complex programs feature operators that merge Observables, split Observables, or handle higher-order Observables, resulting in more complex graphs.
Marble diagrams (the name comes from the shape of the glyphs used in the Rx documentation) contain one or more timelines containing events that enter and leave Observables. By convention next events are represented with by a circle, error events with a cross, and complete events with a vertical line. See examples at RxMarbles.com, which visualises single Rx operators for the purposes of learning and comprehension. RxViz, an “animated playground for Rx Observables’” is similar but uses a code editor instead of prepared inputs, and visualises the output of the stream.
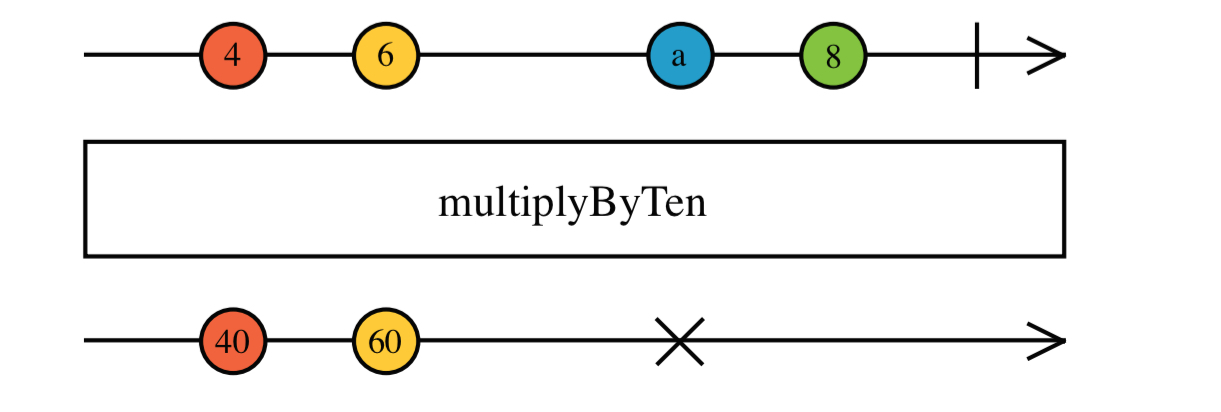
The diagrams help developers understand how the various operators work. “Mapping time on the x-axis provides insight that is missing when inspecting only a single time slice.
Debugging in practice today
The authors interviewed five developers with between 4 and 12 years each of professional programming experience. The first four developers work at a company A which builds reactive systems, the fifth is building a large scale distributed server application at company B, using Rx to handle asynchronous events. Experience with Rx ranges from a month to over a year across the group
At company A there are no explicit Rx tests (they do test the business logic of course). Company B extensively test using Rx’s ‘marble tests’ library and TestScheduler.
Subjects mostly use printf() statements to debug. Printing values through the flow allows them to “quickly reason about what happens,” whereas using the Node.js debugging is “painful.” There are frequent trips to the documentation to find an operator for the task in hand, and to comprehend how existing operators work. When comprehending code, subjects first look at which operators are used, and then they reason about the types and values that might flow through the stream. Traditional IDE support turns out to be much less helpful when building reactive applications:
- “Rx is more about timing than about types“…, “you miss some sort of indication that the output is what you expect.”
- It is not always clear what happens when you execute a piece of code, “mostly due to Observables sometimes being lazy.”
- Flows are clear and comprehensible in the scope of a single class or function, but for application-wide flows it becomes unclear.
- “You need to know a lot as a starting Rx developer.“
The team also scoured official documentation, books, online course and blog posts searching for debugging best practices and recommendations. There were slim pickings, with this article by Staltz on “How to debug RxJS code” being a rare exception. Staltz recommends (a) tracing to the console, (b) manually drawing the dependency graph, and (c) manually drawing Marble diagrams.
Overall, we identified four overarching practices when debugging Rx code: (i) gaining high-level overview of the reactive structure, (ii) understanding dependencies between Observables, (iii) finding bugs and issues in reactive behavior, (iv) comprehending the behavior of operators in existing code.
(Salvaneschi and Mezini also looked into some of the issues in their 2016 paper, ‘Debugging for Reactive Programming
Introducing RxFiddle
RxFiddle is designed to help with these objectives by providing a visual overview of Observable flows, and also detailed views inside the data flows at an event level. RxFiddle therefore contains a data flow graph visualiser, and a dynamic Marble diagram generator. It looks like this:
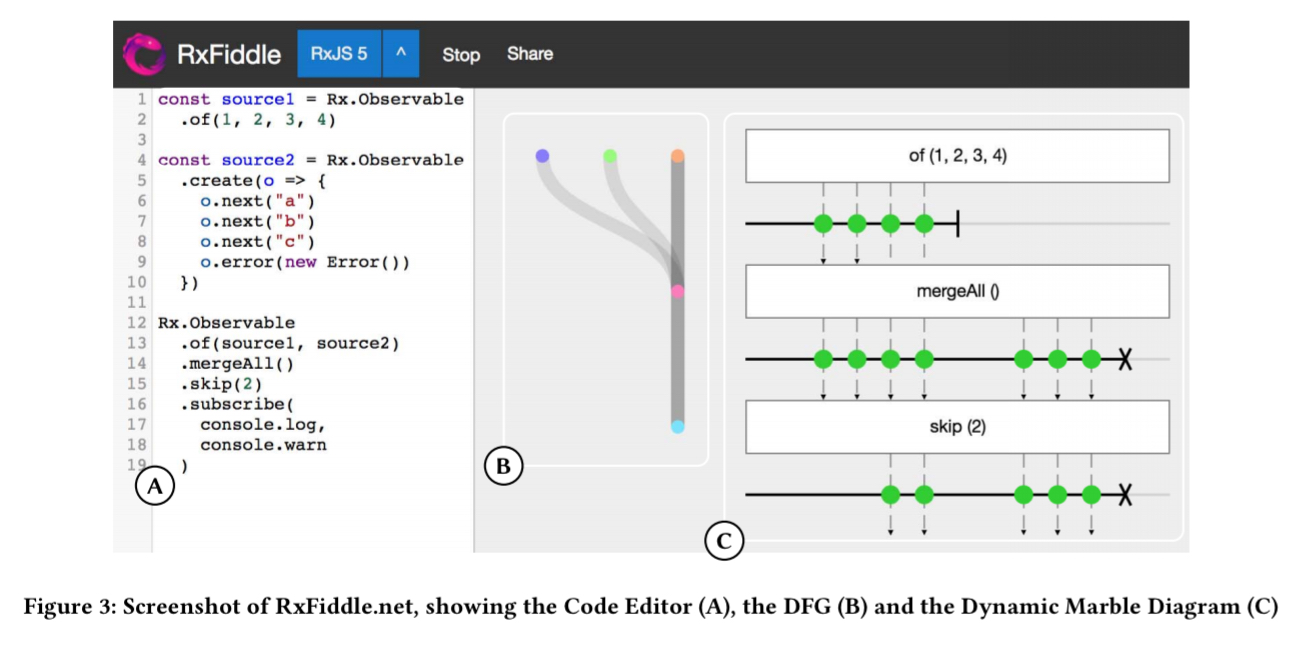
The Data Flow Graph bundles together multiple subscriptions on the same Observable, helping developers find related flows and identify possible performance optimisations. The layout engine is based on StoryFlow, originally designed to visually describe storylines involving multiple characters and the interactions between them. The StoryFlow elements are positioned to align with the Marble diagram. Node colours are used to identify the same Observable used at multiple places in the graph.
The Dynamic Marble Diagrams update live when new events occur, and are stacked to show the data in a complete flow.
This allows developers to trace a value back through a flow, an operation which is impossible using a classic debugger. Handcrafted marble diagrams can use custom shapes and colors to represent events, but for the generic debugger we use only three shapes: next-events are a green dot, errors are a black cross, and completes are a vertical line.
Does RxFiddle help with debugging?
RxFiddle was evaluated in an offline experiment at a Dutch software engineering company, with developers from little to several years of RP experience. There was also a Twitter campaign within the RP community to get people to try the online version. 111 people participated in total. The following charts show the time taken to complete four tasks. T1 and T2 are synthetic examples of two simple data flows, and the participants have to understand how the program works and report findings. T3 and T4 are programs that need to be debugged. In T3 an error in an external service propagates through a stream, and in T4 concurrent requests lead to out-of-order processing of responses.
Across all participants, the following chart shows the chart completion times when using the console, and when using RxFiddle.
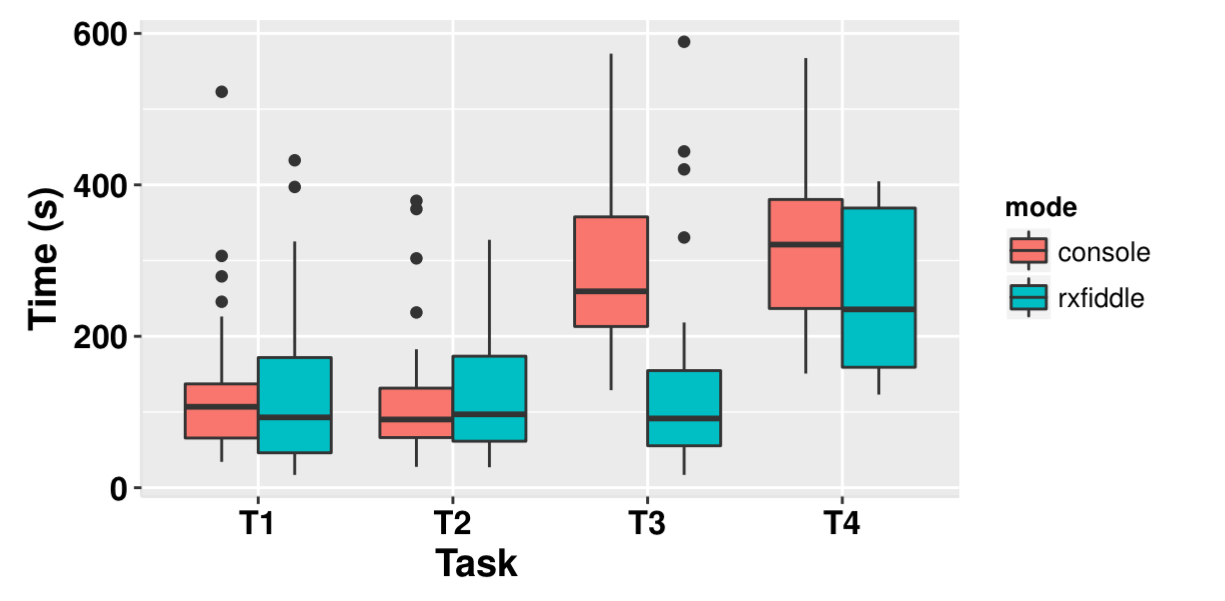
Only T3 shows clearly better results for RxFiddle. When controlling for more experienced programmers only, RxFiddle does slightly better.
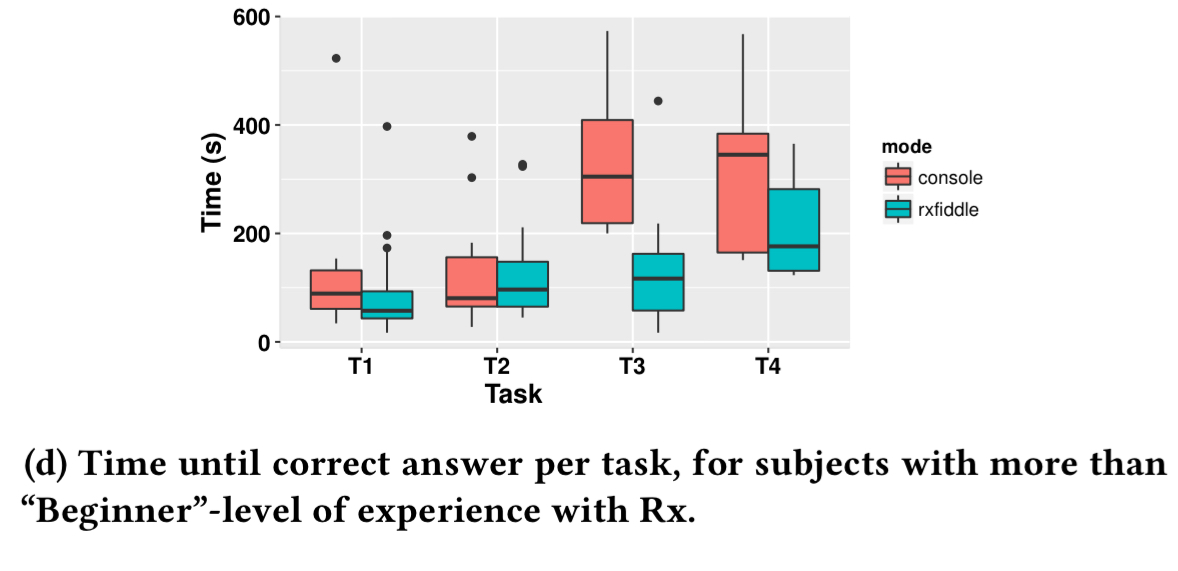
While the results of our evaluation could be observed as a negative, RxFiddle is a new tool, where subjects have only just been exposed to the tool and received only a short training. We expect that by designing a debugger model so close to the actual abstractions, our debugger works especially well for users with some knowledge of these abstractions…
Users experimenting with the tool online in their own projects reported an improved understanding of what was happening in their projects.
There are several promising directions for improving our design. Specifically scalability could be improved and different edge visualizations could be explored, to improve the usability of the tool. Furthermore, by leveraging already captured meta data about timing of events, even more insight could be provided. At the implementation level, we plan to extend RxFiddle to other members of the Rx-family of libraries.
Of note in the related work section is RP Debugging, embodied in the [Reactive Inspector[(http://guidosalva.github.io/reactive-inspector/), a recently created (? seems to be 2015/16 from what I can tell) tool for REScala delivered as an Eclipse plugin.
I was surprised to know that Verilog is a type of reactive programming language, which basically responds to multiple events of clock propagation and signal transfer.