How not to structure your database-backed web applications: a study of performance bugs in the wild Yang et al., ICSE’18
This is a fascinating study of the problems people get into when using ORMs to handle persistence concerns in their web applications. The authors study real-world applications and distil a catalogue of common performance anti-patterns. There are a bunch of familiar things in the list, and a few that surprised me with the amount of difference they can make. By fixing many of the issues that they find, Yang et al., are able to quantify how many lines of code it takes to address the issue, and what performance improvement the fix delivers.
To prove our point, we manually fix 64 performance issues in [the latest versions of the applications under study] and obtain a median speed-up of 2x (and up to 39x max) with fewer than 5 lines of code change in most cases.
The Hyperloop website provides access to a tool you can use to identify and solve some of the common performance issues in your own (Rails) apps.
I’m going to skip the intro parts about what ORMs do and how a typical web app is structured, on the assumption that you probably have a good handle on that already. Note that fundamentally a lot of the issues stem from the fact that the ‘O’ in ORM could just as easily stand for ‘Opaque.’
On one hand, it is difficult for application compilers or developers to optimize the interaction between the application and the underlying DBMS, as they are unaware of how their code would translate to queries by the ORM. On the other hand, ORM framework and the underlying DBMS are unaware of the high-level application semantics and hence cannot generate efficient plans to execute queries.
I remember in the early days of Spring (when Hibernate was young too, and JPA didn’t exist) a framework called iBATIS was quite popular amongst people I considered to be good developers. It turns out iBATIS is still going strong, though now it’s called MyBatis. The key selling point is that you retain control over the SQL, without the overheads of directly using an API like JDBC.
Finding and profiling real-world applications
The study focuses on Ruby on Rails applications, for which many large open source applications: “compared to other popular ORM frameworks such as Django and Hibernate, Rails has 2x more applications on GitHub with 400 or more stars than Django and Hibernate combined.” Six popular application categories (covering 90% of all Rails apps with more than 100 stars on GitHub) are further selected, and then the two most popular applications in each category. Resulting in the following twelve apps:
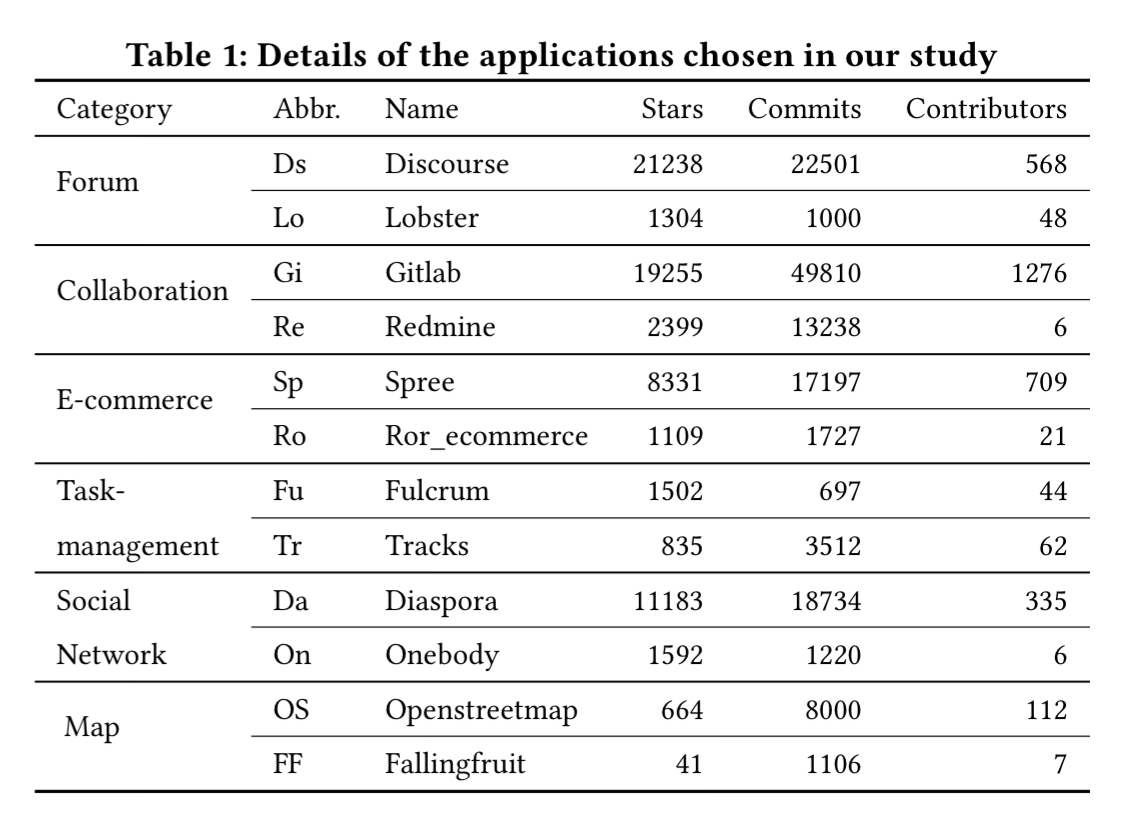
They have been developed for 5-12 years, are all in active use, and range from 7Kloc to 145Kloc (Gitlab). To generate realistic data for these apps, the team collected real-world statistics based on either the app in question where available, or similar apps otherwise, and implemented a crawler that fills out forms on the application’s websites following the real-world stats. For each application, three sets of data were created: with 200, 2000, and 20,000 records in the main database table.
When we discuss an application’s scalability we compare its performance among the three above settings. When we discuss an application’s performance we focus on the 20,000-record setting, which is a realistic setting for all the applications under study. In fact, based on the statistics we collect, the number of main table records of every application under study is usually larger than 20,000 in public deployments…
(E.g., more than 1 million records).
With databases in hand, the applications are then profiled by visiting links randomly for two hours and the resulting logs produced by Chrome and the Rails Active Support Instrumentation API are processed to obtain average end-to-end loading time for every page, the detailed performance breakdown, and the issued database queries. For each app, the 10 pages with the worst loading time are plotted in the figure below.
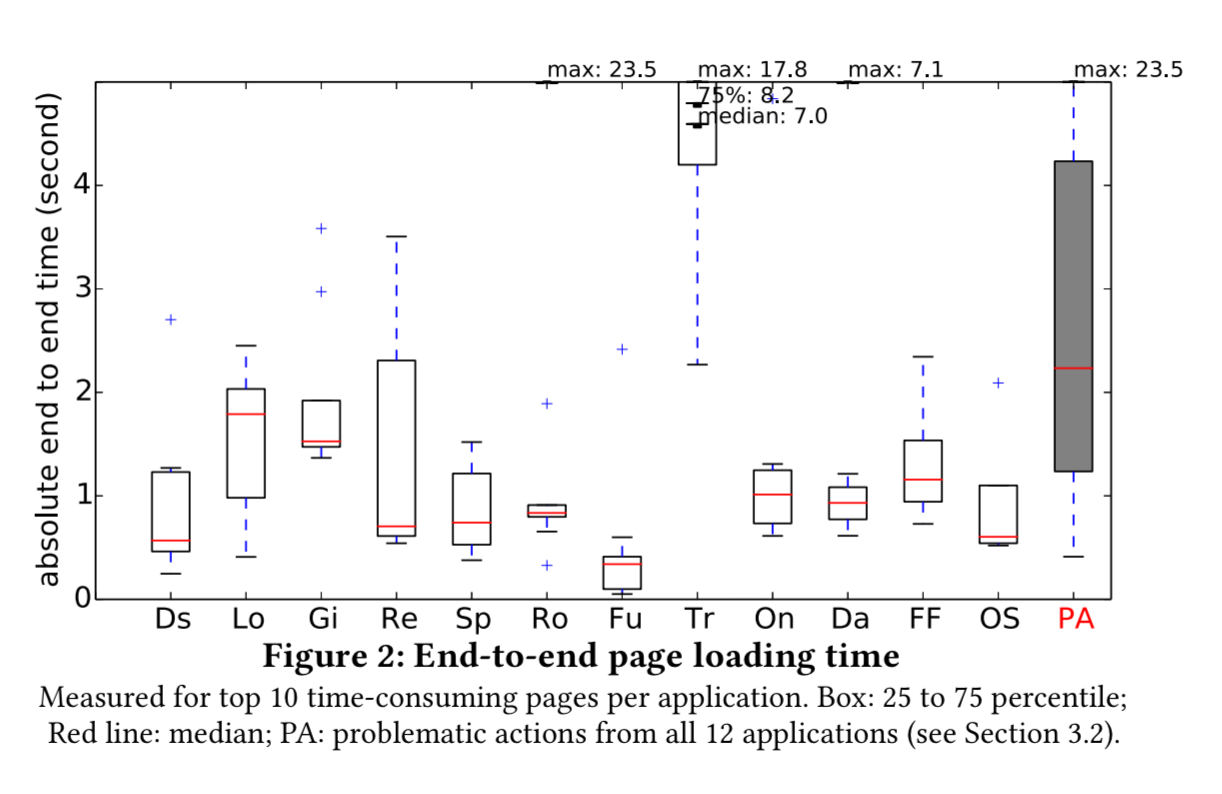
11 out of 12 applications have pages whose average end-to-end loading time (i.e. from browser sending the URL request to page finishing loading) exceeds 2 seconds; 6 out of 12 applications have pages that take more than 3 seconds to load…. Note that our workload is smaller, or for some applications, much smaller, than today’s real-world workload.
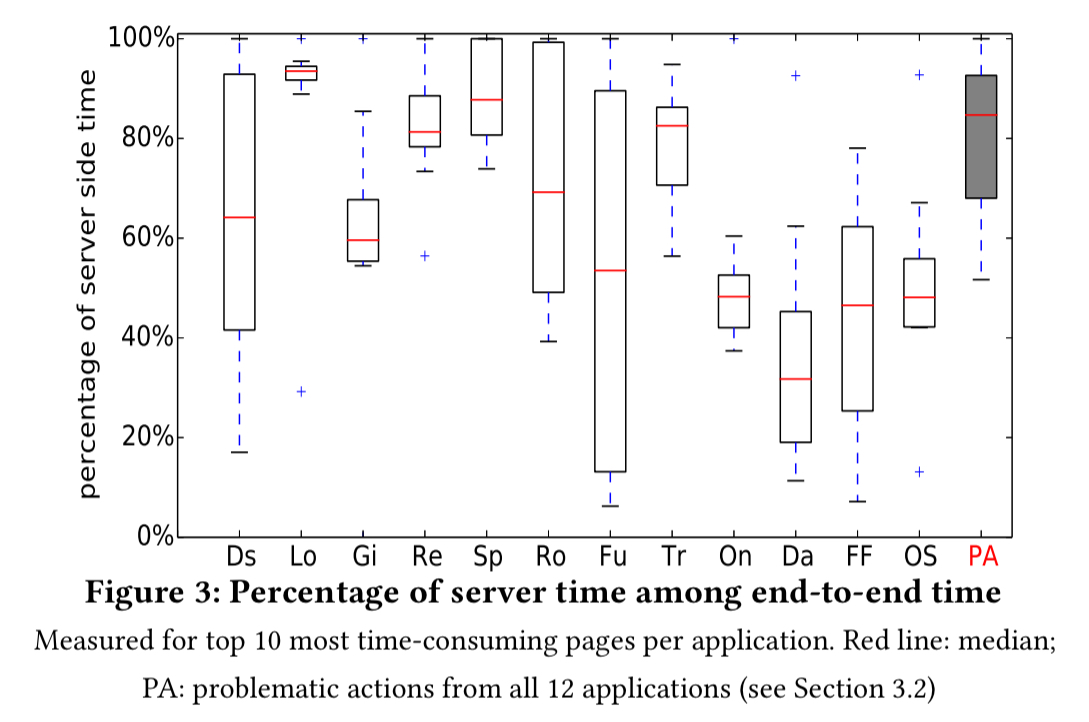
Looking at where the time goes for these queries, server time (app server + DBMS) contributes at least 40% of this latency in at least 5 out of the top 10 pages for 11 of the 12 apps.
In total, 40 problematic actions are identified from among the top 10 most time-consuming actions of every application. 34 of these have scalability problems, and 28 take more than 1 second of server time. 64 performance issues were found in these 40 actions, as summarised in the table below.
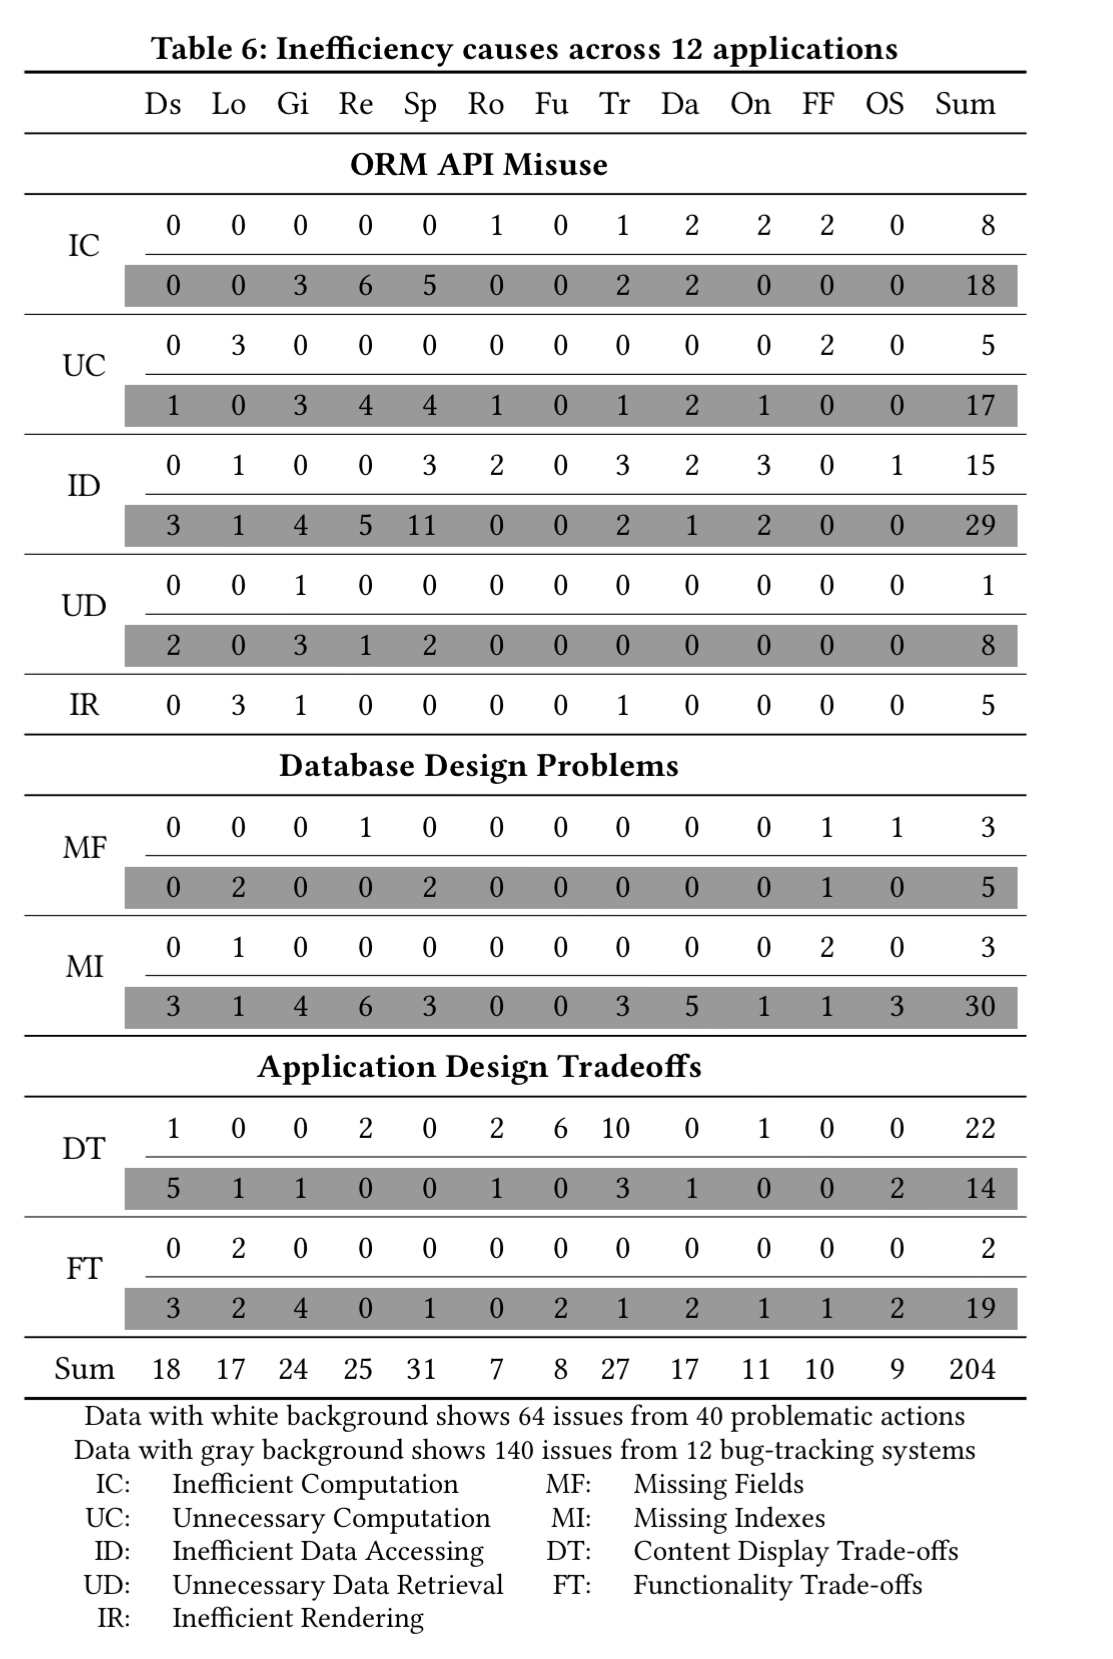
In addition to studying these actions, the authors also look at performance issues reported in the application’s bug trackers.
The causes of inefficiency are categorised into three main areas: ORM API misuse, database design, and application design.
ORM API Misuse
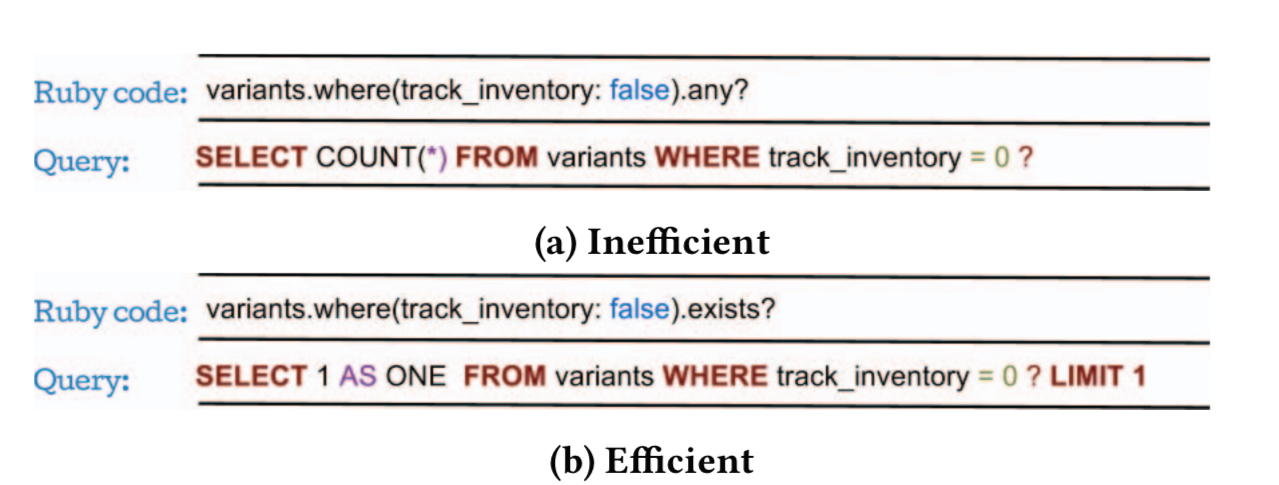
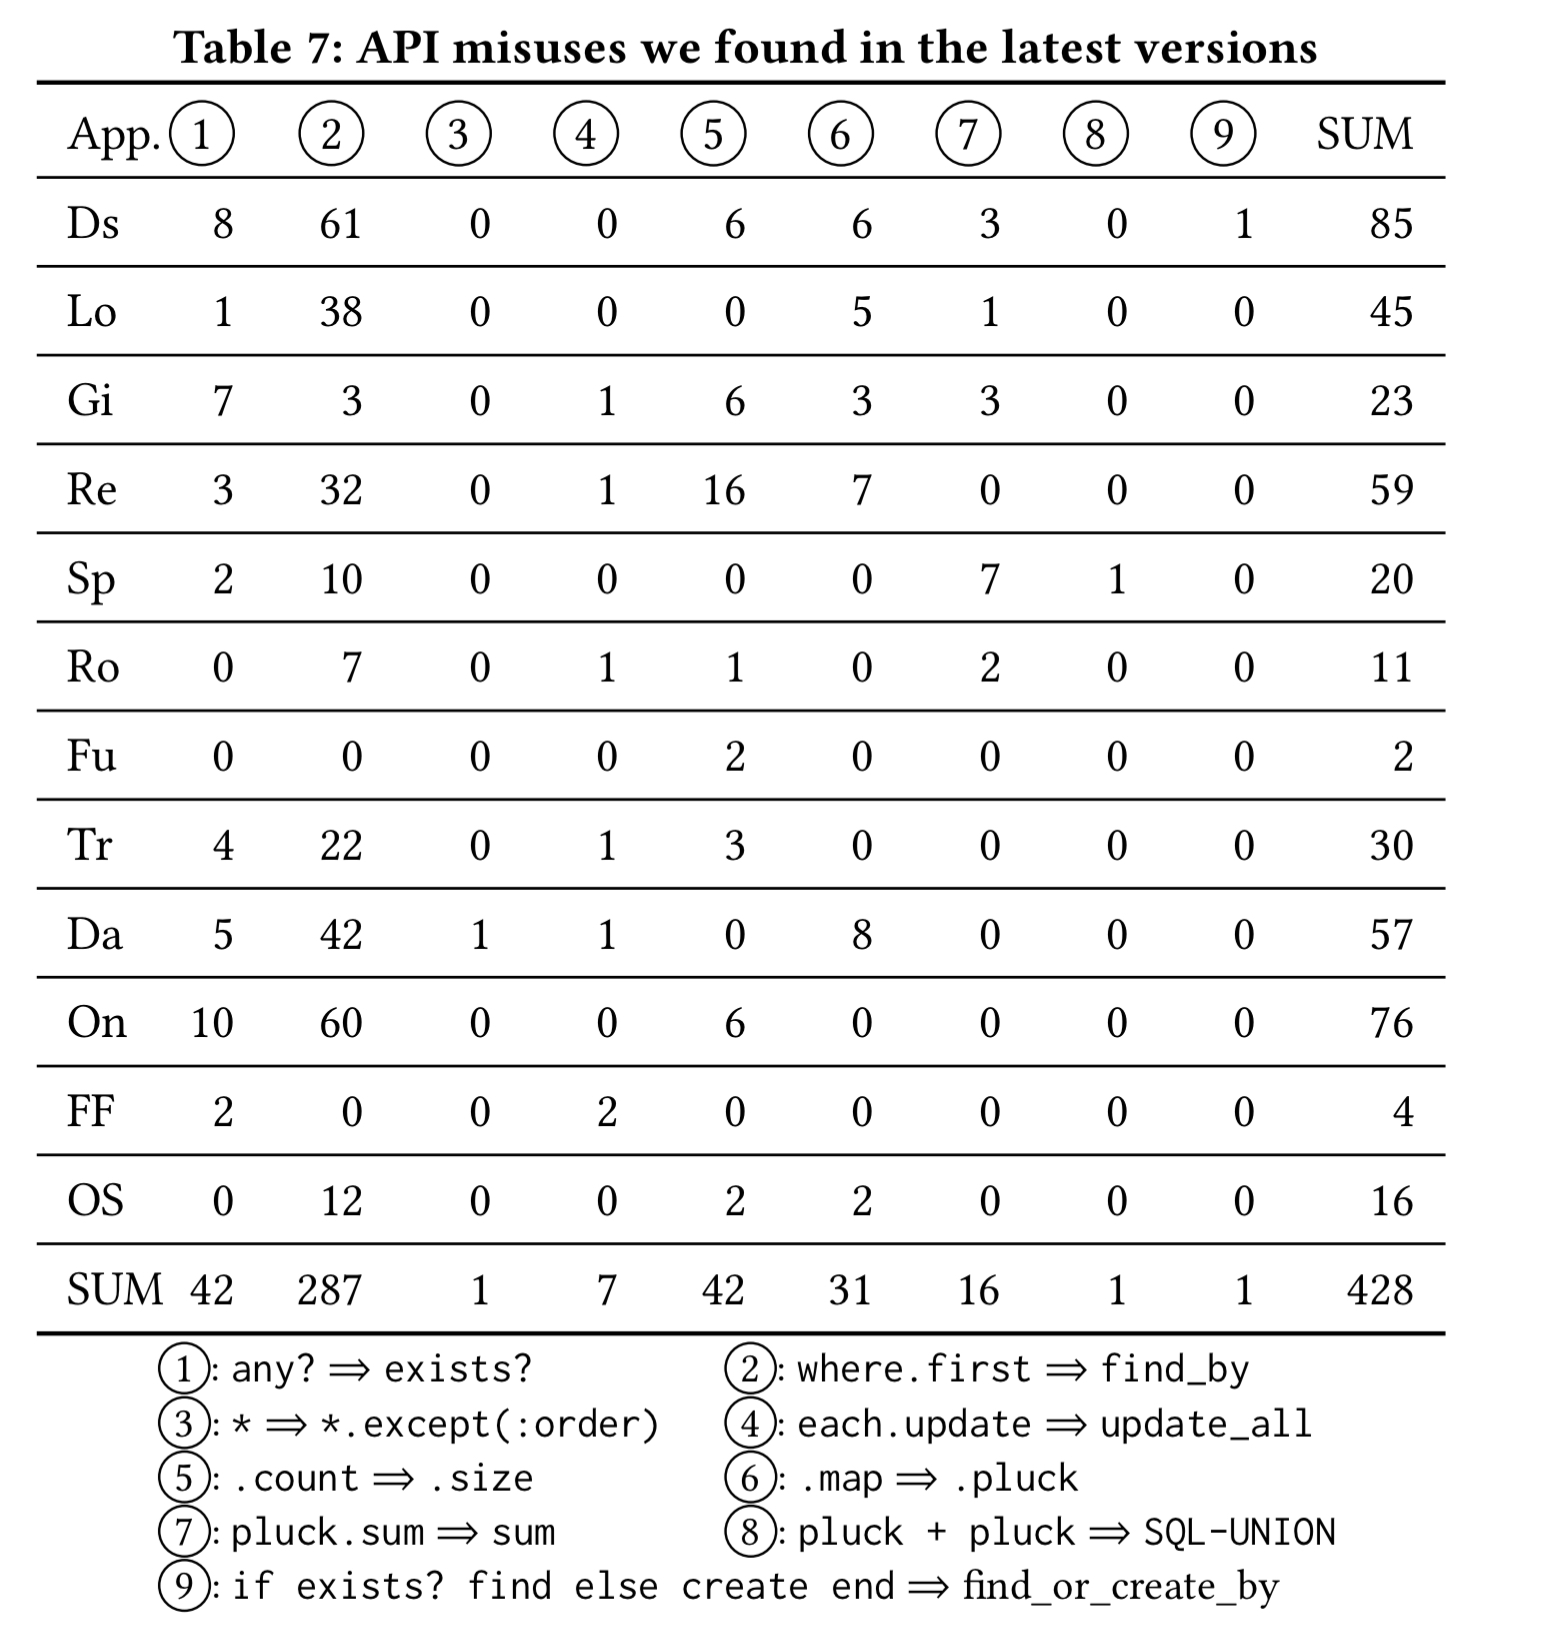
Inefficient computation (IC) occurs when the same operation on persistent data can be implemented via different ORM calls. These often look similar on the surface, but can have very different performance implications. For example the difference between any? (scans all records in the absence of an index) and exists? as shown here. Another example is use of Object.where(c).first instead of Object.find_by(c).
There all also opportunities to move computation to the DBMS, for example, replacing pluck(:total).sum with sum(:total). Sometimes we can also take advantage of data already in memory (e.g. replace Object.count— a db query— with Object.size which will count in-memory objects if they have already been loaded).
Unnecessary Computation (UC) occurs when redundant or useless queries are issued. A classic example is a query inside a loop body, that could be computed once outside the loop body.
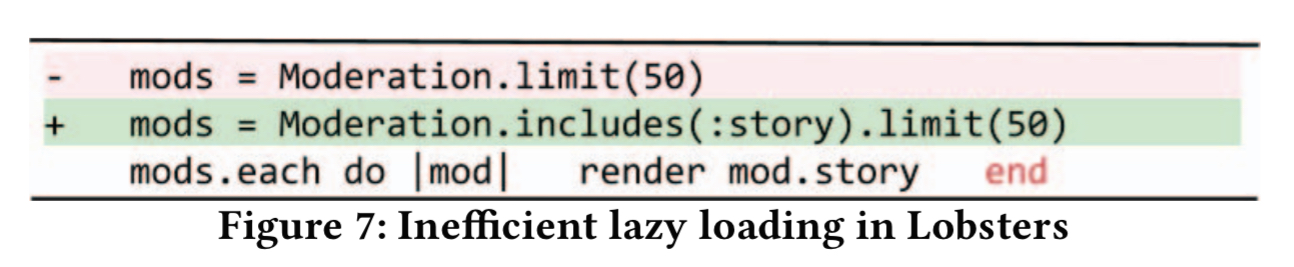
Inefficient data accessing (ID) results in slow data transfers by either not getting enough data (resulting in the familiar N+1 selects problem), or getting too much data. This can be due to inefficient lazy loading (still prevalent in this study), or too-eager eager loading. Here’s an example of a patch in Lobsters that replaces 51 database queries with one:
A similar inefficient updating issue occurs when N queries are issued to update N records separately, instead of using update_all.
Unnecessary data retrieval (UD) occurs when an application retrieves persistent data that it doesn’t then use.
Inefficient Rendering (IR). This one was a surprise to me in the measured impact. It’s very common in Rails to do something like this, which calls link_to within a loop to generate an anchor:
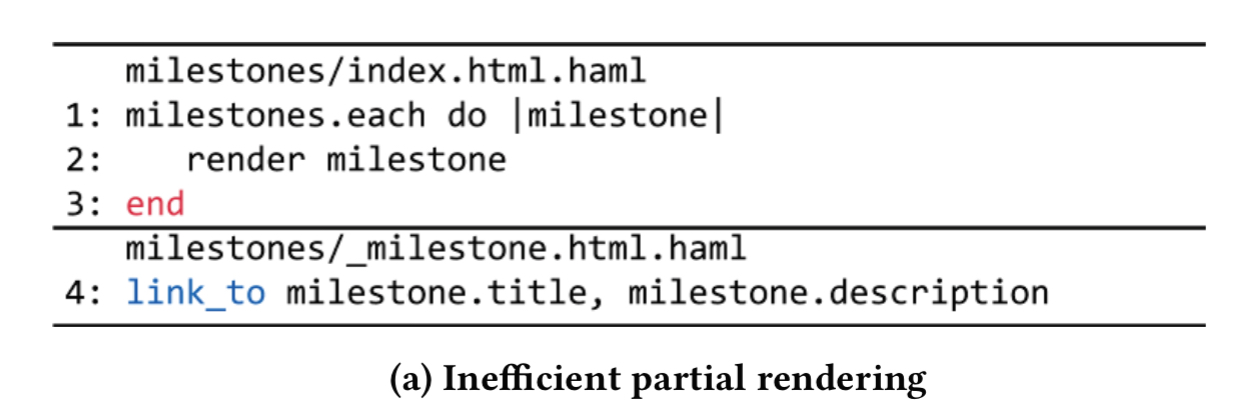
Replacing it with one call to link_to outside of the loop, and the use of gsub within the loop is faster.
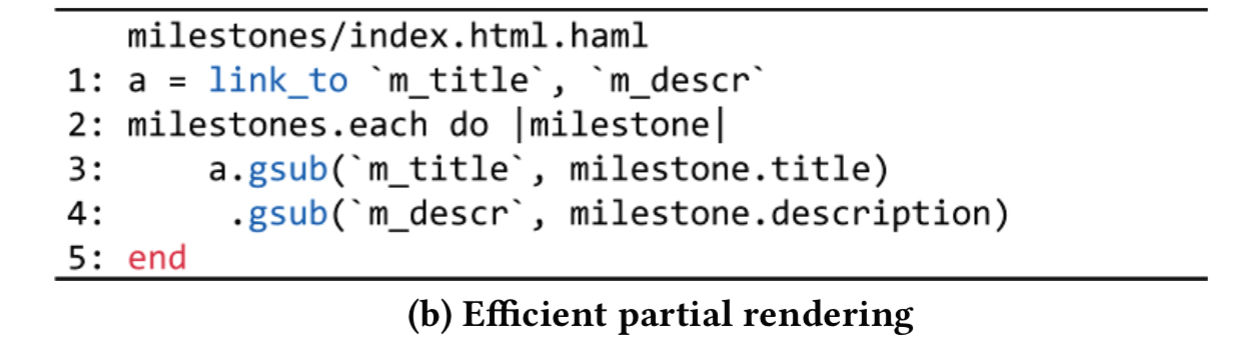
There’s a readability trade-off here, but with complex rendering functions it is clearly worth it. 5 problematic actions in the study dropped their time by over half as a result.
Database design issues
Missing Fields (MF) occurs when an application repeatedly computes a value that it could just store.
Missing Database Indexes (MI). Need I say more?
… missing index is the most common performance problem reported in ORM application’s bug tracking systems. However, it only appears in three out of the 40 problematic actions in latest versions.
Application design issues
Content Display Trade-offs (DT). Typically returning all records instead of using pagination. This becomes a problem as the number of records in the database grows.
Application Functionality Trade-offs (FT). Sometimes an application has a side information on a page that is actually quite expensive to compute. Removing this when it is not essential to the user’s task in-hand can make things go faster.
Fixing inefficiencies
The authors study all 40 of the problematic actions and manually fix 39 of the (the other one spends its time on file-system actions). This leads to 64 fixes being applied.
Many fixes are very effective. About a quarter of them achieve more than 5x speedup, and more than 60% of them achieve more than 2x speedup. Every type of fix has at least one case where it achieves more than 2x speedup.
40 of the 64 fixes alter neither the display nor the functionality of the original application, achieving an average speed-up of 2.2x (maximum 9.2x).
Per a recent comment from Steve Powell, it’s actually quite confusing to talk about a ‘2x speed-up’ when you’re talking about the time something takes! I guess we could interpret this as either 2x requests-per-second (that’s a speed metric) , or that an action takes on average half the time it used to (a ‘/2’ latency reduction?). With a single thread of execution, they both amount to the same thing.
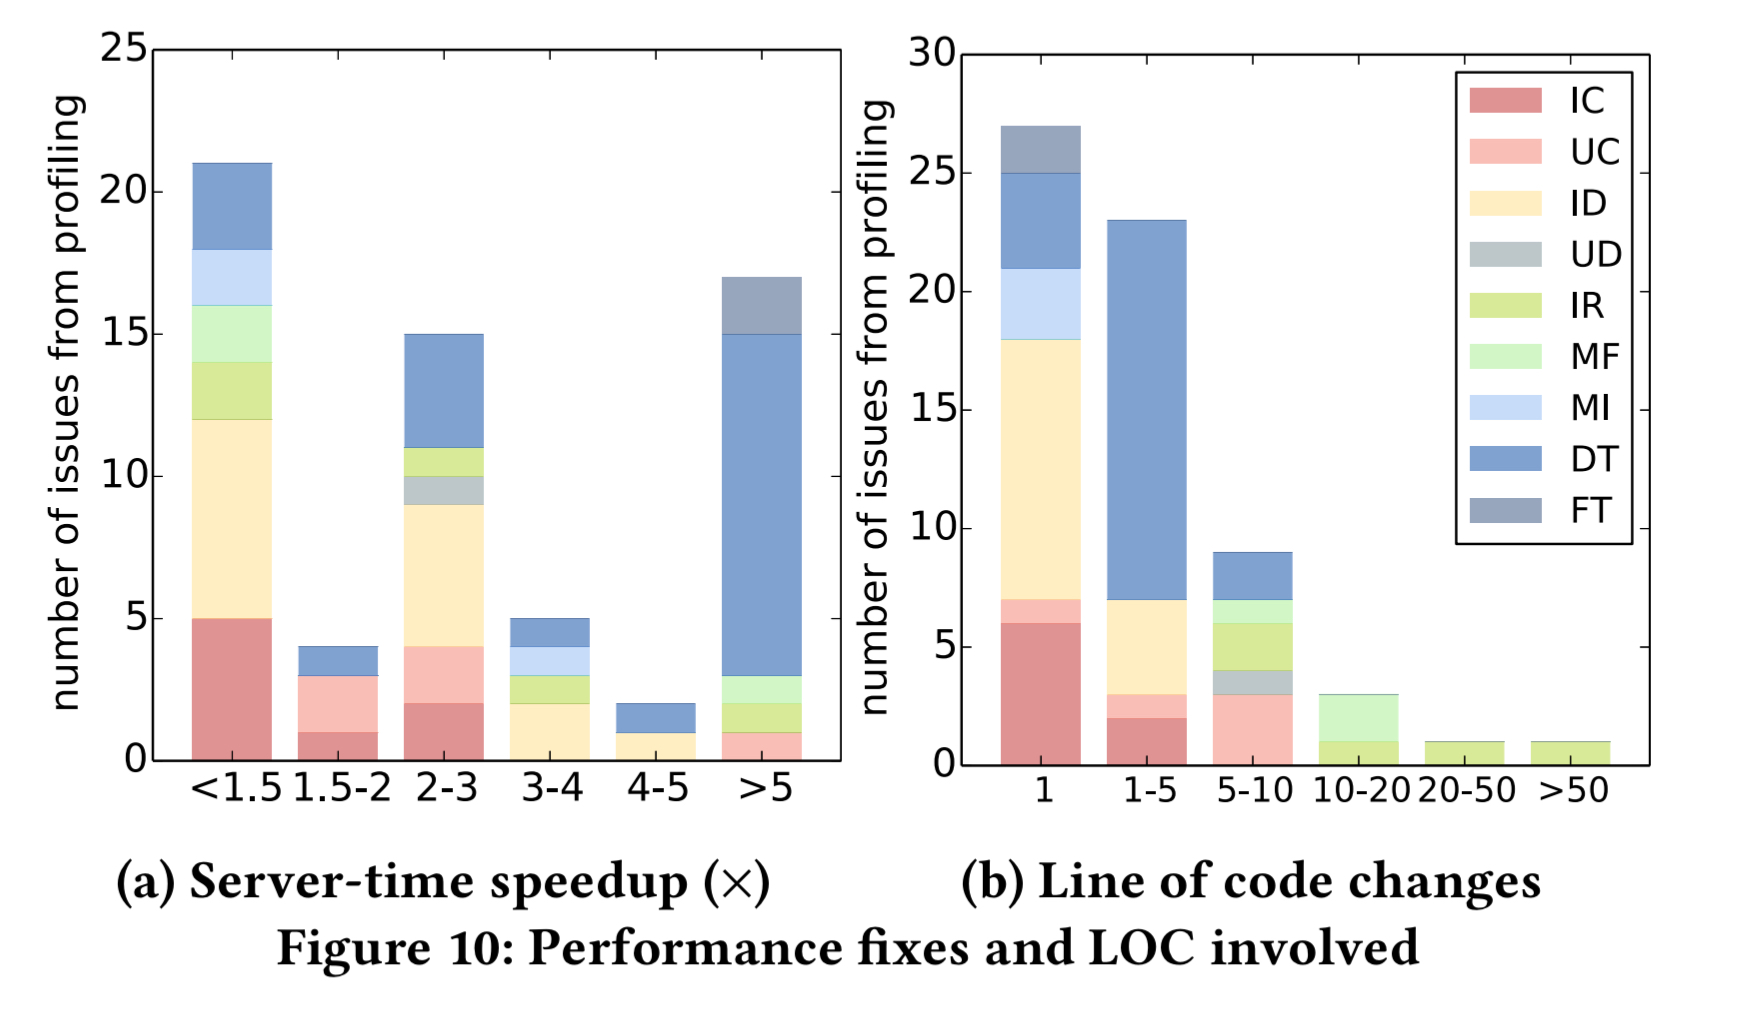
The average server time is reduced form 3.57 seconds to 0.49 seconds, and the end-to-end page load times from 4.17 seconds to 0.69 seconds. More than 78% of fixes require fewer than 5 lines of code.
In other words, by writing code that contains the anti-patterns discussed earlier, developers degrade the performance of their applications by about 6x.
The authors wrote a static analyser (you can find it here) that looks for some of the simple API misuse patterns and ran it on the latest versions of the 12 ORM applications. There are still plenty of incidences! (Some of these in actions that weren’t identified as worse performing actions during profiling of course).
By profiling the latest versions of 12 representative ORM applications and studying their bug-tracking systems, we find 9 types of ORM performance anti-patterns and many performance problems in the latest versions of these applications. Our findings open up new research opportunities to develop techniques that can help developers solve performance issues in ORM applications.
Now if you’ll excuse me, I’ve got a Ruby codebase I just need to go and look at…

Looks like in Rails .any? calls .exists? https://github.com/rails/rails/blob/5a1ea09062eaed78e21253a128d433a1beb745ad/activerecord/lib/active_record/relation.rb#L246-L262
Reblogged this on slash dev slash null and commented:
The case against ORM continues in this study of performance bugs in the wild.
What you want is jOOQ. Cheers, Lukas :)
Just tested .any? and .first and Rails limited (i think since AR4, but tested in AR 5.1).
I don’t think this really shows that ORM’s are bad. It only shows that you need to know more than the basics.
It barely scratches the surface of how bad ORMs are.
Awesome content.
I don’t think this really shows that ORM’s are bad. It only shows that you need to know more than the basics.
The only database design problems with an ORM are “missing fields” and “missing indexes”? This is barely the tip of the iceberg on the pathologies caused by using ORMs. The uncontrolled redundancy between tables under an ORM is a nightmare, and when you add the endemic misuse of integer “handles” for primary keys and no natural keys, the redundancy within tables is a mess.
Forget performance bugs. Start recognizing database design and tuning for the high-value specialization that it is. A good database professional can tune practically any operation on a well-normalized database. When ORMs exclude database design and normalization, you won’t care how fast you run because you’re corrupting your data and getting bad answers.
I second that! I’ve been focusing on DA skills for sometime but have recently decided to just give up. Nobody cares about database design anymore.
That is an extremely smartly written article and this is exactly what I was looking for. Good motivational advice, just what I need. Thanks
nice coding api
Interesting article. Any suggestions about the commercially available solutions.