A century of science: globalization of scientific collaborations, citations, and innovations Dong et al., KDD’17
This is more of a general interest paper as a light-hearted way to end the week. A team at Microsoft conducted analyses on the Microsoft Academic Graph to understand the changing nature of science over the course of the last century. The overall graph contains more than 100M publications, and the largest connected component has 53M authors, 1.2B author collaboration links, and 795M citation links. The authors within that component published a collective 90M papers.
Some key findings:
- Scientific publication is on an exponential growth path, doubling every 12 years
- Papers increasing have more authors, and collaborations between authors are becoming increasingly international.
- Science has become increasingly globally diverse
The changing nature of scientific collaboration
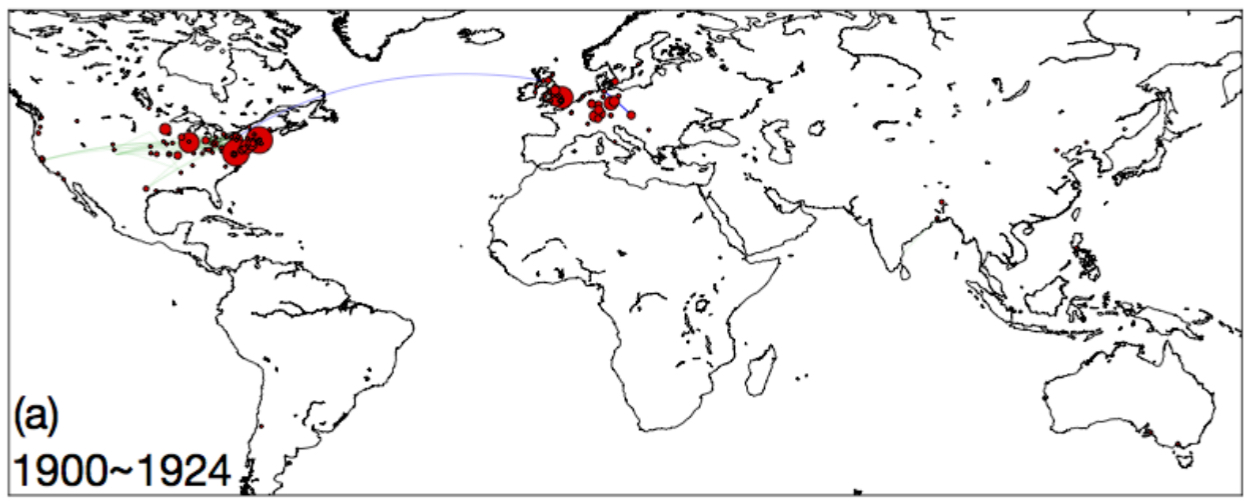
A century ago, the global science map looked like this (red circles are most-cited institutions, blue lines represent collaboration between institutions):
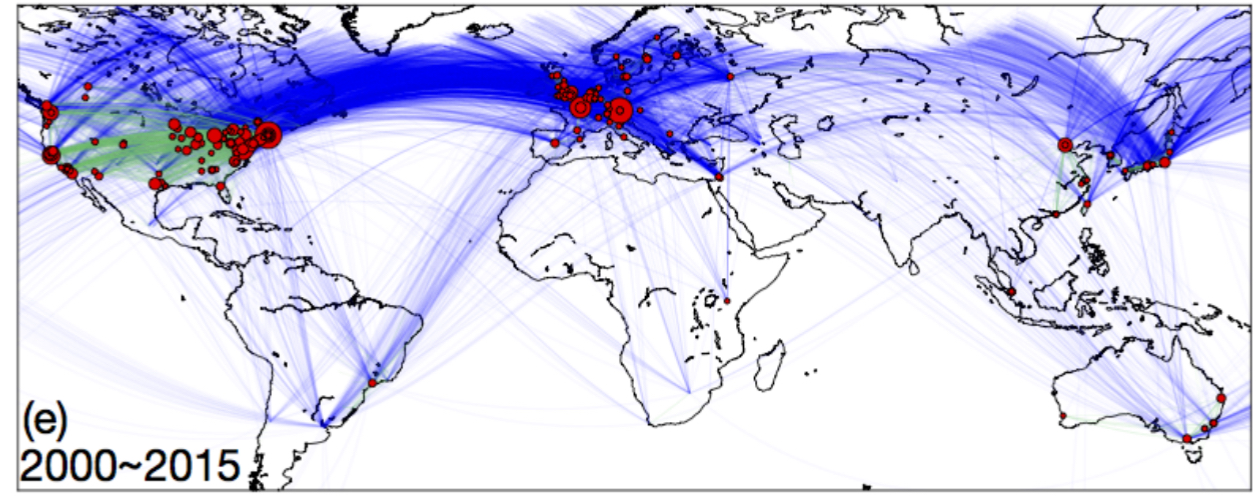
Whereas today it looks like this:
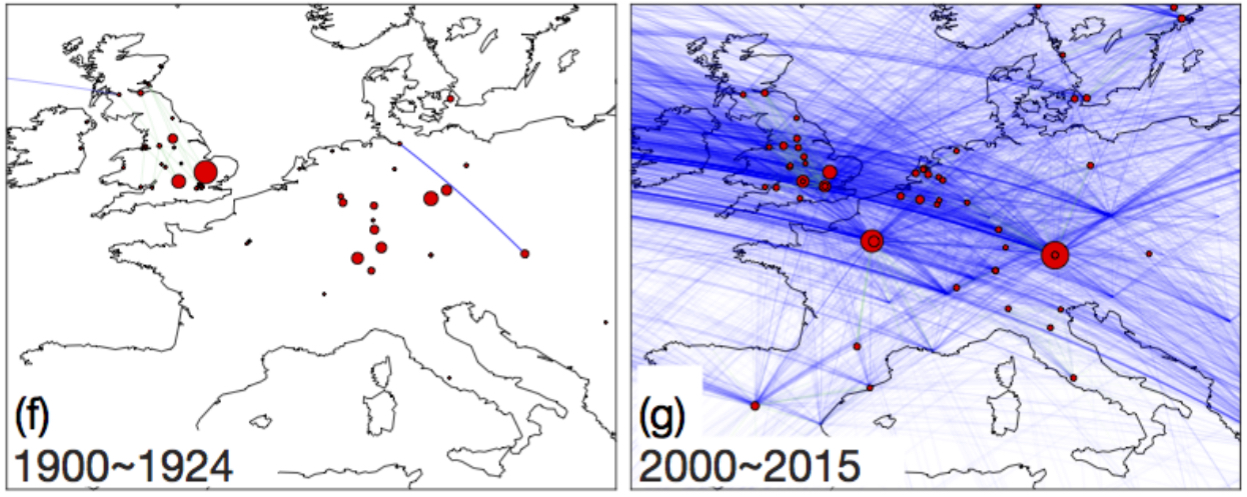
We see a similar story if we zoom in on Europe:
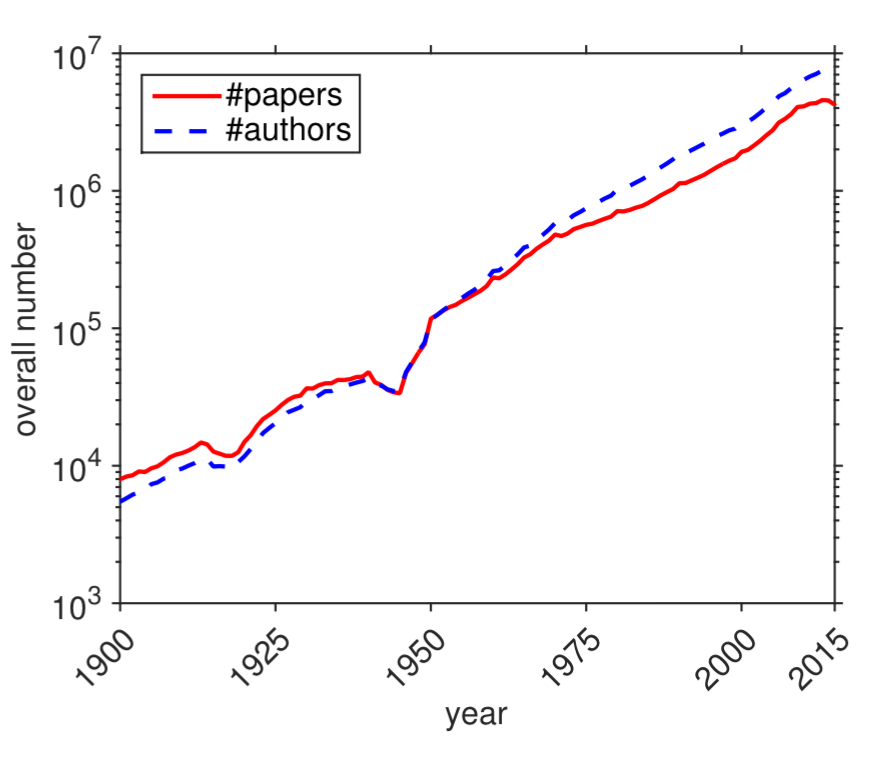
Underlying growth
Behind these charts is a story of exponential growth, with the number of scholars producing papers doubling every 11 years, and the number of papers published doubling every 12 years. We’re well on our way to 10M published papers a year from the look of this chart!
If you dig a bit deeper though, you’ll find that individual scientists are no more productive (as measured by papers!) than they used to be: the average scientist publishes two papers a year, and that number has stayed fairly constant. Since the numbers of collaborators on any given paper has been going up though, the papers-per-author rate when looking at the field as a whole is actually going down.
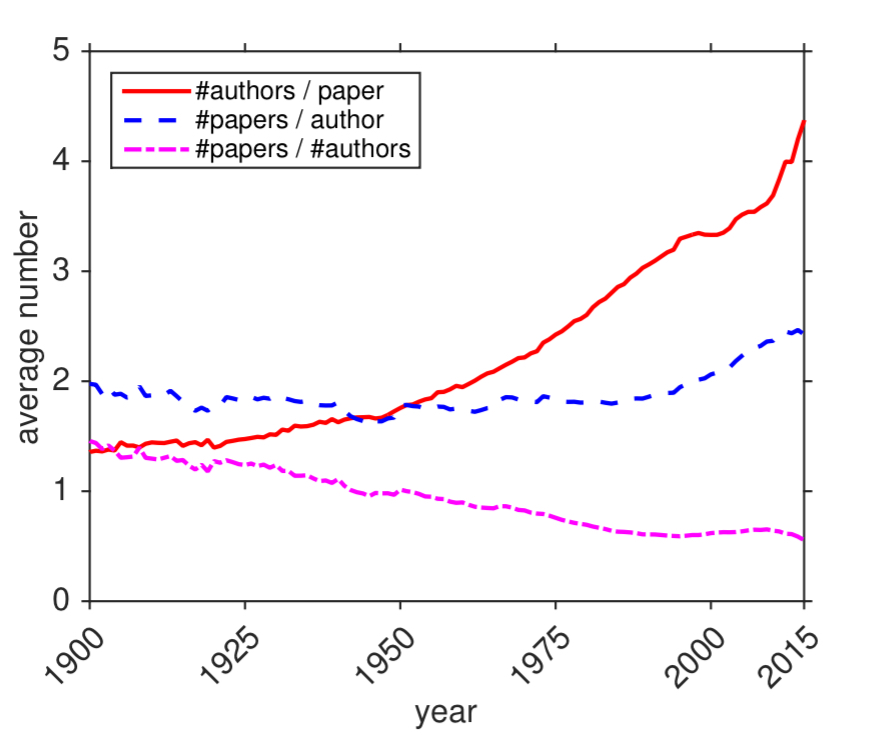
From the perspective of collaboration, we find that the average length of a publication’s author list tripled between 1900 and 2015, suggesting an increasingly collaborative scientific process. We discover that the rate of international collaborations has increased 25-fold over the past 116 years, revealing the globalization of scientific collaborations.
Citations
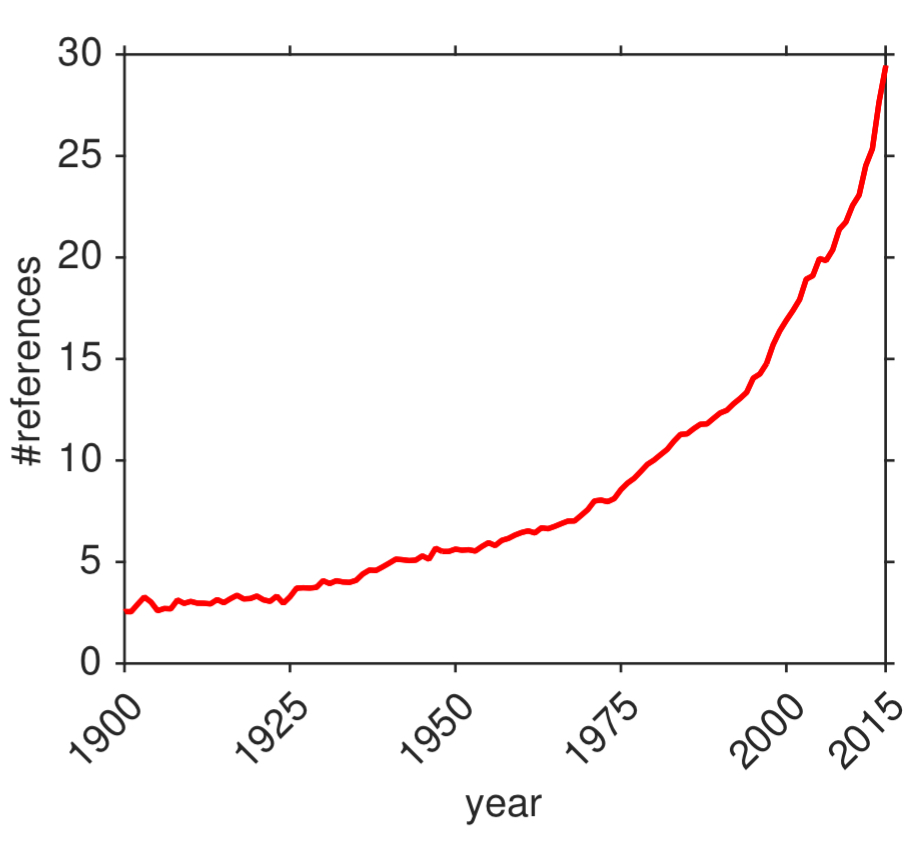
Paper reference lists have been getting steadily longer, from 2-3 references in the 1900s, to an average of 30 references today. Of course, there’s also more prior work available to cite these days.
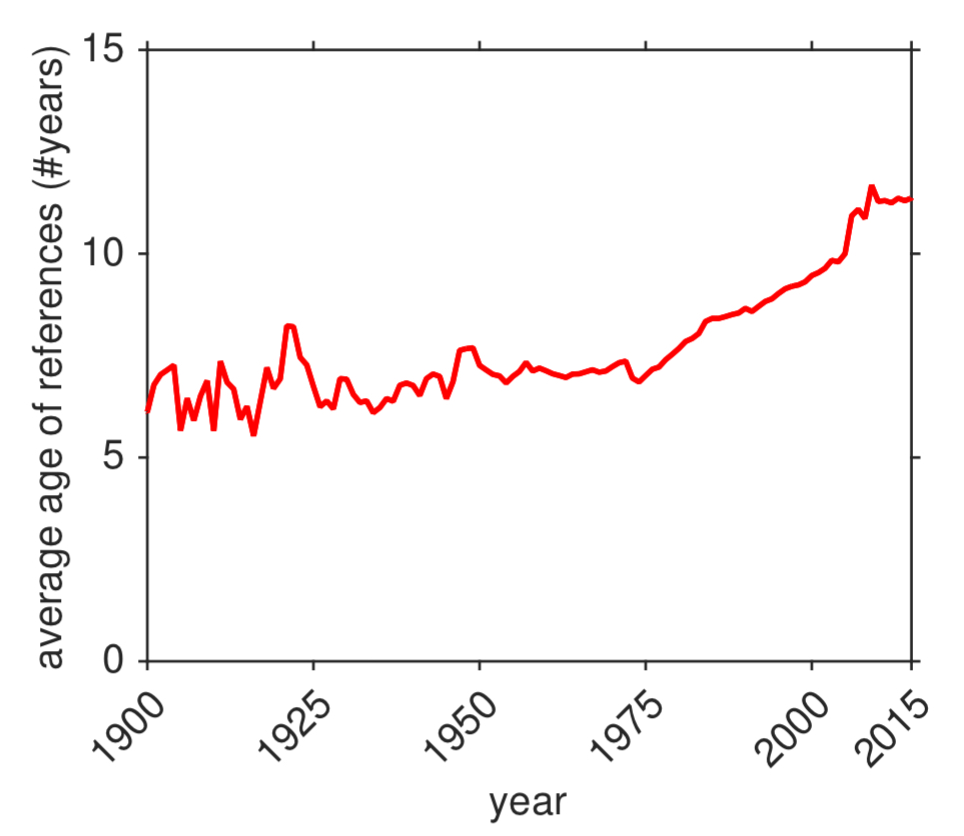
Scientists are also looking further back in time for their references (perhaps to cite the foundational papers in an area?). The start of peer review in the 1960s is another factor here.
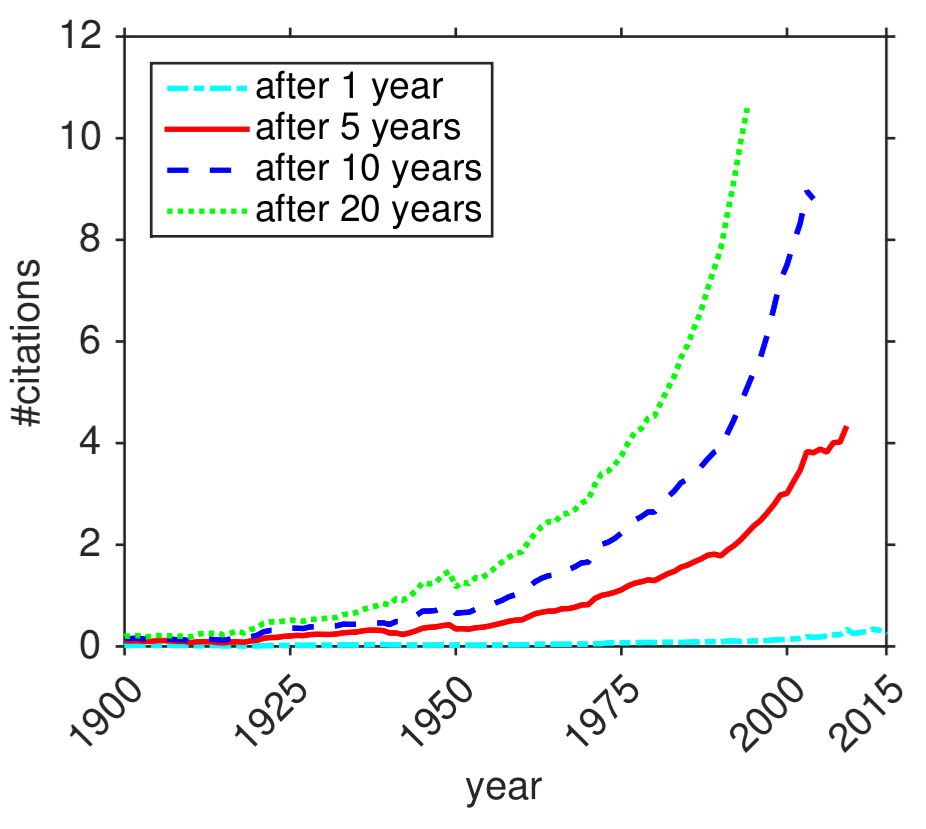
Because reference lists are getting longer, it’s not totally surprising that citations per paper is also increasing:
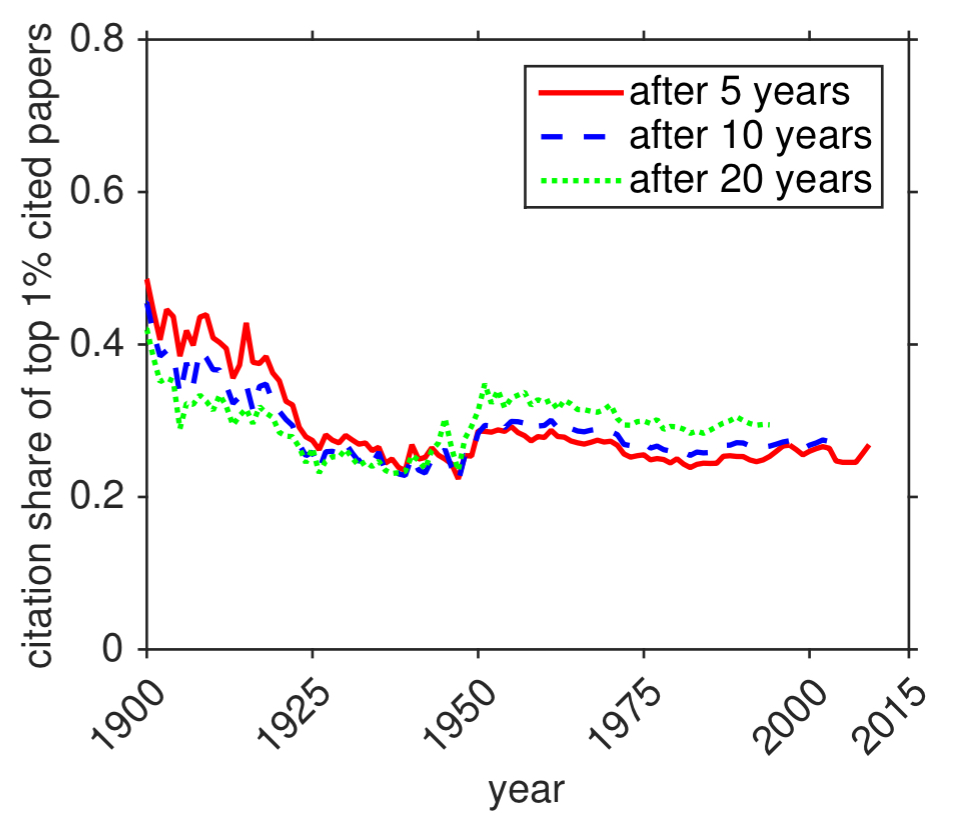
If we look at the top 1% most cited publications each year, they are responsible for about 25% of all citations within the year. (I’d expect this distribution to follow Zipf’s law or similar).
Top institutions
Between 1900 and 1924, the most cited institutions were Harvard, John Hopkins, Cambridge, and the University of Chicago. Today the honours go to Harvard, Max Plank Society, National Institutes of Health, the French Center for Scientific Research, and Stanford.
In addition, the gap between institutions in Asia and Australia and the top-most institution in the world – Harvard – has decreased from the last century to the current, demonstrating the rapid rise of scientific impact in the Asia-Pacific region during the past 16 years.
Since readers of this blog are probably interested in computer science (or very bored!), here are the 2017 QS world university rankings for computer science. The ranking very much depends on your criteria of course, here’s another list compiled by the Times Higher Education Supplement: Computer Science world university rankings 2016-17.
