Bringing IoT to sports analytics Gowda et al., NSDI 17
Welcome back to the summer term of #themorningpaper! To kick things off, we’ll be looking at a selection of papers from last month’s NSDI’17 conference.
We haven’t looked at an IoT paper for a while, and this one happens to be about cricket – how could I resist?! The results are potentially transferable to other ball sports – especially baseball – so if that’s more your thing the results should also be of interest. More generally, it’s an interesting case study in embedding intelligence into everyday objects.
Sports analytics is becoming big business – for broadcasters, coaches, sports pundits and the like. Typically the data for such systems comes from expensive high-quality cameras installed in stadiums.
We explore the possibility of significantly lowering this cost barrier by embedding cheap Inertial Measurement Unit (IMU) sensors and ultrawide band (UWB) radios inside balls and players’ shoes. If successful, real-time analytics should be possible anytime, anywhere. Aspiring players in local clubs could read out their own performance from their smartphone screens; school coaches could offer quantifiable feedback to their students.
A high-end camera network can cost upwards of $10,000, whereas the system developed in this paper (iBall) has an overall cost of around $250. Furthermore, it’s the first serious IoT-based effort to “accurately characterize 3D ball motion, such as trajectory, orientation, revolutions per second, etc.“.
For those less familiar with the game, this is cricket:
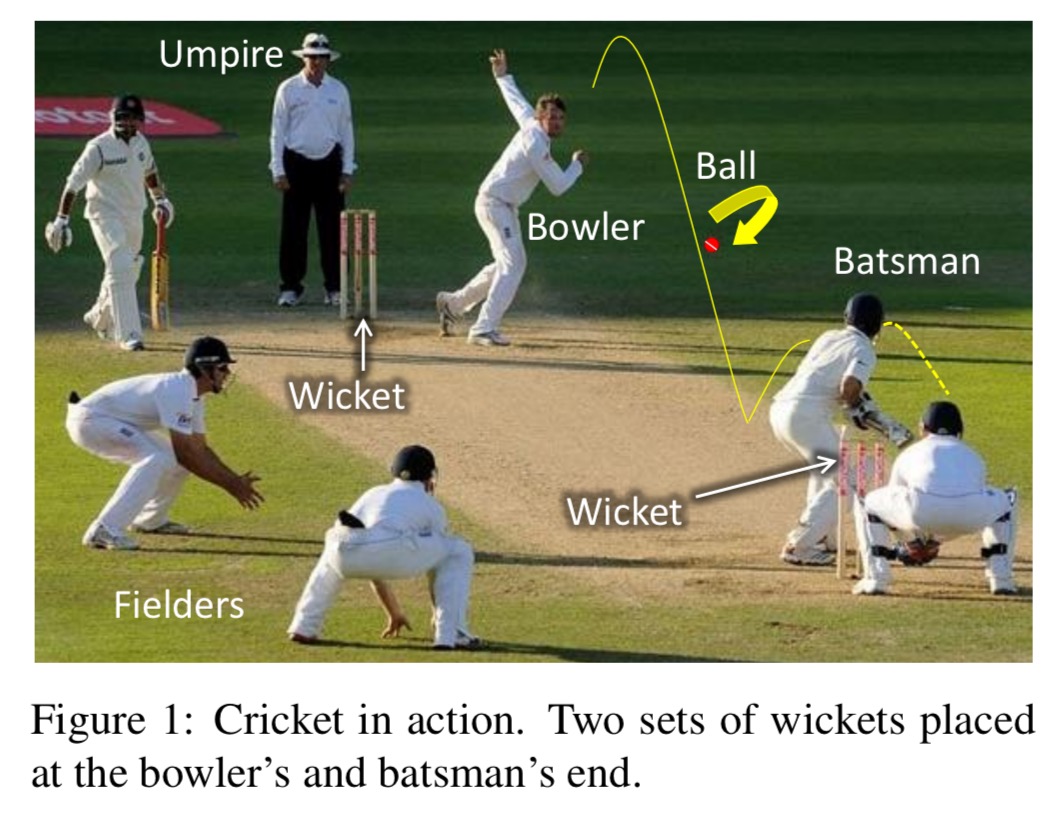
(I never expected to see a figure like that in an CS paper!). The main focus is on ball instrumentation during delivery – speed, flight-path, and spin are all of keen interest in cricket, but the system can also track the path of the ball once hit by the batsman, as well as the location of players on the cricket pitch. It’s still very much a prototype system (evaluated indoors only, with a ball that needs charging every 75-90 minutes, and not fully weight balanced) but there’s a lot of promise here: results from 100 different throws (we call them deliveries) achieved a median location accuracy of 8cm, and orientation errors of 11.2 degrees. Players are tracked with a median error of 1.2m, even when near the periphery of the field (we call it the boundary).
The core of the system is an instrumented ball containing an Intel Curie board with IMU (Inertial Measurement Unit) sensors and a UWB (ultrawide band) radio.
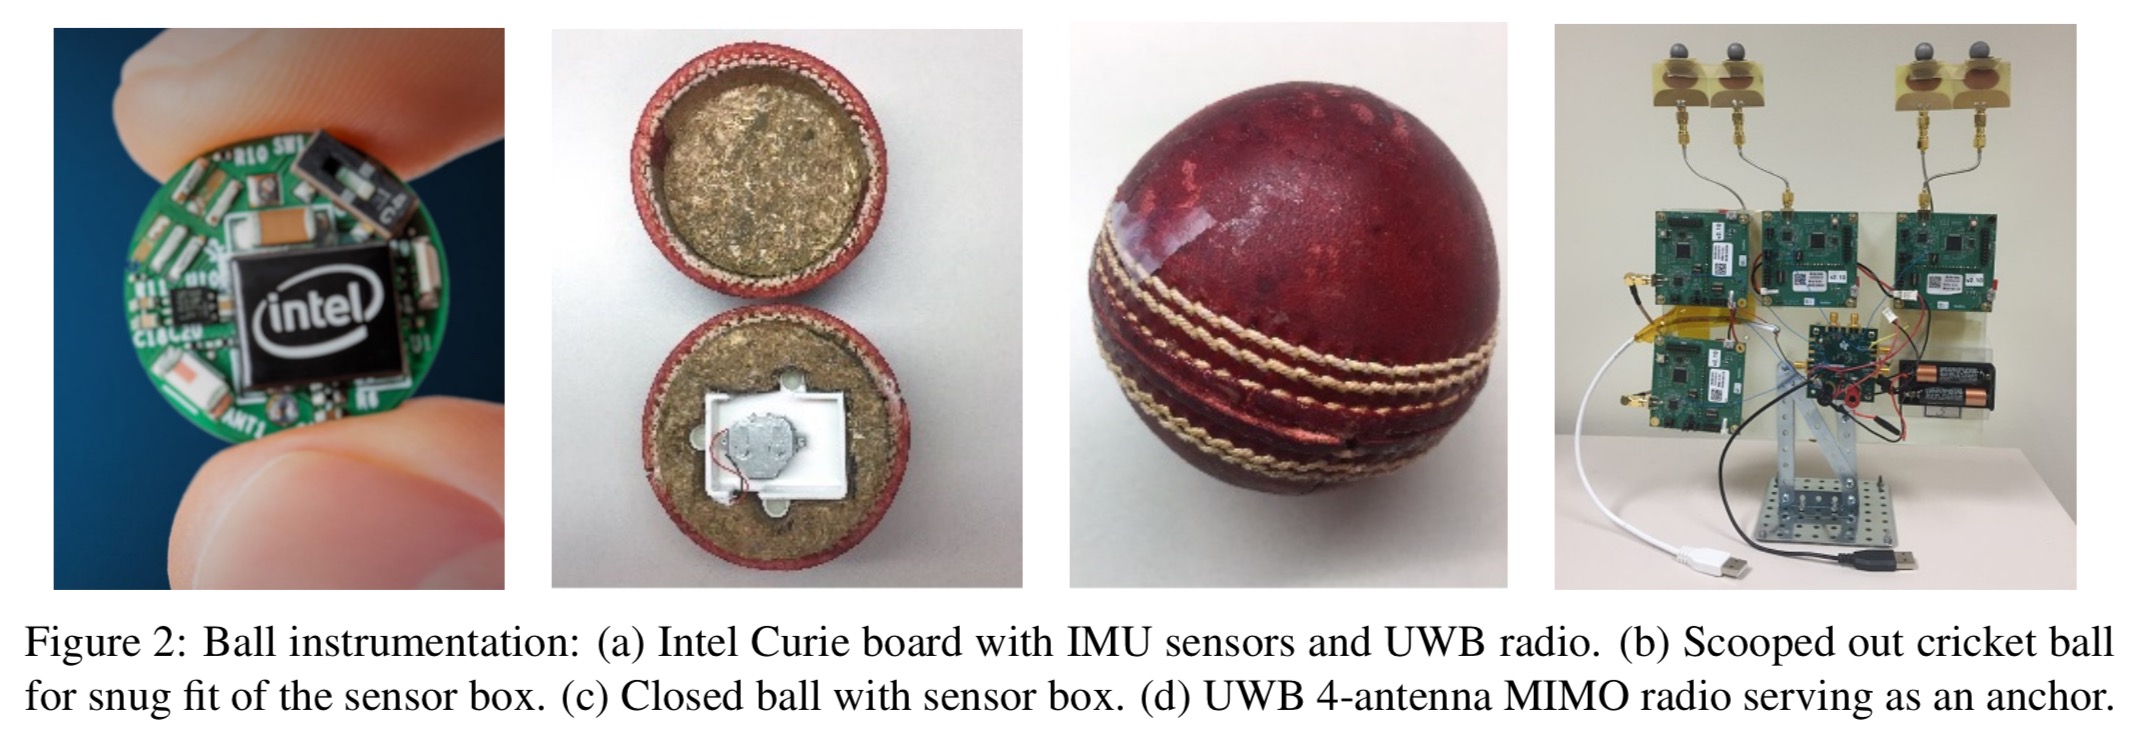
Sensor data is streamed via the UWB anchor to receiving ‘anchors’ located at each wicket:
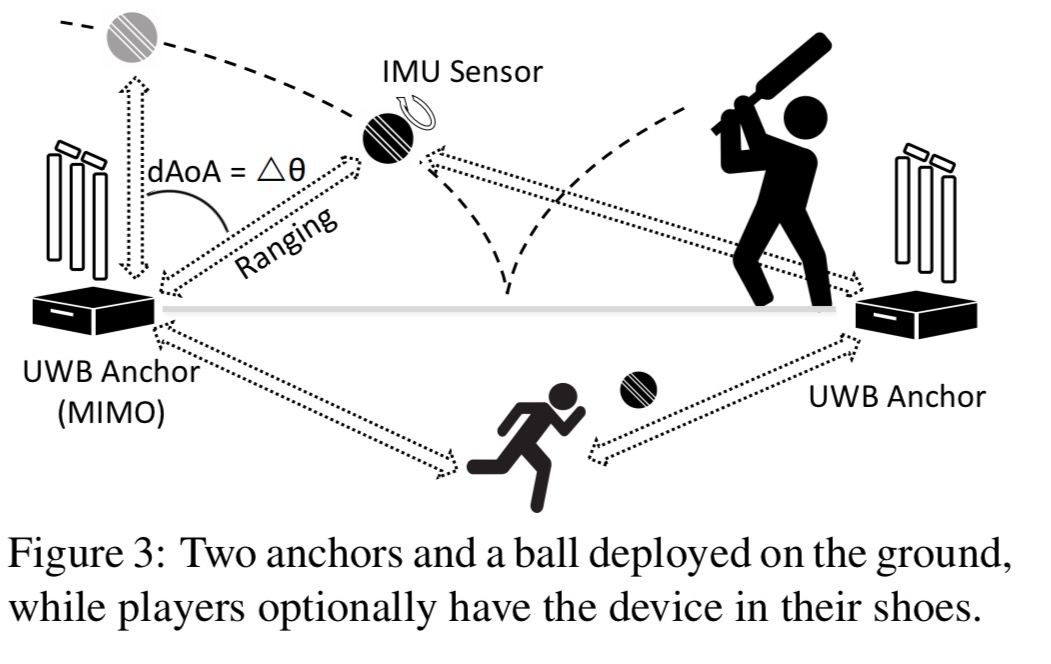
UWB signals are exchanged between the ball and anchors to compute the ball’s range as well as the angle of arrival (AoA) from the phase differences at different antennas. The range and AoA information are combined for trajectory estimation. For spin analytics, the sensors inside the ball send out the data for off-ball processing. Players in the field can optionally wear the same IMU/UWB device (as in the ball) for 2D localization and tracking.
Let’s look next at the challenges involved in spin tracking, trajectory tracking, and player tracking.
Spin tracking
Three main spin-related metrics are of interest to Cricketers: (1) revolutions per second, (2) rotation axis, and (3) seam plane. From a sensing perspective, all these 3 metrics can be derived if the ball’s 3D orientation can be tracked over time.
You might initially think that gyroscopes and accelerometers would be great for this: but gyroscopes can only cope with spins up to about 5rps (while professional bowlers can generate spin of over 30rps), and gravity is not measured in accelerometers during free-fall. This leaves magnetometers. When the ball is in-flight, in the absence of air drag, the ball’s rotation will be restricted to a single axis throughout the flight. Furthermore, from the ball’s local reference frame, the magnetic north vector spins around some axis. This means that a magnetometer can infer both the magnitude and direction of rotation.
With air drag, the ball experiences an additional rotation along a changing axis: the ball continues to spin around the same vertical axis, but the seam plane gradually changes to lie on the vertical plane – this is called “wobble.”
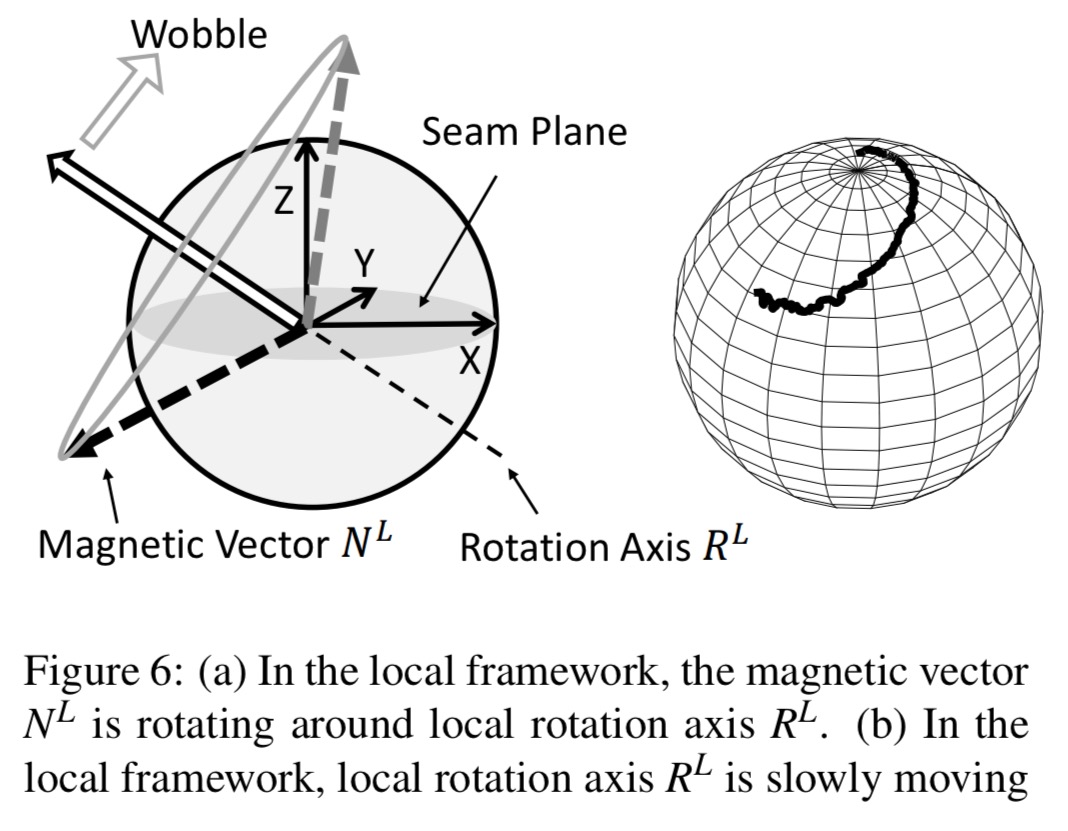
The rotation of the magnetic vector traces out a cone which can be approximated from three successive measurements, this enables estimation of the local rotation (wobble).
… we model the motion of a moving cone, under the constraints that the center of the cone is moving on a quadratic path and that the cone angle is constant. We pick the best 6 parameters of this model that minimize the variance of the cone angles as measured over time.
To measure the global rotation (the spin imparted by the bowler), iBall uses sensor measurements from just before the bowler releases the ball. Here the gyroscope and accelerometer are both useful (angular velocity saturates the gyroscope only at the last few moments before ball release).
Gyroscope dead-reckoning right before ball release, combined with local rotation axis tracking during flight, together yields the time-varying orientation of the ball.
Trajectory tracking
In addition to spin, we’re also interested in the bowler’s line, length, and speed (length is the distance to the first bounce). These are all derivatives of the ball’s 3D trajectory.
Our approach to estimating 3D trajectory relies on formulating a parametric model of the trajectory, as a fusion of the time of flight (ToF) of UWB signals, angle of arrival (AoA), physics motion models, and DoP constraints (explained later). A gradient decent approach minimizes a non-linear error function, resulting in an estimate of the trajectory.
The time of the first bounce is easy to determine via the accelerometer, and forms a useful constraint on the possible trajectories (we know the ball is at height 0 when it hits the ground). The overall time of flight can be computed via the UWB radios, which offer time resolution at 15.65ns.
Briefly, the ball sends a POLL, the anchor sends back a RESPONSE, and the ball responds with a FINAL packet. Using the two round trip times, and the corresponding turn-around delays, the time of flight is computed without requiring time synchronization between the devices. Multiplied by the speed of light, this yields the ball’s range.
With only 2 anchors, both at ground level, we can’t resolve the 3D location of the ball though. We know the distance from the two anchors, and the ball could lie on any intersection of spheres with these radii.
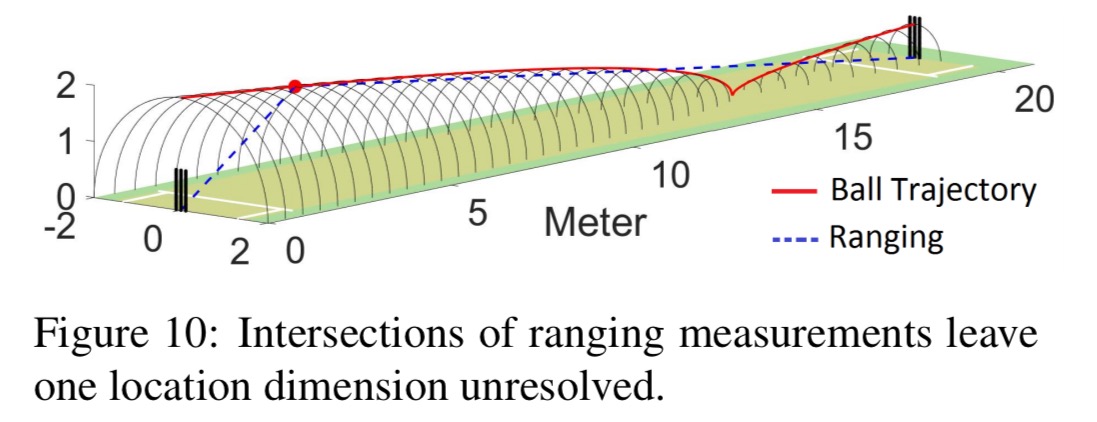
As mentioned previously, we have the bouncing constraint to help pin down part of the flight path. A simple physics model (remember e.g. ?) further constrains the flight path. The initial ball release location is assumed to be within a 60cm cube, as a function of the bowler’s height. Given these constraints, a model is fitted using gradient descent, the median ranging error is only 3cm.
It just remains to translate range to location, unfortunately we lose accuracy here due to a phenomenon known as dilution of precision.
Ideally, the intersection of two UWB range measurements (i.e., two spheres centered at the anchors) is a circle – the ball should be at some point on this circle. In reality, ranging error causes the intersection of spheres to become 3D “tubes”. Now, when the two spheres become nearly tangential to each other, say when the ball is near the middle of two anchors, the region of intersec-tions becomes large. Fig.13(b) shows this effect. This is called DoP and seriously affects the location estimate of the ball.
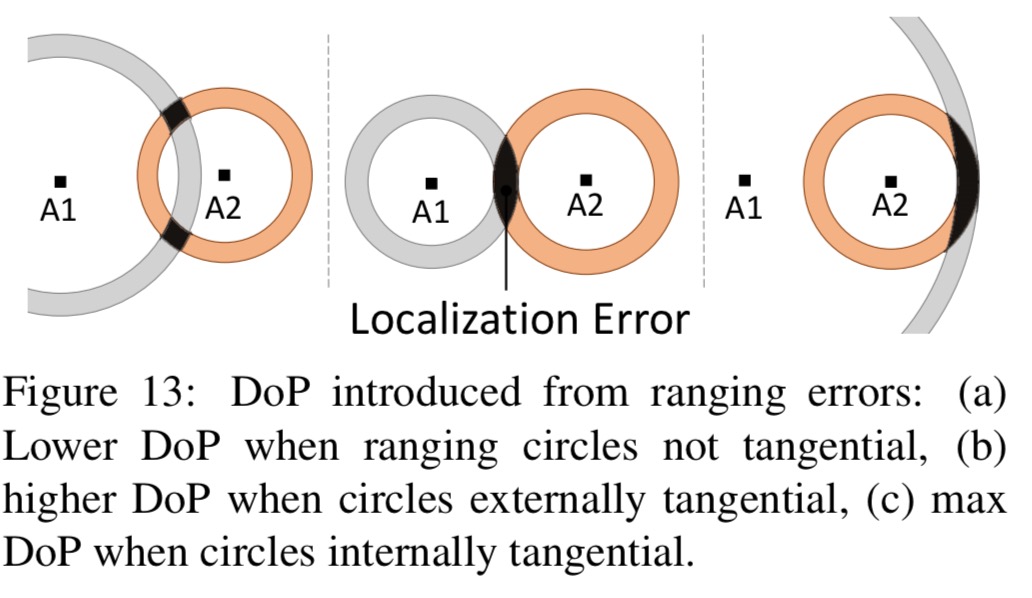
In the middle of the flight, the 90th percentile error can be on the order of 80cm (median ~40cm). To account for this, errors in the minimisation function are weighted so that less importance is given to range measurements where the DoP effect is large. This brings the median error back down to 16cm once more.
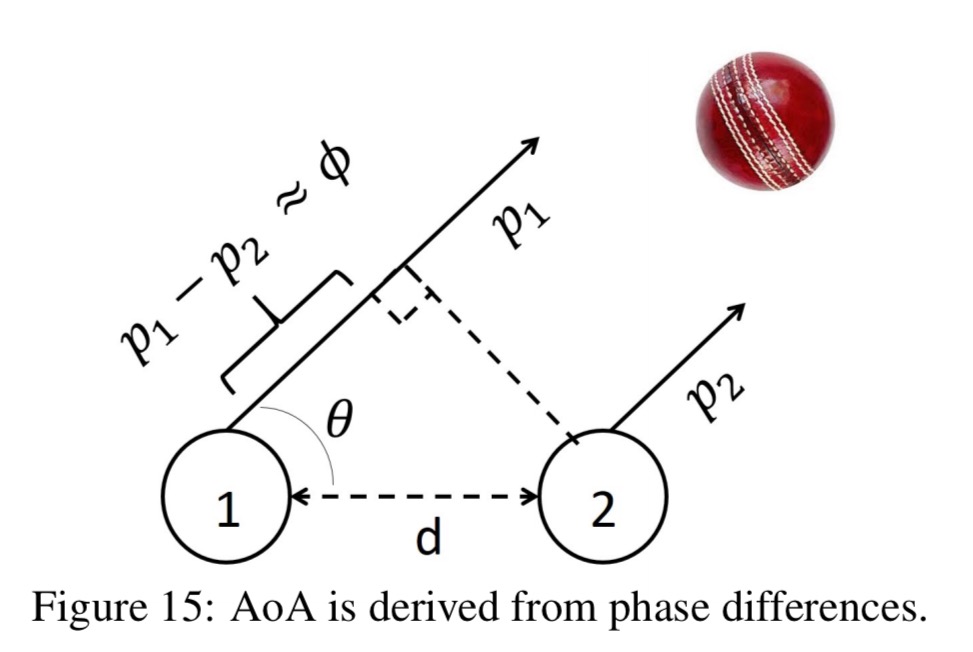
Precision is further increased by incorporating angle of arrival (AoA) measurements from a MIMO receiver in the bowler side anchor (the batsman interferes with signal at the batsman’s end). See section 4.5 for details.
Player tracking
Player tracking is relatively straightforward using e.g. clip-on UWB devices. A challenge arises due to the DoP effect again when the players are in line with wicket – close to this axis, the 90th percentile location uncertainty increases to 15m. To reduce this, the accelerometer is used to detect when a player is running, with velocity estimated using Kalman Filtering. The motion model is combined with the UWB ranging estimates. “iBall applies the same techniques to the ball, which can also be tracked after it has been hit by the batsman.”
Evaluation
Evaluation was done indoors so that 8 ViCon IR cameras could be installed on the ceiling to obtain ground truth measurements.
The authors pretended to be cricket players, and threw the ball at various speeds and spins (for a total of 100 throws).
Why only 100 I’m not sure (and it really should be a multiple of six – instead of 50 spin throws and 50 regular throws, it should be 10 overs of spin, and 10 overs of swing/seam/pace bowling… ;) ).
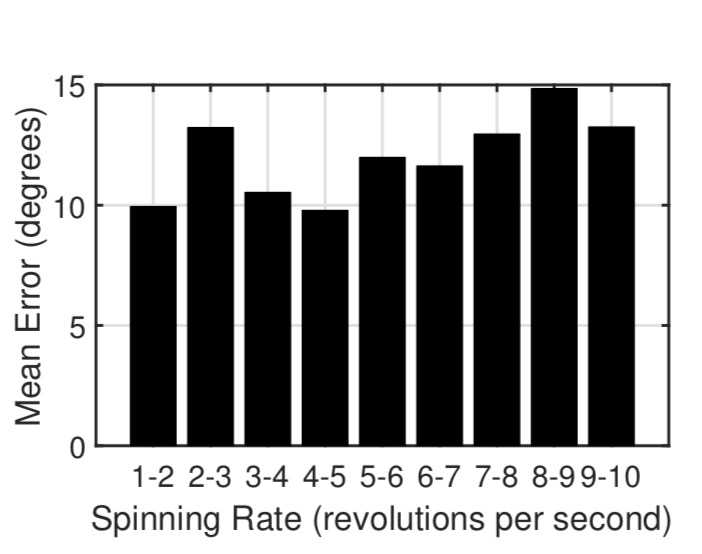
For spin tracking, iBall performs very close to the ViCon ground truth when measuring the cumulative angle error (the total cumulative angle truly rotated by the ball). Across 50 deliveries, a median angular velocity error of 1.0%, and a maximum error of 3.9% is observed. ORE, or orientation error. measures the difference between the estimated and true orientation of the ball at any point in time. The median error here is 11.2 degrees, increasing with spin rate.
For trajectory tracking, iBall achieves a median location error of 8cm. Speed is estimated with a median error of 0.4m/s (0.9 mph). “Upon discussion with domain experts, we gather that this level of accuracy is valuable for coaching and analytics.”
In the x-axis, the iBall trajectory prediction error is always less than or equal to 9.9cm. This means that according the the International Cricket Association, iBall is (just) accurate enough to be used to assist in LBW decisions.
The authors are now turning their attention to baseball and frisbee…
Dude’s bowling a long way outside off stump for that field.
Sachin would whack that out of the park! :P
An additional UWB receiver off-axis (say, half the inter-wicket distance, perpendicular to the bowling line) would dramatically decrease DOP error, no? Add a couple armored receivers just outside the boundary rope (no need to bury them) and player position error would also be significantly reduced…
What is the use of the sensor data and it’s analysis?
Reblogged this on AB's Reflections and commented:
IoT for cricket!
This leaves magnetometers.
This leaves magnetometers.
This leaves magnetometers.
This leaves magnetometers.
A friend of mine and I have been working on implementing such a quantitative feedback to players and have been successful in partnering with a leading cricket goods manufacturer in India. Would like to work with you. If you’re interested, ping me.