Coz: Finding code that counts with causal profiling – Curtsinger & Berger 2015
update: fixed typo in paper title
Sticking to the theme of ‘understanding what our systems are doing,’ but focusing on a single process, Coz is a causal profiler. In essence, it makes the output of a profiler much more useful to you by showing you where optimisations would genuinely have a beneficial effect (which doesn’t always equate with the places programs spend the most time). Interestingly, it can also show you places where locally optimising performance will actually slow down the overall system. That might sound counter-intuitive: the Universal Scalability Law gives us some clues as to why this might be. The understanding gained from finding such locations is also very useful in optimising the application overall.
Conventional profilers rank code by its contribution to total execution time. Prominent examples include oprofile, perf, and gprof. Unfortunately, even when a profiler accurately reports where a program spends its time, this information can lead programmers astray. Code that runs for a long time is not necessarily a good choice for optimization. For example, optimizing code that draws a loading animation during a file download will not make the program run faster, even though this code runs just as long as the download.
The point is nicely illustrated by the following simple program, which starts two threads in parallel and waits for them both to finish.
    void a() {  // takes ~6.7 seconds
      for (volatile size_t x=0; x<2000000000; x++) {}
    }

    void b() {  // takes ~6.4 seconds
      for (volatile size_t x=0; x<1900000000; x++) {}
    }

    int main() {
      thread a_thread(a), b_thread(b);
      a_thread.join();
      b_thread.join();
    }
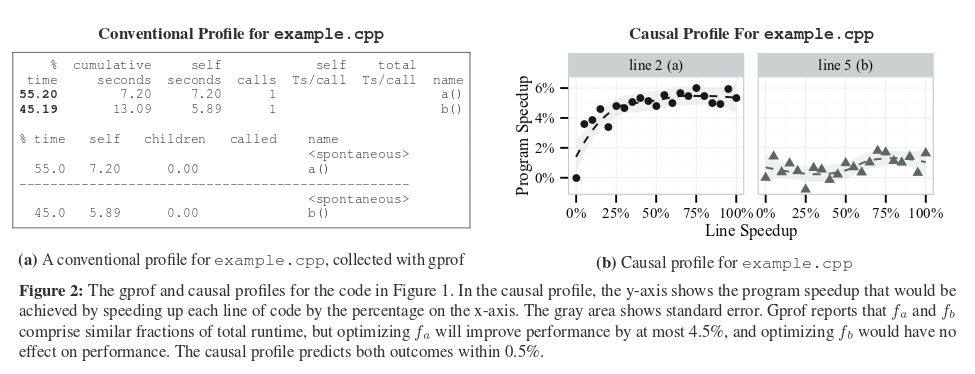
A traditional profiler will tell you that approximately half the execution time is spent in a(), and half in b(). Which is true, but not useful from the perspective of optimising the program. Optimising function a() by eliminating it altogether would only speed up the overall program by 4.5%. Optimising function b() by eliminating it altogether would have no effect!
Coz can show you the true potential for overall program improvement: see the comparison below between the output of gprof and coz for this sample program.
A dramatic example of the ability of Coz to guide developers to places that can make a real difference comes with a SQLite case study: Coz identified three simple functions that resulted in a 25.6% performance improvement, yet a traditional profiler said that these functions accounted for only 0.15% of the total runtime. This kind of breakthrough is very exciting to me!
Coz is very effective at finding optimisations in real programs:
We show that causal profiling accurately predicts optimization opportunities, and that it is effective at guiding optimization efforts. We apply COZ to Memcached, SQLite, and the extensively studied PARSEC benchmark suite. Guided by COZ’s output, we optimized the performance of Memcached by 9%, SQLite by 25%, and six PARSEC applications by as much as 68%. These optimizations typically involved modifying under 10 lines of code. When possible to accurately measure the size of our optimizations on the line(s) identified by COZ, we compare the observed performance improvements to COZ’s predictions: in each case, we find that the real effect of our optimization matches COZ’s prediction.
How Coz works
Coz conducts a series of experiments to evaluate what the potential performance improvement might be if a given line of code could be optimized.
Of course it is not possible to automatically speed up any line of code by an arbitrary amount. Instead, a causal profiler uses the novel technique of virtual speedups to mimic the effect of optimizing a specific line of code by a fixed amount. A line is virtually sped up by inserting pauses to slow all other threads each time the line runs. The key insight is that this slowdown has the same relative effect as running that line faster, thus “virtually” speeding it up… By conducting many performance experiments over the range of virtual speedup from between 0% (no change) and 100% (the line is completely eliminated), a causal profiler can predict the effect of any potential optimization on a program’s performance.
Coz also enables you to understand the potential benefits of performance optimisations as they relate to throughput and latency (in the context of a single process).
To profile throughput, developers specify a progress point, indicating a line in the code that corresponds to the end of a unit of work. For example, a progress point could be the point at which a transaction concludes, when a web page finishes rendering, or when a query completes. A causal profiler then measures the rate of visits to each progress point to determine any potential optimization’s effect on throughput. To profile latency, programmers instead place two progress points that correspond to the start and end of an event of interest, such as when a transaction begins and completes. A causal profiler then reports the effect of potential optimizations on the average latency between those two progress points.
Once the profiler receives a valid line from one of the program’s threads, it chooses a random virtual speed-up between 0 and 100% in increments of 5%.
For any given virtual speedup, the effect on program performance is 1−(ps/p0, where p0 is the period between progress point visits with no virtual speedup, and ps is the same period measured with some virtual speedup s. Because p0 is required to compute program speedup for every ps, a virtual speedup of 0 is selected with 50% probability. The remaining 50% is distributed evenly over the other virtual speedup amounts.
The speedup is implemented via program counter sampling: “COZ periodically samples the program counter and counts samples that fall in the line selected for virtual speedup. Then, other threads are delayed proportionally to the number of samples.”
Rather than using POSIX signals, which would have prohibitively high overhead, COZ controls inter-thread pausing using counters. The first counter, shared by all threads, records the number of times each thread should have paused so far. Each thread has a local counter of the number of times that thread has already paused. Whenever a thread’s local count of pauses is less than the number of required pauses in the global counter, a thread must pause (and increment its local counter). To signal all other threads to pause, a thread simply increments both the global counter and its own local counter. Every thread checks if pauses are required after processing its own samples.
(see the full paper for a number of other important implementation details).
The data collected enables Coz to build up causal profile graphs. These also turn out to be very good at identifying points of contention within the application:
Once causal profile graphs have been generated, it is up to the user to interpret them and make an educated choice about which lines may be possible to optimize. To help the user identify important lines, COZ sorts the graphs by the slope of their linear regression. Steep upward slopes indicate a line where optimizations will generally have a positive impact, while a flat line indicates that optimizing this line will not improve program performance. COZ also finds lines with a steep downward slope, meaning any optimization to this line will actually hurt performance. This downward sloping profile is a strong indication of contention; the line that was virtually sped up interferes with the program’s critical path, and optimizing this line increases the amount of interference. This phenomenon is surprisingly common, and can often result in significant optimization opportunities. In our evaluation we identify and fix contention issues in three applications: fluidanimate, streamcluster, and memcached, resulting in speedups of 37.5%, 68.4%, and 9.4% respectively.
Coz in Action
A series of short case studies towards the end of the paper are very persuasive in demonstrating the benefits of causal profiling.
For SQLLite, Coz identified three optimisation opportunities:
At startup, SQLite populates a large number of structs with function pointers to implementation-specific functions, but most of these functions are only ever given a default value determined by compile-time options. The three functions COZ identified unlock a standard pthread mutex, retrieve the next item from a shared page cache, and get the size of an allocated object. These simple functions do very little work, so the overhead of the indirect function call is relatively high. Replacing these indirect calls with direct calls resulted in a 25.60% ± 1.00% speedup.
gprof was unable to run the SQLite code (segfault), but the Linux perf tool was: it reported the three functions Coz identified accounted for just 0.15% of the total runtime.
Using perf, a developer would be misled into thinking that optimizing these functions would be a waste of time. COZ accurately shows that the opposite is true: optimizing these functions has a dramatic impact on performance.
The fluidanimate case study is interesting because Coz highlights a couple of places where speeding up the code will slow down the overall application:
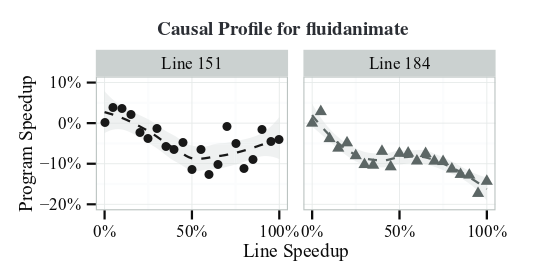
The fluidanimate benchmark, also provided by Intel, is a physical simulation of an incompressible fluid for animation. The application spawns worker threads that execute in eight concurrent phases, separated by a barrier. We placed a progress point immediately after the barrier, so it executes each time all threads complete a phase of the computation. COZ identifies a single modest potential speedup in the thread creation code, but there was no obvious way to speed up this code. However, COZ also identified two significant points of contention, indicated by a downward sloping causal profile. Figure 8 shows COZ’s output for these two lines. This result tells us that optimizing the indicated line of code would actually slow down the program, rather than speed it up. Both lines COZ identifies are in a custom barrier implementation, immediately before entering a loop that repeatedly calls pthread mutex trylock. Removing this spinning from the barrier would reduce the contention, but it was simpler to replace the custom barrier with the default pthread barrier implementation. This one line change led to a 37.5% ± 0.56% speedup.
See §4 of the paper for many other examples of Coz in action.
Our case studies confirm that COZ is effective at identifying optimization opportunities and guiding performance tuning. In every case, the information COZ provided led us directly to the optimization we implemented. In most cases, COZ identified around 20 lines of interest, with as many as 50 for larger programs (Memcached and x264). COZ identified optimization opportunities in all of the PARSEC benchmarks, but some required more invasive changes that are out of scope for this paper… We have submitted patches to the developers of all the applications we optimized.
The average overhead of Coz is 17.6%, which is very good for a profiler.