Improving user perceived page load time using gaze Kelton, Ryoo, et al., NSDI 2017
I feel like I’m stretching things a little bit including this paper in an IoT flavoured week, but it does use at least bridge from the physical world to the virtual, if only via a webcam. What’s really interesting here to me is what the paper teaches us about web page load performance. We know that faster loading pages are correlated with all sorts of user engagement improvements, but what exactly is a faster loading page? If we want faster loading pages because they drive better user engagement, then the ideal page load time metric should correspond with the way that a user perceives page load times. The most popular page load metrics, OnLoad, and Speed Index have the advantage of being easy to measure, but they it turns out they’re not always a good match with the user-perceived page load time, uPLT.
- The OnLoad PLT metric measures the time taken for the browser OnLoad event to be fired (i.e., once all objects on the page are loaded). OnLoad tends to over-estimate page load time because users are often only interested in content ‘above the fold’ (visible without scrolling) when first waiting for a page to load. (Be warned though, with some page structures it can also under-estimate).
- The SpeedIndex PLT metric or Above Fold Time (AFT) measures the average time for all above-the-fold content to appear on the screen. “It is estimated by first calculating the visual completeness of a page, defined as the pixel distance between the current frame and the ‘last’ frame of the Web page. The last frame is when the Web page content no longer changes. Speed Index is the weighted average of visual completeness over time. The Speed Index value is lower (and better) if the browser shows more visual content earlier.” The issue with Speed Index is that it doesn’t take into account the relative importance of content.
The authors conducted a study across 45 web pages and 100 different users using videos of pages loading to ensure that each user saw an identical experience for each page. Additional studies were conducted with simulations of different network speeds. The users were asked to press a key on the keyboard when they perceived the page to be loaded (see section 3 in the paper for full details of the study setup).
Here’s an example of how the different metrics look for the energystar.gov site:
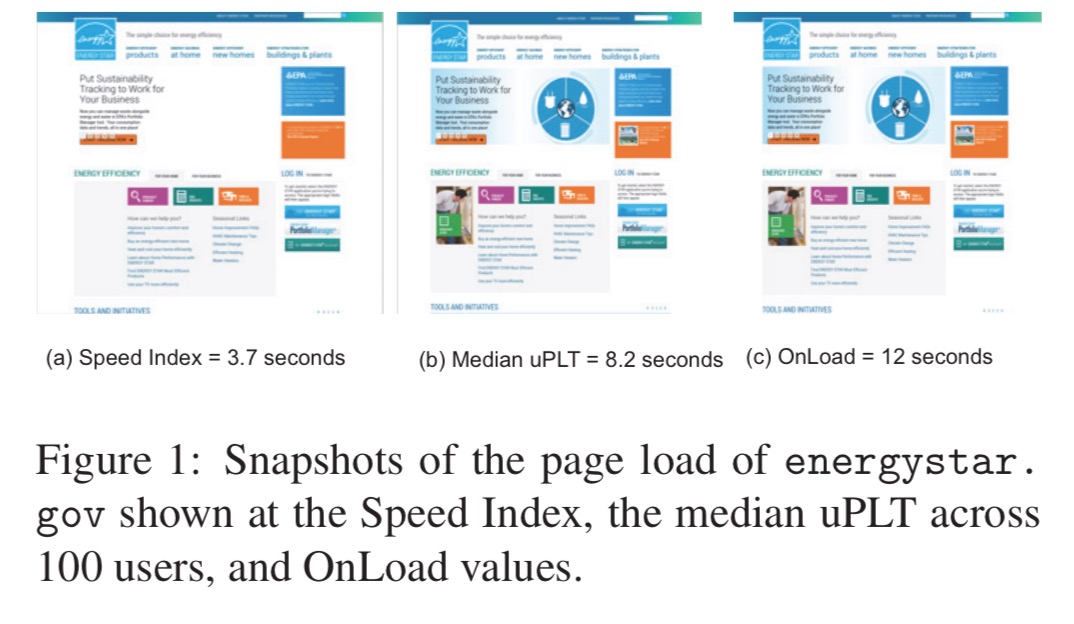
And here are the overall results across all 45 web pages and 100 users:
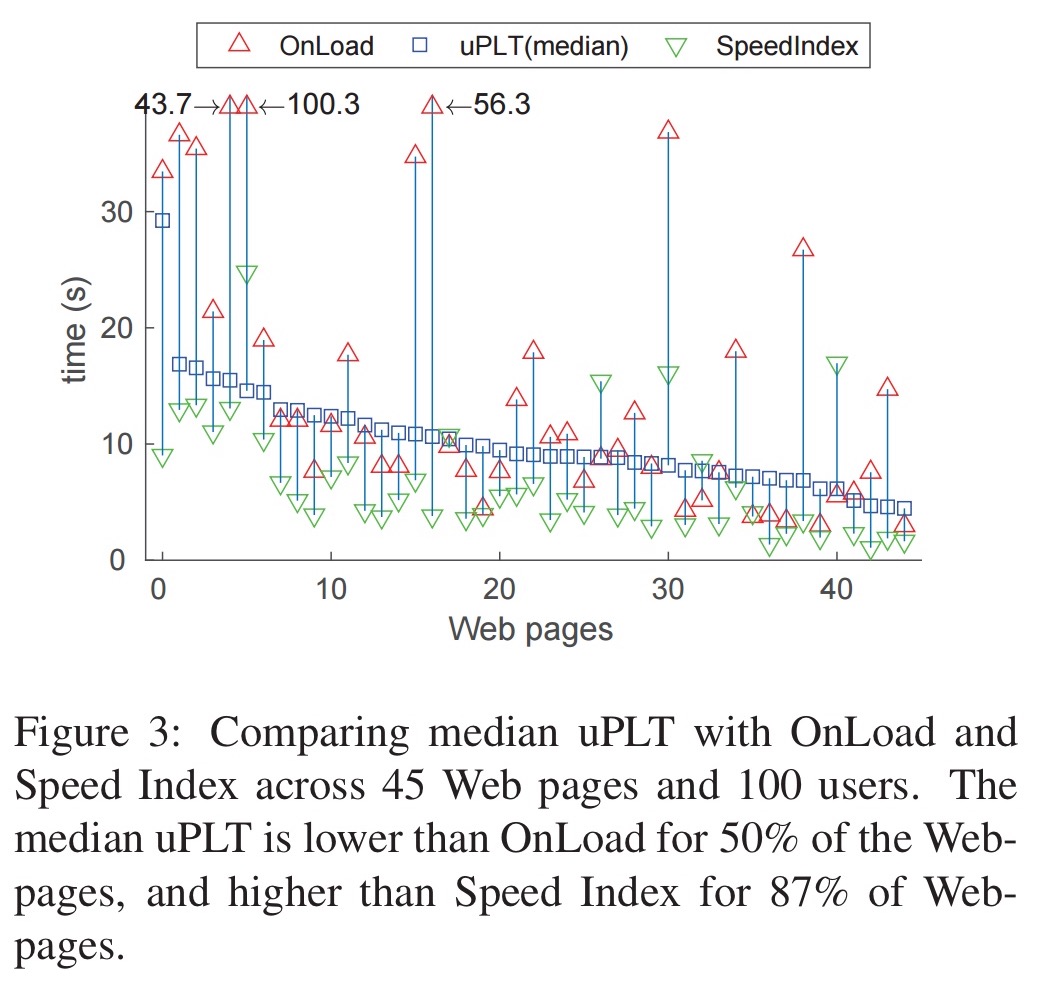
OnLoad tends to either over-estimate (on average by 6.4 seconds) or under-estimate (by 2.1 seconds on average) when compared to true uPLT. Pages that are heavy in Javascript and/or images tend to have even larger OnLoad time gaps. Speed Index is about 3.5 seconds lower than uPLT for 87% of Web pages.
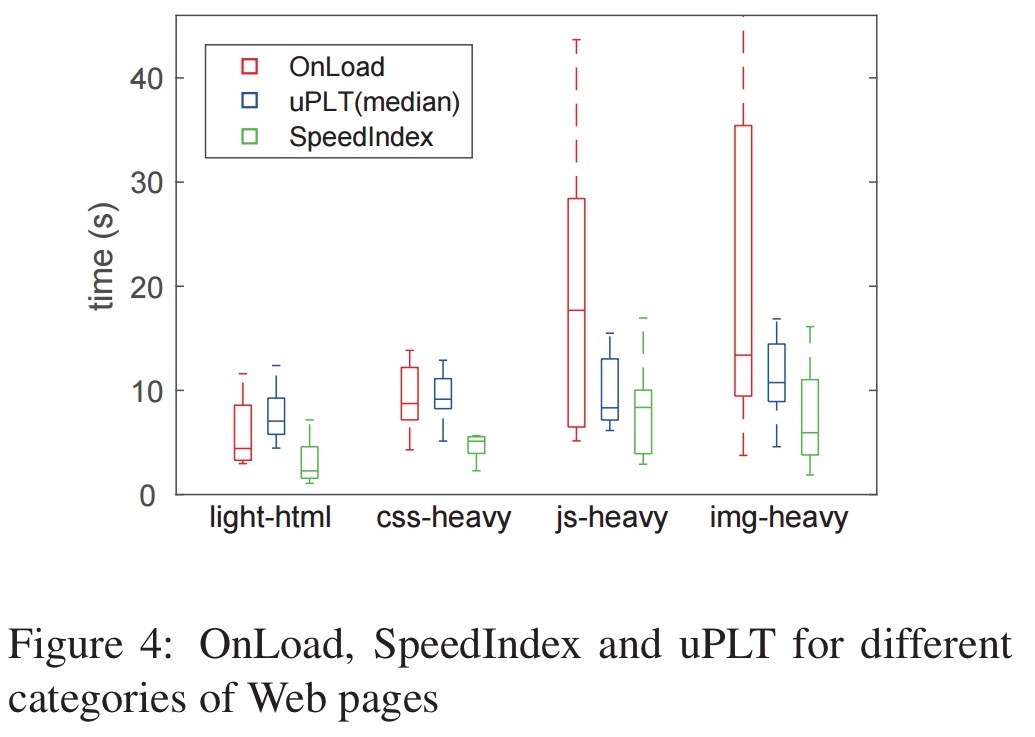
Using gaze to improve page load times
Having understood that neither OnLoad nor the Speed Index metric is a good indicator of the true user-perceived page load time, the authors turn their attention to figuring out what to focus on in order to reduce perceived page load times. Intuitively, what a user is looking at (visual attention) should tell us what is important on the page. We can track this using gaze tracking software…
Recently, advances in computer vision and machine learning have enabled low cost gaze tracking. The low cost trackers do not require custom hardware and take into account facial features, user movements, a user’s distance from the screen, and other user differences.
The study uses an off-the-shelf webcam based gaze tracker called GazePointer. A 50-user study is conducted using the GazePointer setup, across 45 web pages. An auxiliary study also used a much more expensive custom gaze tracker and confirmed that the results concur with the webcam-based solution. Each web page is divided into a set of regions, and the study tracks the regions associated with a users fixation points (i.e., when the user is focusing on something). For example, here are the visual regions for fcc.gov:
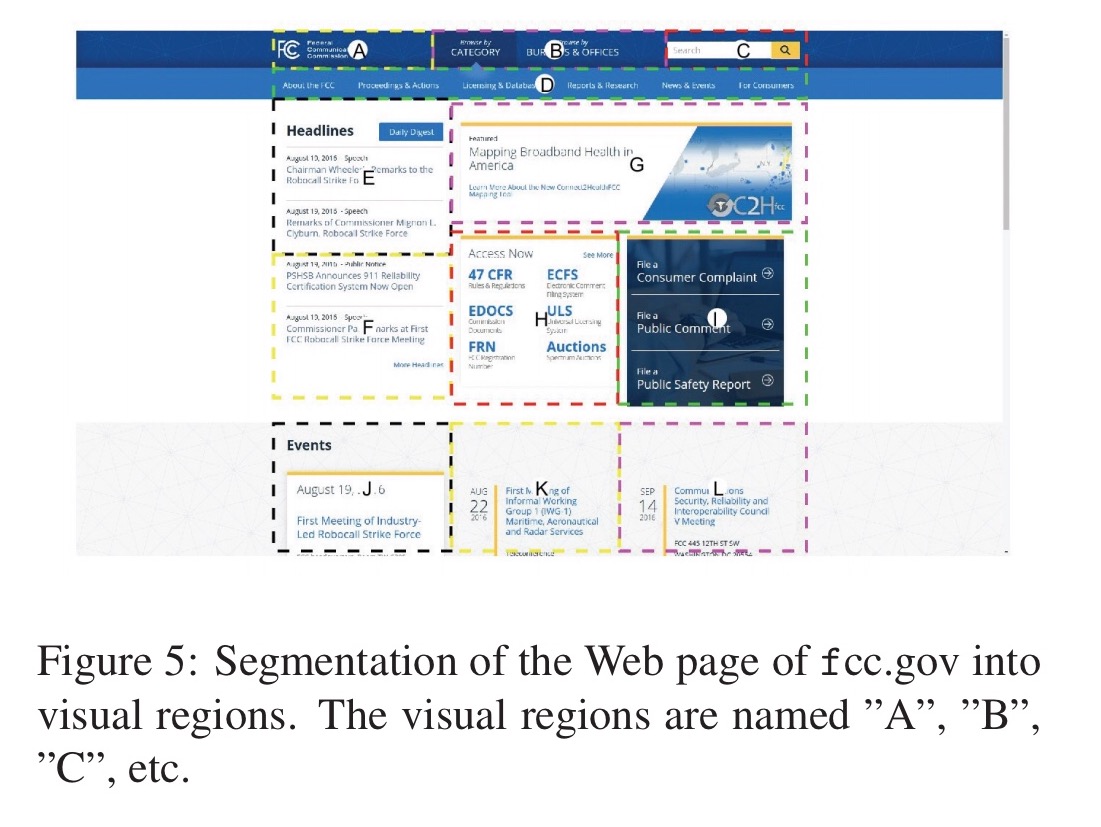
Here’s a heat map across the 45 websites, showing where the attention budget is spent. For example, when looking at the first web site we see that 5 regions combined are fixated on by 90% of users, whereas the remaining 75% of regions are fixated on by less than half of the users.
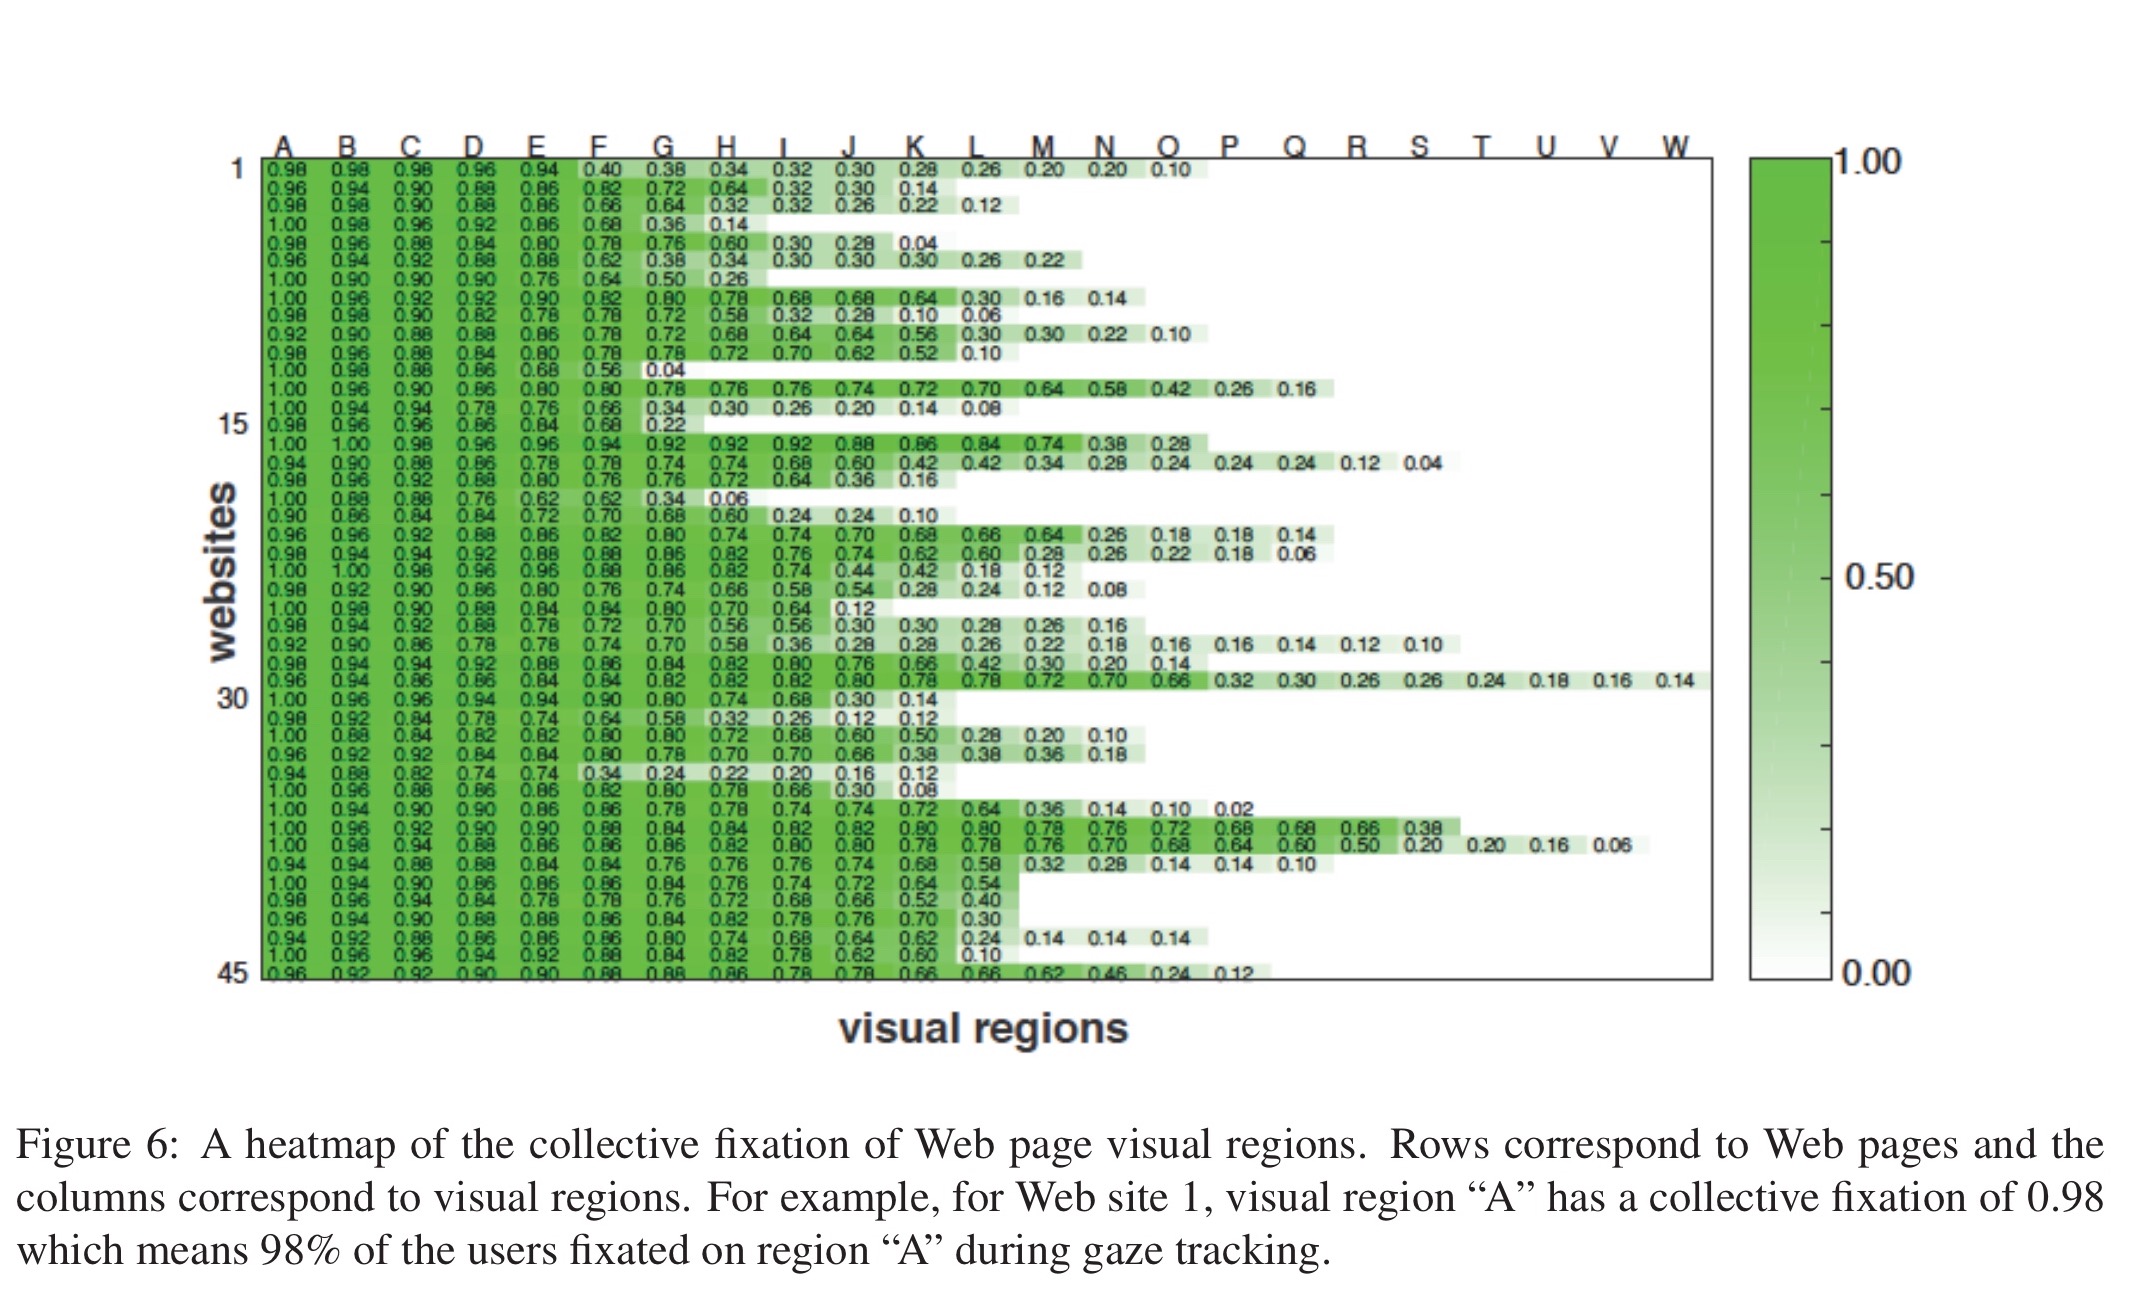
In general, we find that across the Web pages, at least 20% of the regions have a collective fixation of 0.9 or more. We also find that on average, 25% of the regions have a collective fixation of less than 0.3, i.e., 25% of regions are viewed by less than 30% of the users.
This leads to the following hypothesis: prioritising loading the parts of a web page that hold users attention should result in faster perceived page load times.
The WebGaze system collects gaze feedback from a subset of users as they browse, and uses the gaze feedback to determine which Web objects to prioritise during page load. (Good luck getting many people to opt-in to having their gaze tracked by webcam while they’re browsing though! Let’s just assume that getting sufficient gaze feedback is possible – e.g., from internal user testing).
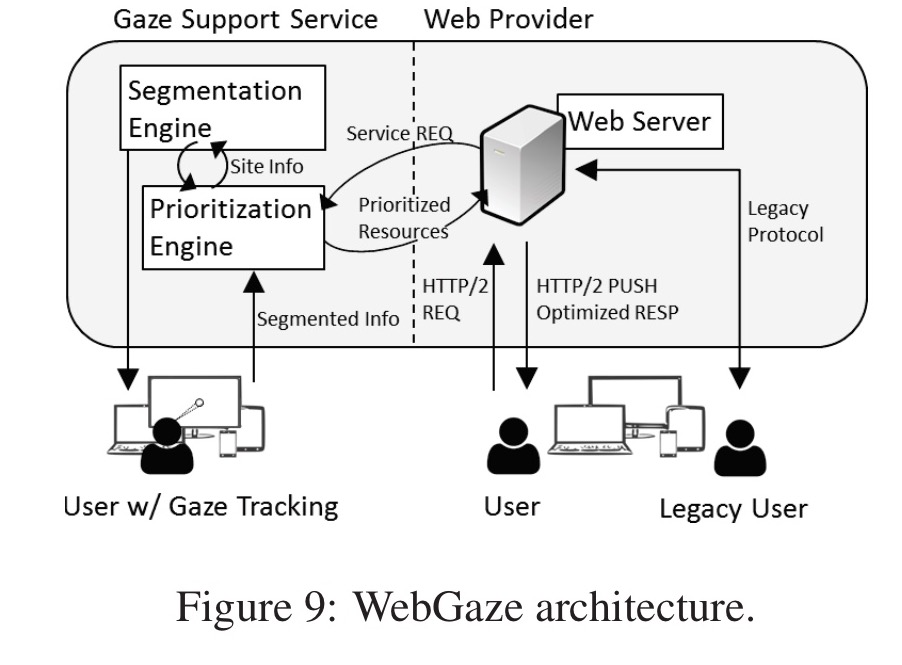
To identify which Web objects to prioritize, we use a simple heuristic: if a region has a collective fixation of over a prioritization threshold, then the objects in the region will be prioritized. In our evaluation, we set the prioritization threshold to be 0.7.
Each visual region may have multiple objects. The CSS bounding rectangles for all objects visible in the viewport can be obtained via the DOM. An object is said to be in a given region if its bounding rectangle intersects with the region, when an object belongs to multiple regions, it is assigned the priority of the highest priority of those regions. Having found the visible Web objects to be prioritised, the next task is to extend the set of prioritised objects to include any other objects they may depend on.
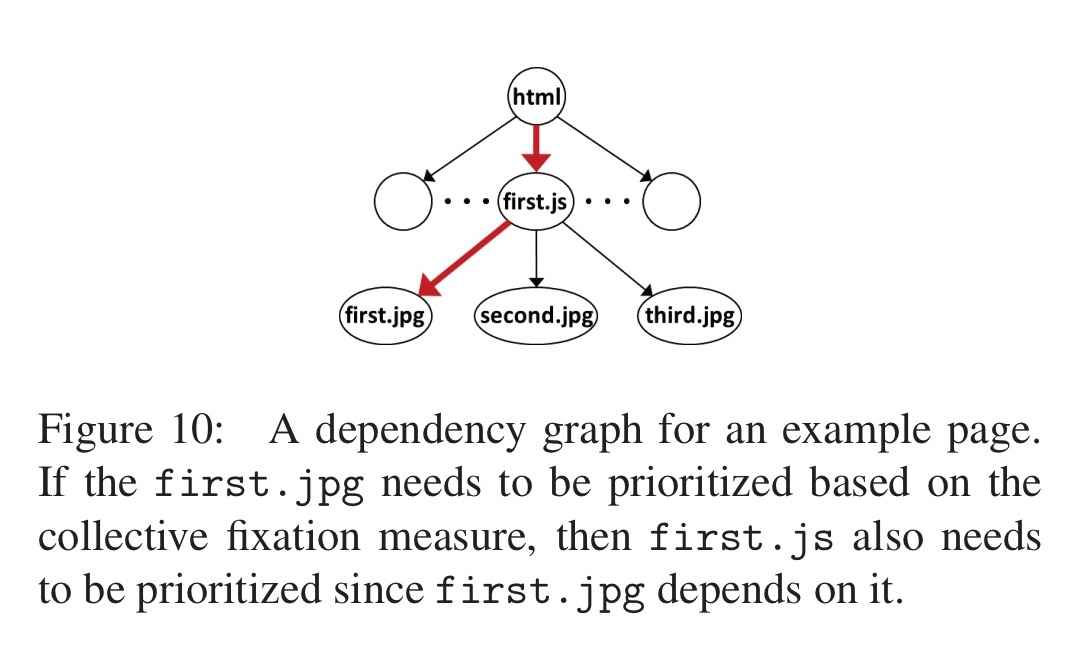
The WProf tool is used to extract dependencies. “While the contents of sites are dynamic, the dependency information has been shown to be temporally stable. Thus, dependencies can be gathered offline.”
To actually implement prioritization, WebGaze uses HTTP/2’s Server Push functionality.
Server Push decouples the traditional browser architecture in which Web objects are fetched in the order in which the browser parses the page. Instead, Server Push allows the server to preemptively push objects to the browser, even when the browser did not explicitly request these objects. Server Push helps (i) by avoiding a round trip required to fetch an object, (ii) by breaking dependencies between client side parsing and network fetching, and (iii) by better leveraging HTTP/2’s multiplexing.
In some pathological cases, Server Push can make things much worse! WebGaze reverts back to the default case without optimization when this is detected. This happened with 2 of the 45 pages in the study.
Does gaze-based prioritisation actually improve perceived user page load times though? An evaluation compared WebGaze with three alternative strategies:
- Default: the page loads as-is without prioritisation
- Push-all: all of the objects on the Web page are pushed using Server Push
- Klotski: the Klotksi algorithm is used to to push objects and dependencies with an objective of maximising the amount of above-the-fold content that can be delivered within 5 seconds.
Figure 11 (below) shows the CDF of the percentage improvement in uPLT compared to alternatives. On an average, WebGaze improves uPLT 17%, 12%, and 9% over Default, Push-All, and Klotski respectively. At the 95% percentile, WebGaze improves uPLT by 64%, 44%, and 39% compared to Default, Push-All, and Klotski respectively.
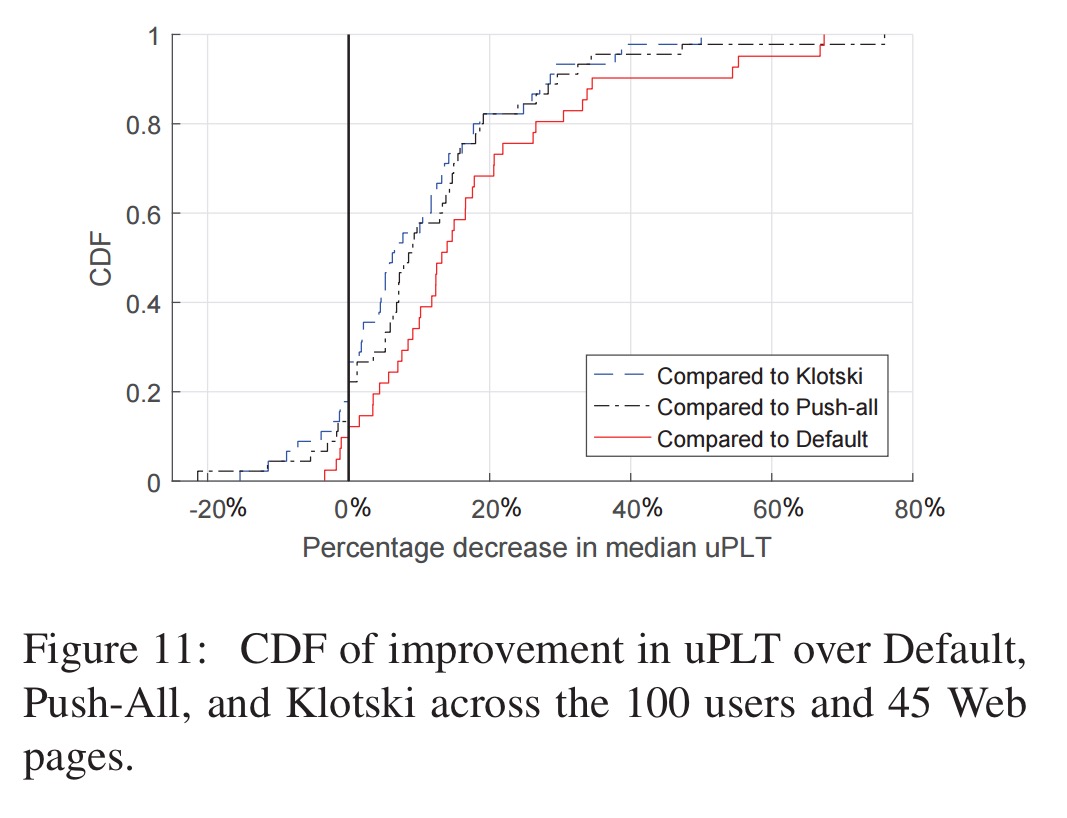
In about 10% of cases, WebGaze does worse than Klotski. In these cases, Klotski is sending less data than WebGaze. “This suggests we need to perform more analysis on determining the right amount of data that can be pushed without affecting performance.”
The authors note the significant security and privacy concerns with deploying gaze tracking in the wild. If you want to experiment, my recommendation would be to conduct your own (opt-in, in-the-lab) user studies using gaze tracking, and then use the information gleaned to improve Web object prioritisation for production systems.
what kind of tool can draw the Figure 9 ? It’s so clear and beautiful