Kraken: Leveraging live traffic tests to identify and resolve resource utilization bottlenecks in large scale web services Veeraraghavan et al. (Facebook) OSDI 2016
How do you know how well your systems can perform under stress? How can you identify resource utilization bottlenecks? And how do you know your tests match the condititions experienced with live production traffic? You could try load modeling (simulation), but it’s not really feasible to model systems undergoing constantly evolving workloads, frequent software release cycles, and complex dependencies. That leaves us with load testing. When load testing we have two further challenges:
- Ensuring that the load test workload is representative of real traffic. This can be addressed using shadow traffic – replaying logs in a test environment.
- Dealing with side-effects of the load testing that may propagate deep into the system. This can be addressed by stubbing, but it’s hard to keep up with constantly changing code-bases, and reduces the fidelity of end-to-end tests by not stressing dependencies that otherwise would have been affected.
Facebook use a very chaos-monkey-esque approach to this problem, they simply run load tests using live traffic using a system called Kraken, and have been doing so for about three years now. The core idea is really simple, just update the routing layer to direct more traffic at the systems you want to test. Here are four things to like about the approach:
- Live traffic does a very good job of simulating the behaviour of… live traffic.
- You don’t need any special test set-ups.
- Live traffic tests expose bottlenecks that arise due to complex system dependencies
- It forces teams to harden their systems to handle traffic bursts, overloads etc., thus increasing the system’s resilience to faults.
On that last point, it’s easy to see how a busy service team might ignore (deprioritise) a performance report from a specialist performance team stressing their system. It’s a whole different thing when you know your system is going to be pushed to its limits in production at some point. It’s just like when you know a chaos monkey is likely to crash a component at some point.
And of course, just as with Chaos Monkey, it’s an idea that can sound scary-as-hell when you first hear about it.
Safety is a key constraint when working with live traffic on a production system.
Why is continuous load testing important?
Frequent load testing of services is a best practice that few follow today, but that can bring great benefits.
The workload of a web service is constantly changing as its user base grows and new products are launched. Further, individual software systems might be updated several times a day or even continually… an evolving workload can quickly render models obsolete.
Not only that, but the infrastructure systems supporting the a given service constantly change too, and a data centre may be running hundreds of software systems with complex interactions.
Running frequent performance tests on live systems drove a number of good behaviours and outcomes:
- It highlighted areas with non-linear responses to traffic increases, and where there was insufficient information to diagnose performance problems
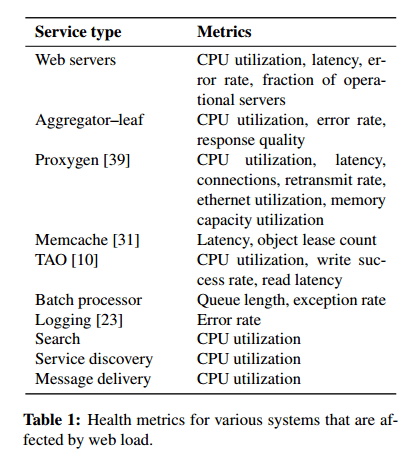
- It encouraged subsystem developers to identify system-specific counters for performance, error rate, and latency that could be monitored during a test.
We focused on these three metrics (performance, error rates, and latency) because they represent the contracts that clients of a service rely on – we have found that nearly every production system wishes to maintain or decrease its latency and error rate while maintaining or improving performance.
- It changed the culture (with deliberate effort), shifting from load tests as a painful event for a system to survive, to something that developers looked forward to as an opportunity to better understand their systems.
- It improved monitoring, and the understanding of which metrics are the most critical bellwethers of non-linear behaviours
- Performance testing as a regular discipline dramatically improved the capacity of Facebook’s systems over time:
Kraken has allowed us to identify and remediate regressions, and address load imbalance and resource exhaustion across Facebook’s fleet. Our initial tests stopped at about 70% of theoretical capacity, but now routinely exceed 90%, providing a 20% increase in request serving capacity.
A 20% increase is a big deal when you think of all the costs involved in operating systems at Facebook scale!
Getting to that 20% increases does of course require work to address the findings resulting from the load tests. As a short aside, one of the companies I’m involved with, Skipjaq, is also a big believer in the benefits of frequent performance testing. They look at individual services and automate the exploration of the configuration space for those services (OS, JVM, server process settings etc.) to optimise performance on or across infrastructure with no code changes required. Performance tuning at this level is something of a black art, which most teams are either not equipped to deal with, or don’t have time to deal with given the constantly changing workloads and code bases as previously described. Early results with real customer applications and workloads suggest there are big performance gains to be had here for many applications too.
How do you load test safely using live production systems?
Load-testing with live production systems (and traffic, so every request matters) requires careful monitoring and live traffic adjustment.
Our insight was that Kraken running on a data center is equivalent to an operational issue affecting the site – in both cases our goal is to provide a good user experience. We use two metrics, the web servers’ 99th percentile responses time and HTTP fatal error rate (50x’s), as proxies for the user experience, and determined in most cases this was adequate to avoid bad outcomes. Over time, we have added other metrics to improve safety such as the median queueing delay on web servers, the 99th percentile CPU utilization on cache machines, etc.. Each metric has an explicit threshold demarcating the vitality of the system’s health. Kraken stops the test when any metric reaches its limit, before the system becomes unhealthy.
The essence of Kraken
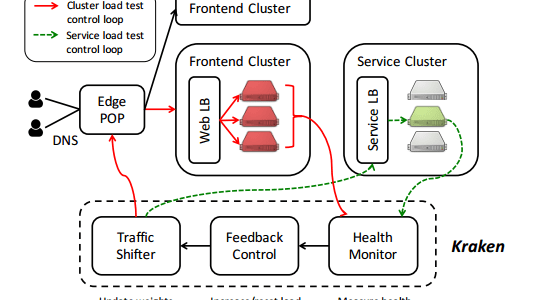
Kraken shifts traffic in the Facebook routing infrastructure by adjusting the weights that control load balancing. The edge weights control how traffic is routed from a POP to a region, the cluster weights control routing to clusters within regions, and server weights balance across servers within a cluster. Kraken sits as part of a carefully designed feedback loop (red lines in the figure below) that evaluates the capacity and behaviour of the system under test to adjust the stress it is putting on systems. The traffic shifting module queries Gorilla for system health before determining the next traffic shift to the system under test. Health metric definitions themselves are stored in a distributed configuration management system.
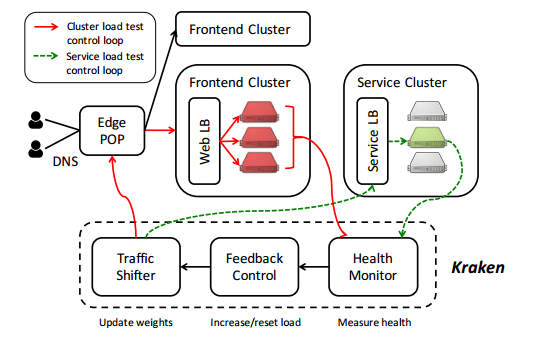
At the start of a test, Kraken aggressively increases load and maintains the step size while the system is healthy. We have observed a trade-off between the rate of load increase and system health. For systems that employ caching, rapid shifts in load can lead to large cache miss rates and lower system health than slow increases in load. In practice, we find that initial load increase increments of around 15% strike a good balance between load test speed and system health.
As system health metrics approach their thresholds, the load increases are dramatically reduced, down to increments of 1%. This allows the capture of more precise capacity information at high load.
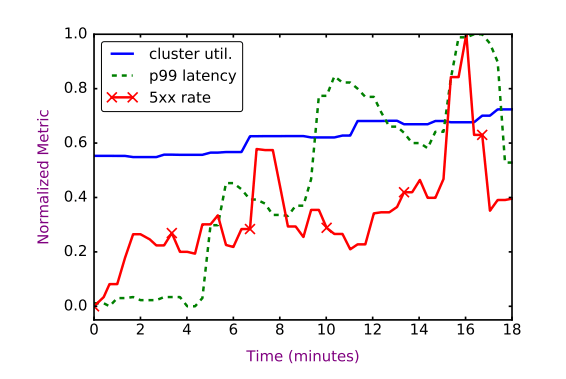
Here’s an example cluster load test. Every 5 minutes, Kraken inspects cluster health and decides how to shift traffic. It takes about 2 minutes for a load shift to occur and the results to be seen. The test stopped when the p99 latency (red line) exceeded its threshold level for too long.
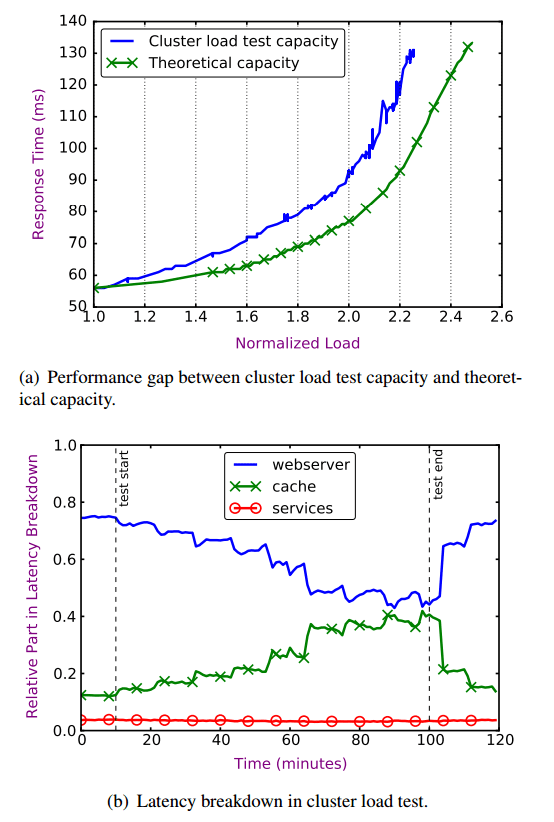
In the example above, the system only hit a peak utilization of 75%, well below Facebook’s target of 93%. The charts below show how Kraken can start to explain performance gaps. Chart (a) shows the widening gap between cluster load test capacity as measured, and the theoretical capacity, and (b) shows the increasing time spent waiting for cache responses as cluster load increases.
Section 5 in the paper is packed full of examples of issues found by Kraken and how they were resolved.
Lessons learned
We have learned that running live traffic load tests without compromising system health is difficult. Succeeding at this approach has required us to invest heavily in instrumenting our software systems, using and building new debugging tools, and encouraging engineers to collaborate on investigating and resolving issues.
- Simplicity is key to Kraken’s success – the stability of simple sytems is needed to debug complex issues
- Identifying the right metrics that capture a system’s performance, error rate, and latency is difficult.
We have found it useful to identify several candidate metrics and then observe their behaviour over tens to hundreds of tests to determine whech ones provide the highest signal. However, once we identify stable metrics, their thresholds are easy to configure and almost never change once set.
- Specialized error handling mechanisms such as automatic failover and fallbacks make systems harder to debug. “We find that such mitigations need to be well instrumented to be effective in the long run, and prefer more direct methods such as graceful degradation.”
- There are quick fixes (allocating capacity, changing configuration or load balancing strategies) that have been essential for rapidly solving production issues. Profiling, performance tuning, and system redesign are only undertaken when the benefit justifies the cost.
I’ll leave you with this quote:
…Kraken allowed us to surface many bottlenecks that were hidden until the systems were under load. We identified problems, experimented with remedies, and iterated on our solutions over successive tests. Further, this process of continually testing and fixing allowed us to develop a library of solutions and verify health without permitting regressions.
4 thoughts on “Kraken: Leveraging live traffic tests to identify and resolve resource utilization bottlenecks in large scale web services”
Comments are closed.