Runtime Metric Meets Developer – Building Better Cloud Applications Using Feedback – Cito et al. 2015
Today’s paper choice is also from OOPSLA. It describes some early work around an interesting idea…
A unifying theme of many ongoing trends in software engineering is a blurring of the boundaries between building and operating software products. In this paper, we explore what we consider to be the logical next step in this succession: integrating runtime monitoring data from production deployments of the software into the tools developers utilize in their daily workflows (i.e., IDEs) to enable tighter feedback loops. We refer to this notion as feedback-driven development (FDD).
Here’s a visual example from the paper, though the authors are keen to point out that the concept extends ‘way beyond’ simple visualisation of performance in the IDE.

Operational data is usually sent to monitoring and management services, and surfaced in a way that helps to make operating decisions, but perhaps not so readily in a manner that supports making software development decisions:
Operations data is usually available in external monitoring solutions, making it cumbersome for developers to look up required information. Further, these solutions are, in many cases, targeted at operations engineers, i.e., data is typically provided on system level only (e.g., CPU load of backend instances, throughput of the SaaS application as a whole) rather than associated to the individual software artifacts that developers care about (e.g., lines of code, classes, or change sets). Hence, operations data is available in SaaS projects, but it is not easily actionable for software developers.
The essence of FDD is to ‘collect, filter, integrate, aggregate, and map’ operations data onto a source code artefact graph (for example, an abstract syntax tree), and then use this to annotate and inform development :
These feedback-annotated dependency graphs then form the basis of concrete FDD use cases or tools, which either visualize feedback in a way that is more directly actionable for the software developer, or use the feedback to predict characteristics of the application (e.g., performance or costs) prior to deployment.
One of the more interesting general problems that has to be solved here is understanding the currency/relevancy of the operational data to the current version of the source code. If a significant change has just been deployed for example, the historical data may no longer be a good guide.
A naive approach would simply ignore all data that had been gathered before any new deployment. However, in a CD process, where the application is sometimes deployed multiple times a day, this would lead to frequent resets of the available feedback. This approach would also ignore external factors that influence feedback, e.g., additional load on a service due to increased external usage. Hence, we propose the usage of statistical changepoint analysis on feedback to identify whether data should still be considered “fresh”. Changepoint analysis deals with the identification of points within a time series where statistical properties change. For the context of observing changes of feedback data, we are looking for a fundamental shift in the underlying probability distribution function.
The authors point to a previous paper that gives details on the techniques used (“Identifying Root Causes of Web Performance Degradation using Changepoint Analysis” – Cito et al. 2014). One for a future edition of The Morning Paper perhaps!
As examples of the general FDD concept, the authors have built three tools: Performance Spotter, Performance Hat, and a ‘cost of code changes’ visualiser.
Performance Spotter
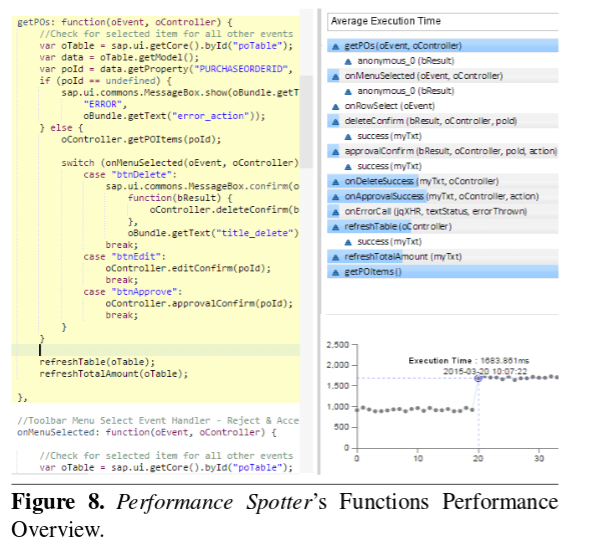
Performance Spotter is an experimental set of tools developed on top of the SAP HANA Cloud Platform. The aim of Performance Spotter is to help the developers in finding expensive development artifacts. This has been achieved by creating analytic feedback based on collected operations data and mapping this feedback onto corresponding development artifacts in the IDE. Other information such as the number of calls and the average execution time are derived by aggregating the collected data. Performance Spotter provides ways to promote performance awareness, root cause analysis, and performance analysis for external services.
The result looks like a profiler integrated with the IDE, one that is fed by profiling data captured via the operational systems rather than running a profiler locally.

Performance Hat
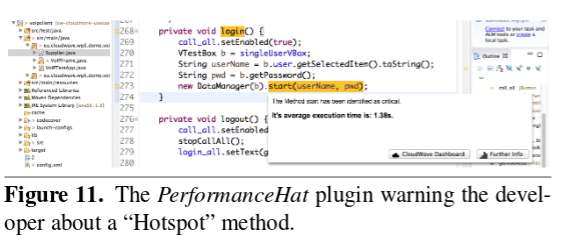
Performance Hat is an Eclipse plugin that makes hotspot methods easily identifiable in the IDE:

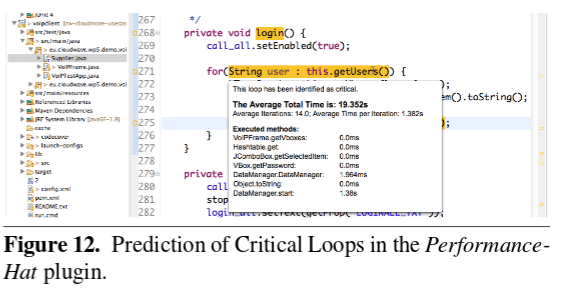
Performance Hat also makes predictions about the expected running times of loops as the developer is editing the code:
In the initial stages of our prototype we propose a simplified model over operations data on collection sizes and execution times of methods to infer the estimated execution time of the new loop. Figure 12 (see below) gives an example of a so-called Critical Loop. When hovering over the annotated loop header a tooltip displays the estimated outcome (Average Total Time), the feedback parameters leading to this estimation (Average Iterations and Average Time per Iteration), and the execution times of all methods in the loop. This information enables developers to dig further into the performance problem, identify bottlenecks and refactor their solutions to avoid poor performance even before committing and deploying their changes.

The authors have made available a short video where you can see this in action.
Cost of Changes
The final example is interesting, but at a very early stage of exploration:
It is often assumed that deploying applications to public, on-demand cloud services, such as Amazon EC2 or Google Appengine, allows software developers to keep a closer tab on the operational costs of providing the application. However, in a recent study, we have seen that costs are still usually intangible to software developers in their daily work. To increase awareness of how even small design decisions influence overall costs in cloud applications, we propose integrated tooling to predict costs of code changes following the FDD paradigm.
2 thoughts on “Runtime Metric Meets Developer – Building Better Cloud Applications Using Feedback”
Comments are closed.