Identifying impactful service system problems via log analysis He et al., ESEC/FSE’18
If something is going wrong in your system, chances are you’ve got two main sources to help you detect and resolve the issue: logs and metrics. You’re unlikely to be able to get to the bottom of a problem using metrics alone (though you might well detect one that way), so that leaves logs as the primary diagnosis tool. The online service at Microsoft used as the main case study in the paper produces dozens of Terabytes of logs every day.
Logs play a crucial role in the diagnosis of modern cloud-based online service systems. Clearly, manual problem diagnosis is very time-consuming and error-prone due to the increasing scale and complexity of large-scale systems.
Log3C analyses logs to look for indications of impactful problems, using correlated KPIs as a guide. It finds these needles in the haystack with an average precision of 0.877 and an average recall of 0.883. A distributed version of Log3C has been deployed and used in production at Microsoft for several years, both to support a massive online service (we are not told which one), and integrated into “Product B” where it is used as a log analysis engine to analyse tens of billions of log messages every day.
Log3C greatly reduces engineer’s efforts on manually inspecting the logs and pinpointing root causes of failures. Furthermore, fault patterns are also extracted and maintained for analyzing similar problems in the future.
From the experiences thus gained in log analysis the authors draw the following lessons:
- Simple anomaly / outlier detection doesn’t cut it. It’s tempting to believe that systems are regular most of the time, and therefore any outliers are problems, but in practice there’s can be a long tail of infrequent (but genuine) user behaviours. “Our experiences with the production system reveal that there are indeed many rare user behaviors, which are not real problems. A lot of effort could be wasted by examining these false positives.“
- It’s not just a single incidence of a problem that’s important, but also the underlying trend in the number of incidences of that problem. Are the number of incidences steadily increasing over a period of time? That’s of interest. Have totally new problems appeared? That could be an indication of a buggy deployment. Do the number of incidences of problem decrease after a fix, but then settle down to a steady but non-zero level? This can indicate an incomplete fix or partial solution.
To work its magic, Log3C combines both metrics and logs. KPIs are used to guide log analysis to focus on periods in time when we have external evidence of a system problem (e.g., the error rate is up). This helps to separate the long tail of genuine user behaviours from true problems. Then Log3C uses a novel clustering algorithm called Cascading Clusters in order to be able to effectively cluster the massive amounts of log data generated by the system. Problems are identified by looking for rare clusters correlated with KPI degradation. Clustering is made more difficult because logs are highly imbalanced – the vast majority of log entries are for regular non-problem behaviours.
High level approach
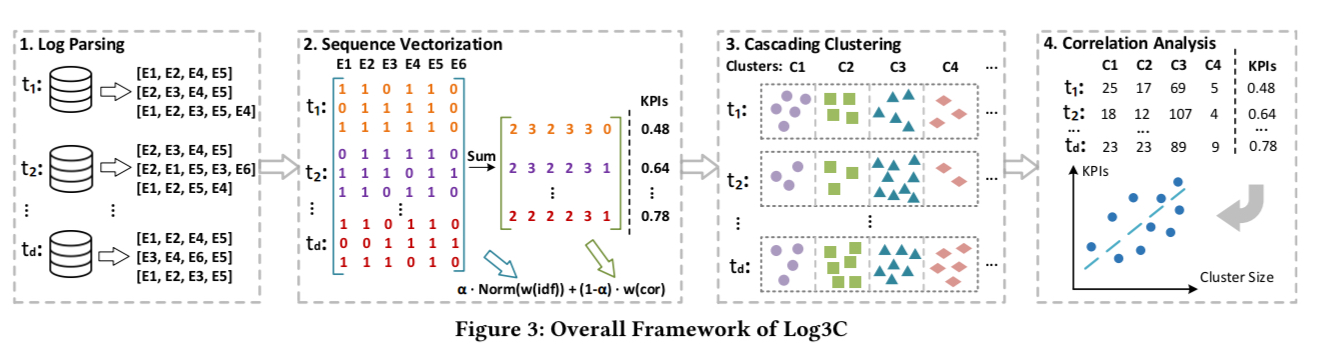
Log3C consists of four steps: log parsing, sequence vectorization, cascading clustering, and correlation analysis.
(Enlarge)
…at each time interval, logs are parsed into log events and vectorized into sequence vectors, which are then grouped into multiple clusters through cascading clustering. However, we still cannot extrapolate whether a cluster is an impactful problem, which necessitates the use of KPIs. Consequently, in step four, we correlate clusters and KPIs over different time intervals to find impactful problems.
From log messages to sequence vectors
The first step is to turn log messages into log events (on the assumption you’re not logging as events already). For each log message such as “HTTP Request URL: http://…” the goal is to recover the log message template, e.g. “HTTP Request URL: {url}” and turn each template into an event type.
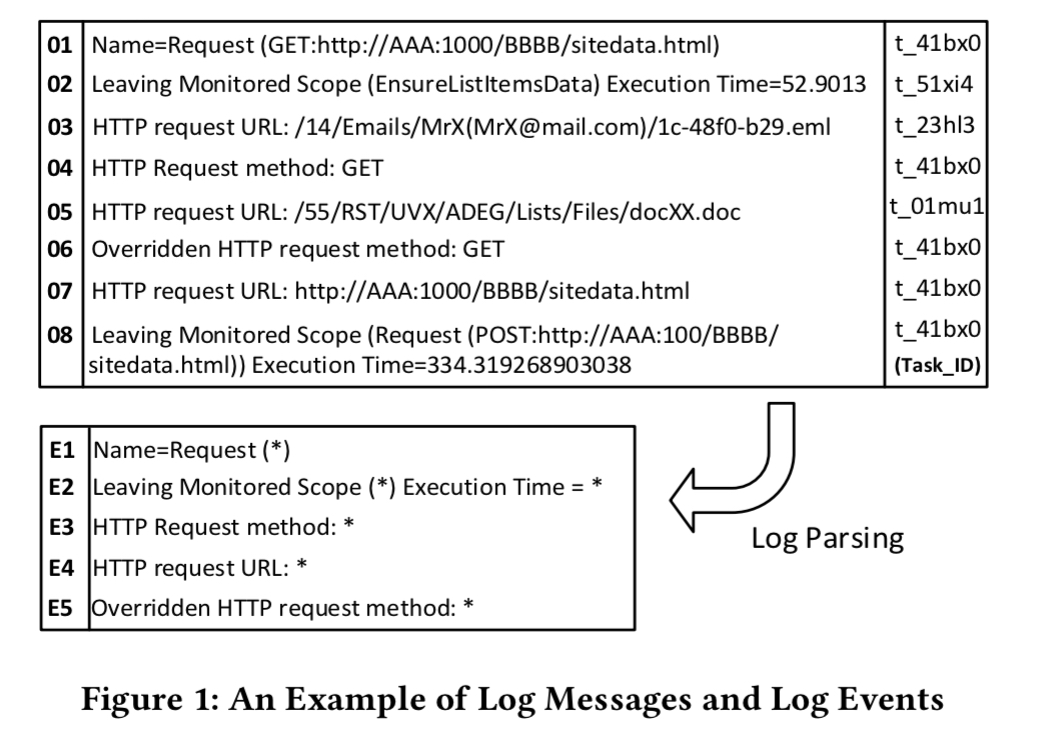
To do this first some common parameter fields are removed using regular expressions (URLs, ip addresses, and so on), and then log messages are clustered into coarse-grained groups based on weighted edit distance. Each cluster is further broken down into finer-grained groups and log events are extracted by looking for the longest common substrings within each group.
We can now turn a sequence of log messages into a sequence of events:
To form a log sequence, log messages that share the same task ID are linked together and parsed into log events. Moreover, we remove the duplicate events in the log sequence.
For ‘task ID’ think e.g. request ID. Duplicate removal eliminates logs from retrying operations and loops, and makes it easier to match sequences that are different occurrences of the same event).
Each log sequence is then turned into a vector. If we have n different event types then then resulting sequence vectors will have n elements, each element representing the ‘weight’ of the corresponding event in the sequence. Event weights are produced as the sum of two terms, with the relative priority determined by a configurable parameter 
 = \alpha . IDF(e) + (1 - \alpha).IMP(e)")
Where IDF(e) is an Inverse Document Frequency term, which gives frequent events low weights, and rare events high weights. IDF weights are normalised into the range [0, 1] using the sigmoid function.
IMP(e) is a measure of the importance of the event with regards to KPIs. A regression model is built to measure the correlation between log events and KPI values to find the importance weights. Assume that KPIs are computed once for every time interval. Count the number of occurrences of each event type within that interval across all sequences, and then apply the weights from the regression model. (This is visually represented in step 2 of the figure above).
Since the importance weight is directly associated with KPIs and is thereby more effective in problem identification, we value the importance weight more, i.e.,
From sequence vectors to clusters
Once all log sequences have been vectorised, sequence vectors are grouped into clusters separately for each time interval.
However, the conventional clustering methods are incredibly time-consuming when the data size is large…
Hence Loc3C using a novel clustering technique called cascading clustering. It’s an iterative process, with each iteration going through three steps: sampling, clustering, matching.
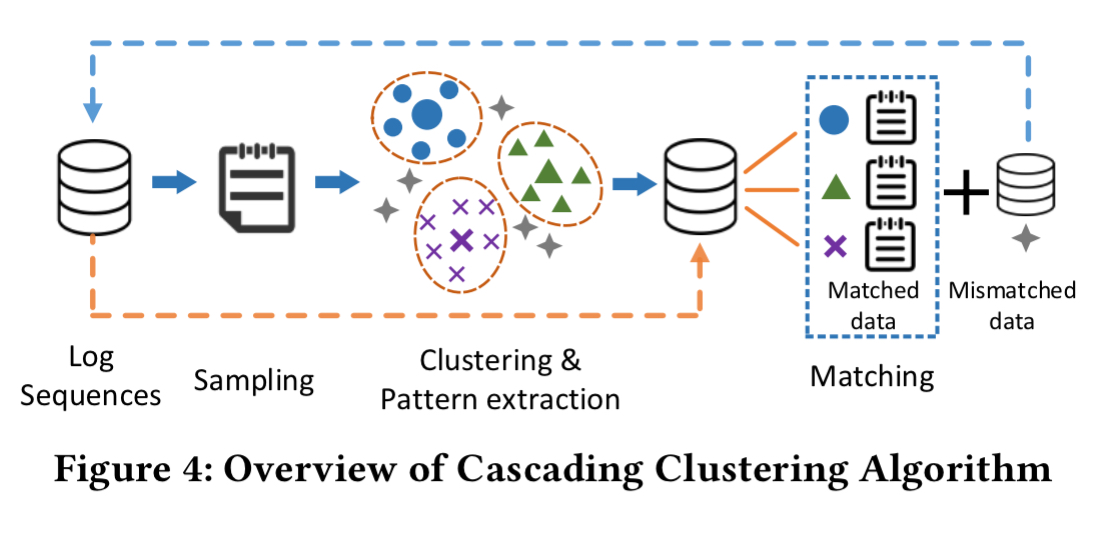
First we randomly sample a portion of sequence vectors, then we run clustering on the sampled vectors. For each resulting cluster, a pattern is extracted (the mean of all sequence vectors in the cluster). Then take all of the original unsampled sequence vectors and assign them to the closest discovered cluster assuming it is within some distance threshold. At the end of this process we will be left with a set of sequence vectors that were not close enough to a cluster to have been assigned. These remaining vectors then ‘cascade’ into the next iteration as the new input.
By iterating these processes, all sequence vectors can be clustered rapidly and accurately. The reason behind this is that large clusters are separated from the remaining data at the first several iterations.
Neat eh?
From clusters and KPIs to problem identification
The clusters represent different types of log sequences (system behaviours), but these may not necessarily be problems. So the final step is to correlate clusters with changes to KPIs.
Another regression model captures the correlation between cluster sizes and KPI values over multiple time intervals. “More specifically, we utilize a multivariate linear regression model, which correlates independent variables (cluster sizes) with the dependent variable (KPI).”
Among all independent variables, those that have statistical significance make notable contributions to the dependent variable. Moreover, the corresponding clusters indicate impactful problems, whose occurrences contribute to the change of KPI.
Log3C in action
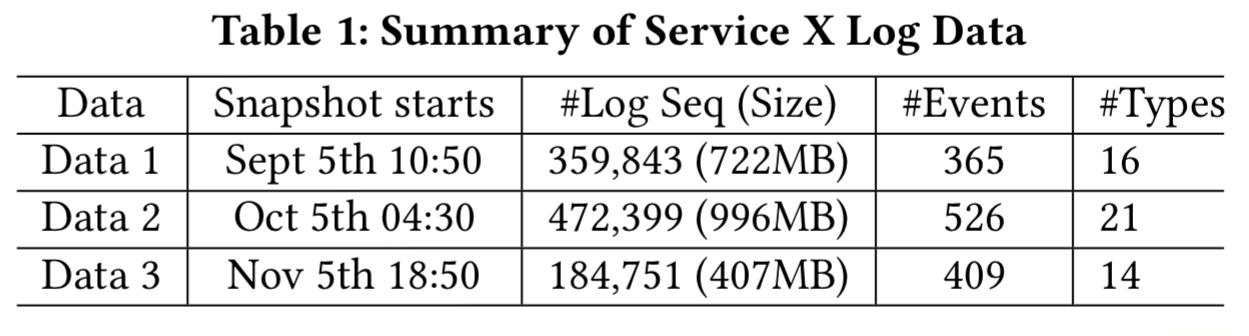
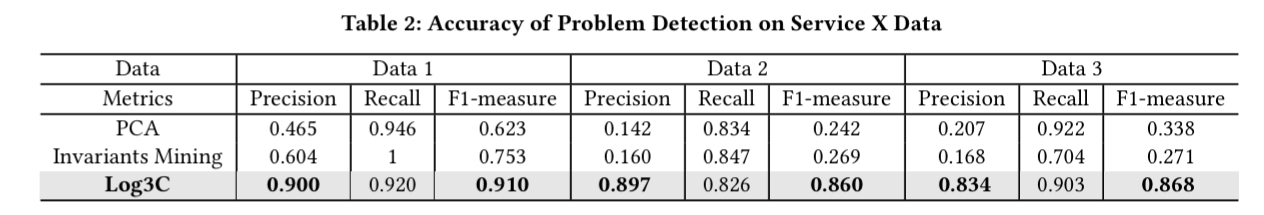
Log data is collected from Microsoft’s service ‘X’ and the data from a specific period (we are not told the time or duration of this period) on each of three days is manually labelled. This enables comparison of the effectiveness of Log3C against a ground truth.
Here’s how well Log3C’s automated log analysis does on these datasets:
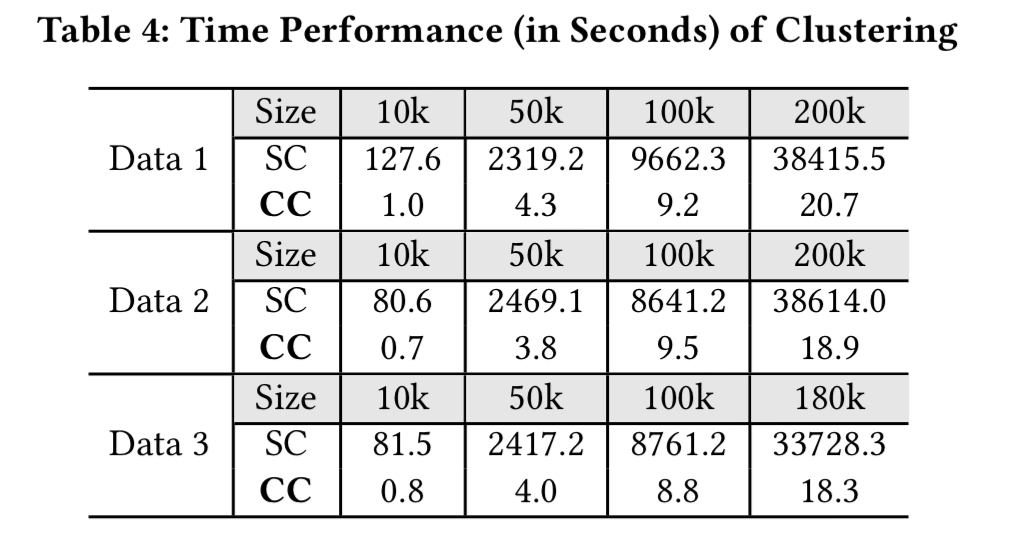
And compared to a standard Hierarchical Agglomerative Clustering algorithm, Cascading Clustering is much faster:
As stated earlier in this write-up, beyond these results we also have the fact that Log3C is used in production settings at Microsoft to assist in the maintenance of online service systems.
Log3C is available at https://github.com/logpai/Log3C.