Virtual machine warmup blows hot and cold Barrett et al., OOPSLA’17
(With thanks to Prof. Richard Jones at Kent University who first pointed this paper out to me.)
Yesterday we saw the recommendations of Georges et al. for determining when a (Java) virtual machine has reached a steady state and benchmarks can be taken. Kalibera and Jones later provided a more accurate manual process. In ‘Virtual machine warmup blows hot and cold,’ Barrett et al. provide a fully-automated approach to determining when a steady state has been reached, and also whether or not that steady state represents peak performance. Their investigation applies to VMs across a range of languages: Java, JavaScript, Python, Lua, PHP, and Ruby.
Our results suggest that much real-world VM benchmarking, which nearly all relies on assuming that benchmarks do reach a steady state of peak performance, is likely to be partly or wholly misleading. Since microbenchmarks similar to those in this paper are often used in isolation to gauge the efficacy of VM optimisations, it is also likely that ineffective, or deleterious, optimisations may have been incorrectly judged as improving performance and included in VMs.
If you’re simply allowing a VM to run a small number (e.g., 10) of iterations and then expecting it to be warmed-up and in a steady state by then, you’re definitely doing it wrong!
To gather their data, the authors use a very carefully controlled experiment design. Because of the level of detail and isolation it took around 3 person years to design and implement the experiments. The repeatable experiment artefacts are available online at https://archive.org/download/softdev_warmup_experiment_artefacts/v0.8/.
Benchmarking methodology
The basis for benchmarking are the binary trees, spectralnorm, n-body, fasta, and fannkuch redux microbenchmarks from the Computer Languages Benchmarks Game (CLBG).These small benchmarks are widely used by VM authors as optimisation targets. Versions of these for C, Java, JavaScript, Python, Lua, and Ruby are taken from Bolz and Tratt 2015.
On each process run, 2000 iterations of the microbenchmark are executed. There are 30 process executions overall, so we have a total of 30 x 2000 iterations. The authors go to great lengths to eliminate any other factors which may contribute to variance in the benchmarking results. For example, the machines are clean rebooted to bring them into a known state before each process run, networking is disabled, daemons are disabled, there is no file I/O, and so on. They even ensure that the machines run benchmarks within a safe temperature range (to avoid the effects of temperature-based CPU limiters in CPUs). Full details are in section 3, and section 7 on ‘threats to validity’ outlines even more steps that were taken in an attempt to obtain results that are as accurate and reliable as possible. Suffice to say, you can easily start to see where some of those 3-person years went!
The main hypothesis under investigation is:
- H1 Small, deterministic programs reach a steady state of peak performance.
And as a secondary hypothesis:
- H2 Moderately different hardware and operating systems have little effect on warmup
If the expected warm-up and followed by steady-state peak performance pattern is not observed, then the third hypothesis is :
- H3 Non-warmup process executions are largely due to JIT compilation or GC events
Benchmarks are run on GCC 4.9.3, Graal 0.18, HHVM 3.15.3 (PHP), JRuby + Truffle 9.1.2.0, HotSpot 8u112b15 (Java), LuaJIT 2.0.4, PyPy 5.6.0, and V8 5.4.500.43 (JavaScript). Three different benchmarking machines were used in order to test H2. Linux (1240v5) and Linux (4790) have the some OS (with the same packages and updates etc.) but different hardware. Linux (4790) and OpenBSD (4790) have the same hardware but different operating systems.
Changepoint analysis
Each in-process run results in time series data of length 2000. A technique called statistical changepoint analysis is used to analyse the data and classify the results. Prior to this analysis the data is pre-processed to remove outliers, defined as any point after the first 200 that is outside the median ±3x (90%ile – 10%ile). Overall, 0.3% of all data points are classified as outliers under this definition.
We use changepoint analysis to determine if and when warmup has occurred. Formally, a changepoint is a point in time where the statistical properties of prior data are different to the statistical properties of subsequent data; the data between two changepoints is achangepoint segment. Changepoint analysis is a computationally challenging problem, requiring consideration of large numbers of possible changepoints.
The authors use the PELT algorithm which reduces the complexity to O(n). Changepoint detection is based on both the mean and variance of in-process iterations. Changepoint segments that have means within a small threshold (0.001 seconds) are considered equivalent. In addition a segment will be considered equivalent to the final segment if its mean is within variance($s_f$) seconds of the final segment mean. (Treating the variance of the final segment, 
If hypothesis H1 holds, then we will see warm-up segment(s) followed by one or more steady-state segments, with the final segment being the fastest. A benchmark is said to reach a steady state if all segments which cover the last 500 in-process iterations are considered equivalent to the final segment.
- When the last 500 in-process iterations are not equivalent to the final segment then we say that the benchmark had no steady state.
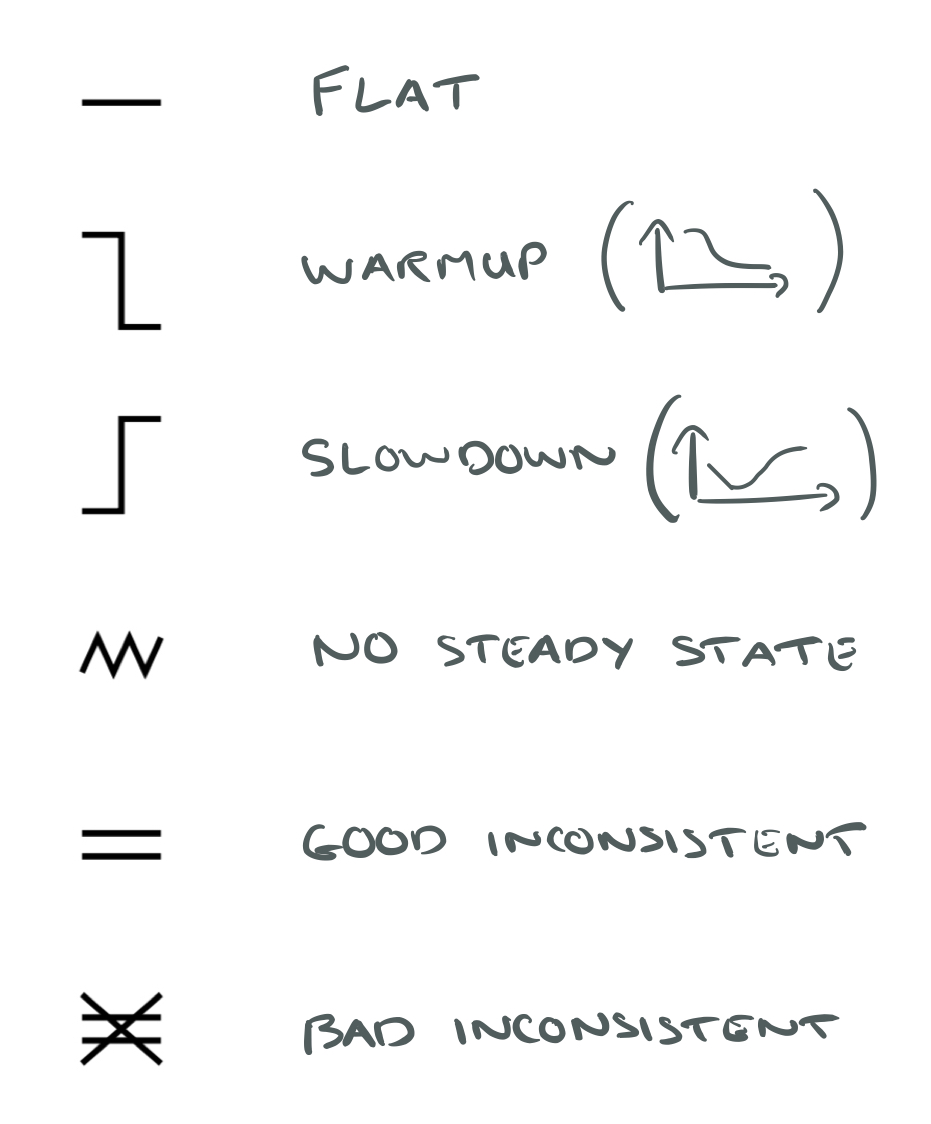
- If a steady state is reached and all segments are equivalent then the benchmark is classified as flat.
- If a steady state is reached and at least one segment is faster than the final segment the the benchmark is classified as slowdown.
- If a steady state is reached and it is not flat or a slowdown, then we have the classic warmup pattern.
Flat and warmup benchmarks are considered ‘good,’ while slowdown and no steady state benchmarks are ‘bad.’
That deals with a single process run of 2000 in-process iterations. If all process executions for a given (VM, benchmark) pair have the same classification, then the pair is classified the same way and said to be consistent, otherwise the pair is classified as inconsistent.
In the charts and diagrams in the paper, you’ll see these various categories represents by symbols like this:
Our results consist of data for 3660 process executions and 7,320,000 in-process iterations. Table 1 (below) summarises the (VM, benchmark) pairs and process executions for each benchmarking machine.
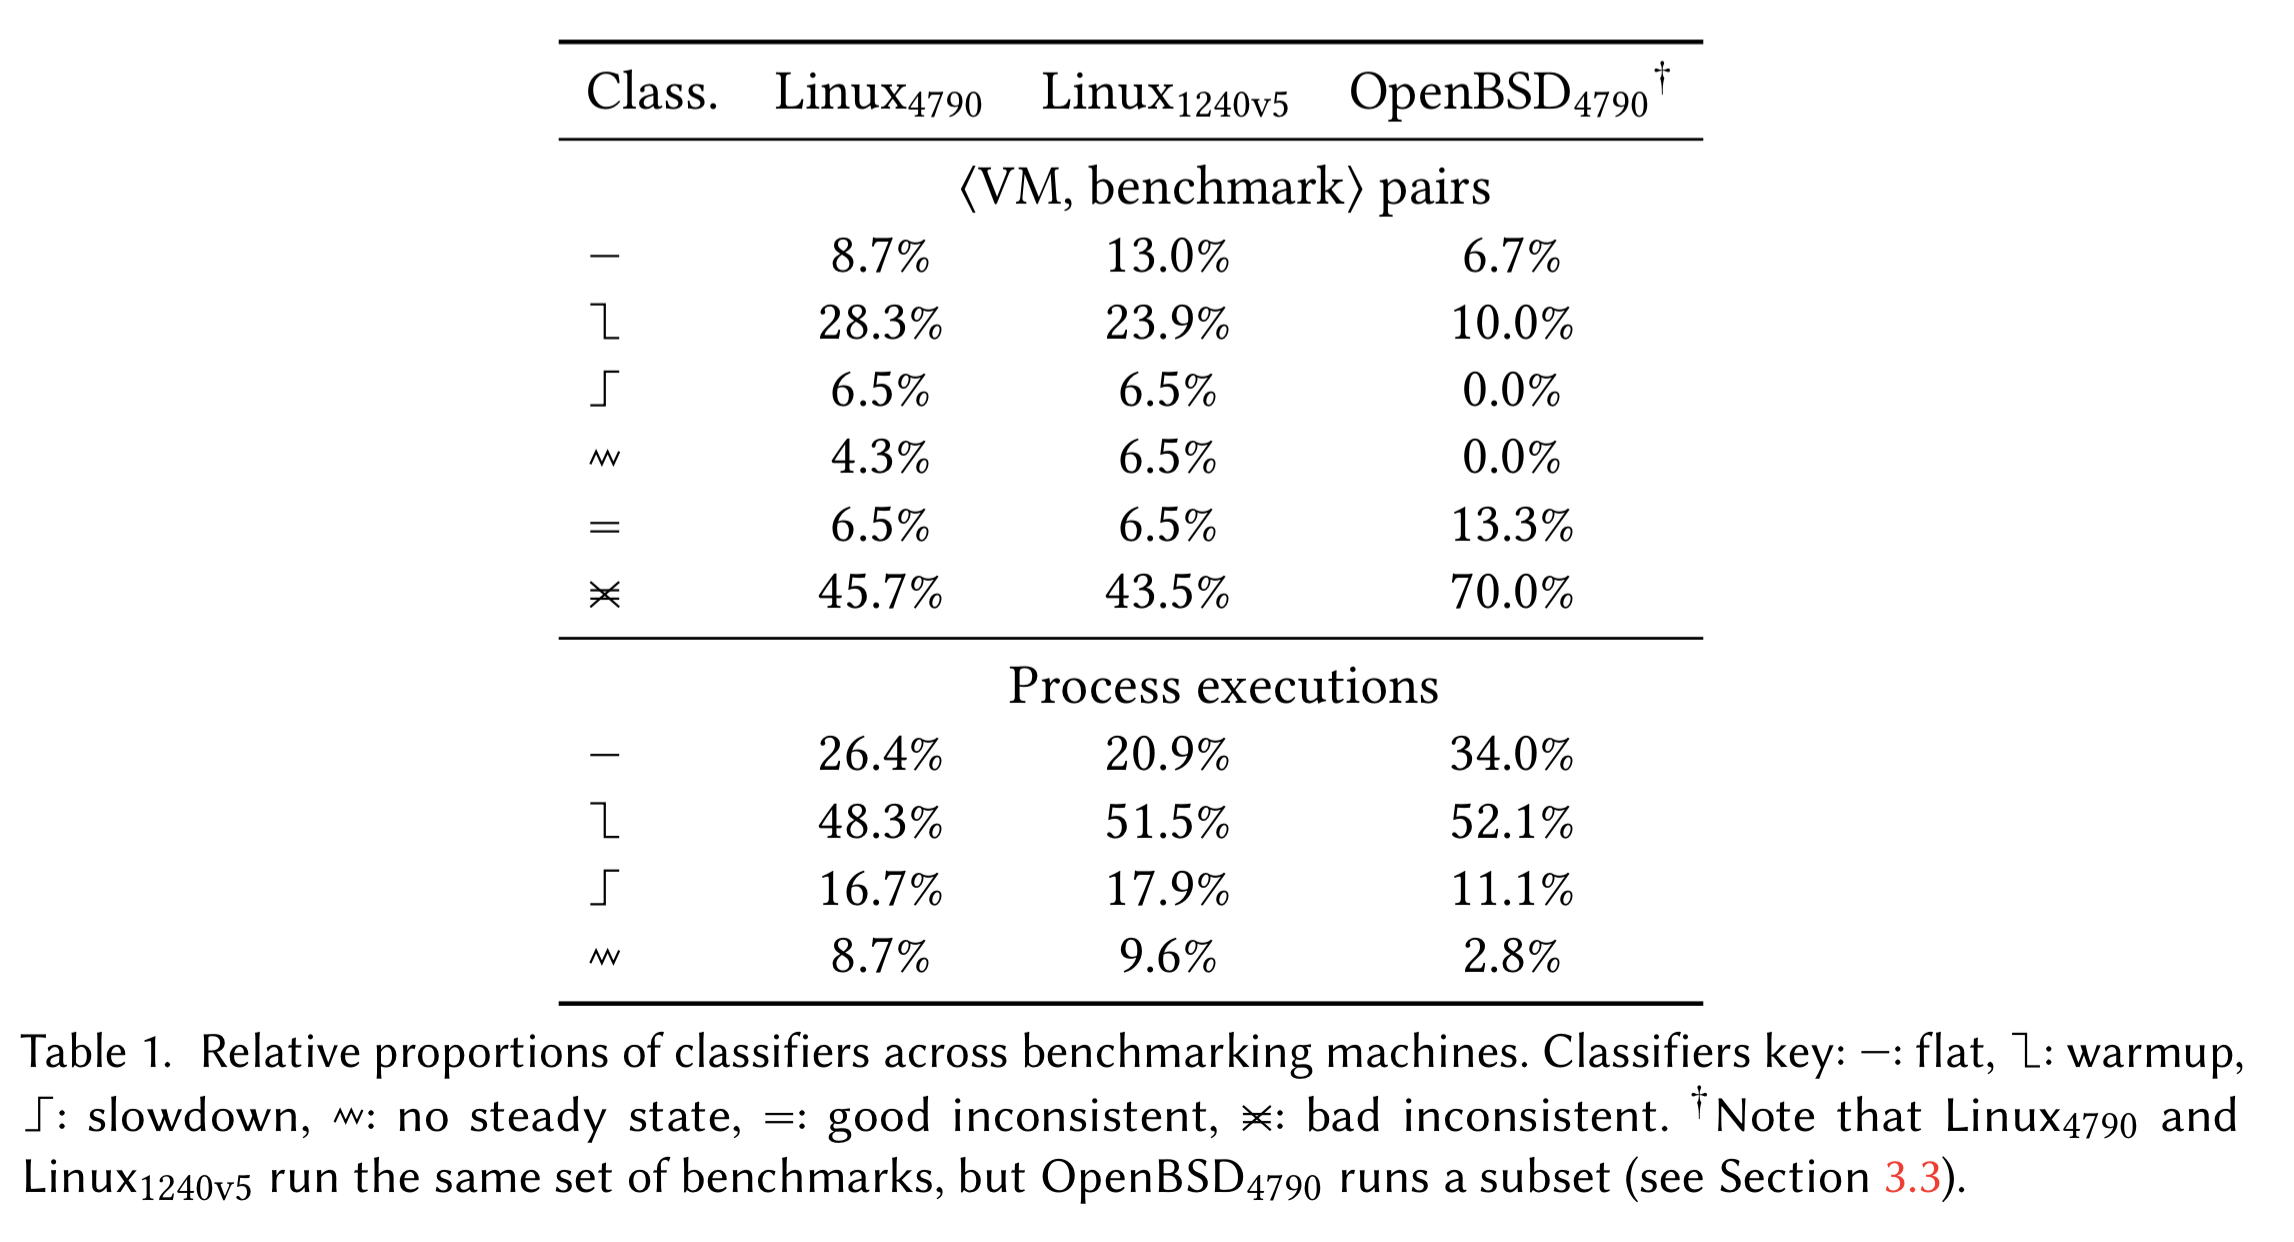
Note that for (VM, benchmark) pairs, at best 37% of pairs show flat or warmup patterns, and another 6.5% are good inconsistent. The biggest proportion by far is ‘bad inconsistent.’
This latter figure clearly show a widespread lack of predictability: in almost half of cases, the same benchmark on the same VM on the same machine has more than one performance characteristic. It is tempting to pick one of these performance characteristics – VM benchmarking sometimes reports the fastest process execution, for example – but it is important to note that all of these performance characteristics are valid and may be experienced by real-world users.
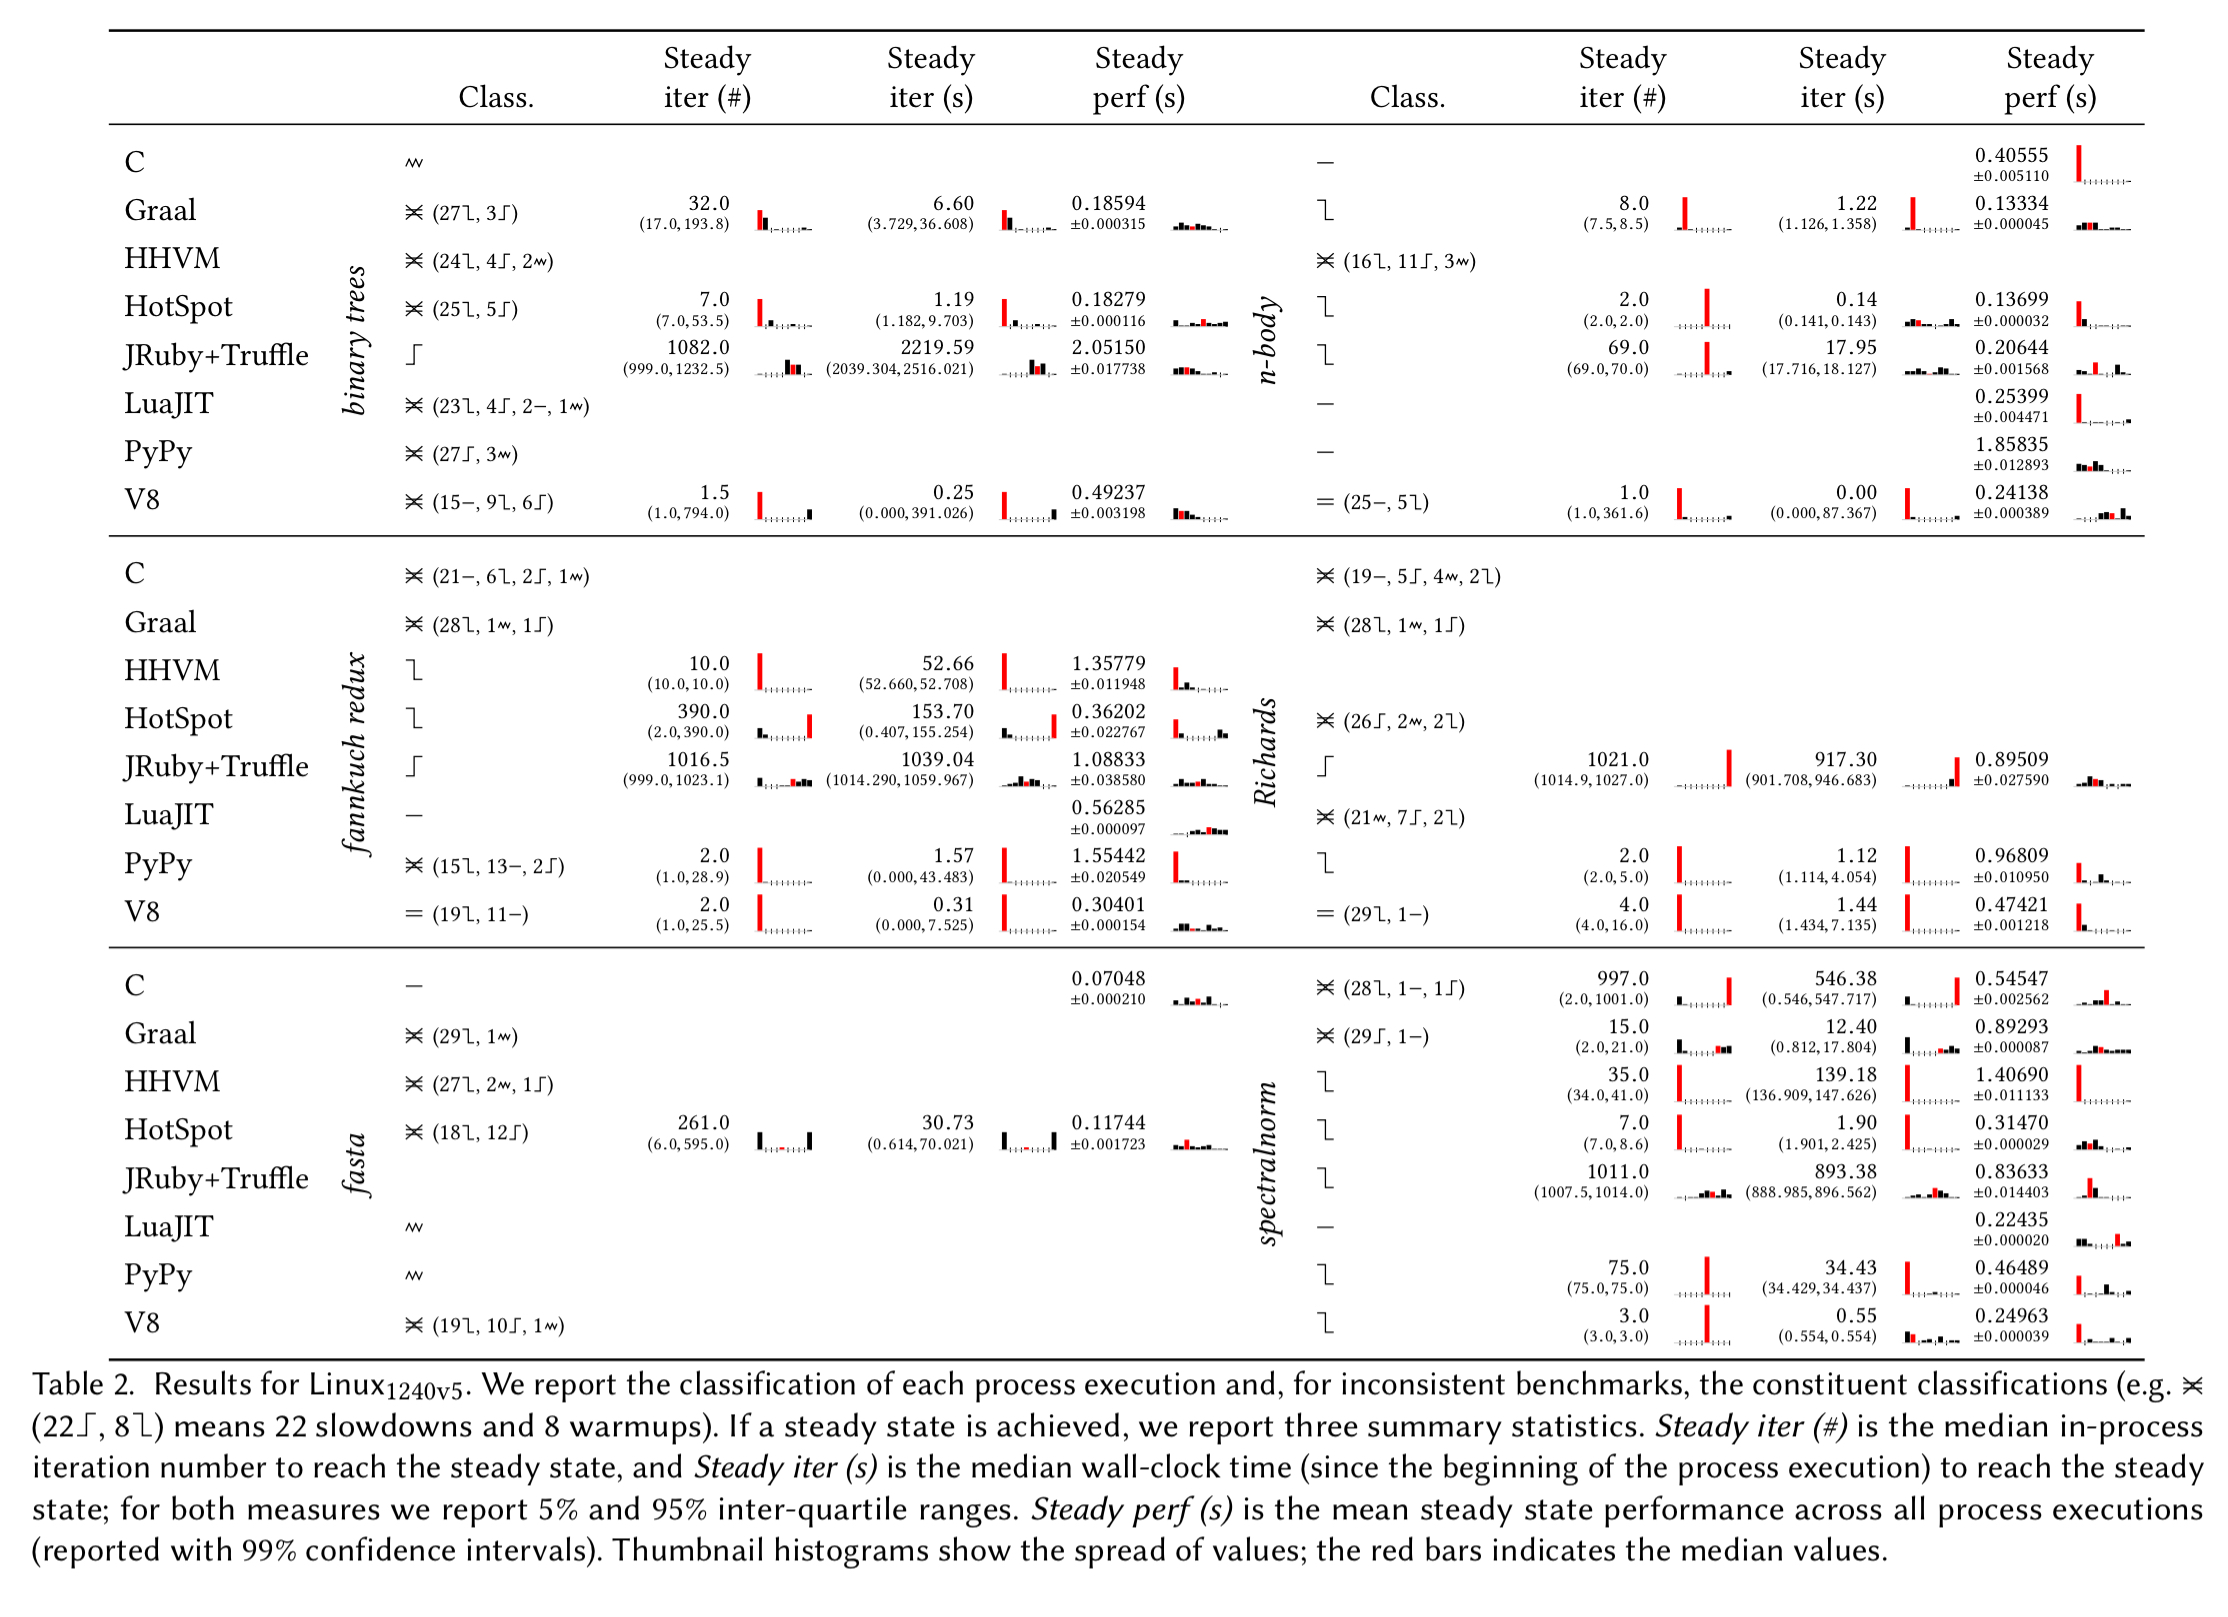
Here’s a breakdown just for one machine, showing that only n-body and spectralnorm come close to ‘good’ warmup behaviour on all machines.
(Enlarge)
VMs seem to mostly either reach a steady state quickly (often in 10 or fewer in-process iterations) or take hundreds of in-process iterations. The latter are troubling because previous benchmarking methodologies will not have run the benchmarks long enough to see the steady state emerge.
Since there are so many cases that do not fit the expected warmup pattern, the authors investigated these to see if H3 holds: that these cases are mostly due to JIT compilation or GC.
The relatively few results we have with GC and JIT compilation events, and the lack of a clear message from them, means that we feel unable to validate or invalidate Hypothesis H3. Whilst some non-warmups are plausibly explained by GC or JIT compilation events, many are not, at least on HotSpot and PyPy. When there is no clear correlation, we have very little idea of a likely cause of the unexpected behaviour.
What now for virtual machine benchmarking?
The results above undermine the VM benchmarking orthodoxy of benchmarks quickly and consistently reaching a steady state after a fixed number of iterations.
We believe that, in all practical cases, this means that one must use an automated approach to analysing each process execution individually. The open-source changepoint analysis approach presented in this paper is one such option.
- Benchmark results should present both warm-up times and steady steady performance. “There are cases in our results where, for a given benchmark, two or more VMs have steady state performance within 2x of each other, but warmup differs by 100-1000x.”
- In-process iterations should be run for around 0.5s, with a minimum acceptable time of 0.1s.
- It is hard to know exactly how many in-process iterations to run, but around 500 can be used most of the time, while occasionally using larger numbers (e.g. 1,500) to see if longer-term stability has been affected.
- Good results should be obtained with 10 process executions, occasionally running higher numbers to identify infrequent performance issues.