Seven rules of thumb for web site experimenters Kohavi et al., KDD’14
Following yesterday’s 12 metric interpretation pitfalls, today we’re looking at 7 rules of thumb for designing web site experiments. There’s a little bit of duplication here, but the paper is packed with great real world examples, and there is some very useful new material, especially around the impact of performance.
Having been involved in running thousands of controlled experiments at Amazon, Booking.com, LinkedIn, and multiple Microsoft properties, we share seven rules of thumb for experimenters, which we have generalized from these experiments and their results… To support these rule of thumb, we share multiple real examples, most being shared in a public paper for the first time.
For each example:
* the data sources are the actual web sites discussed,
* the user samples were all uniformly randomly selected from the triggered population
* sample sizes are at least in the hundreds of thousands of users, with most experiments involving millions.
* all results were statistically significant with p-values below 0.05, usually significantly
* the authors have personal experience with each of them.
The seven rules of thumb are:
- Small changes can have a big impact on key metrics
- Changes rarely have a big positive impact on key metrics
- Your mileage WILL vary
- Speed matters a LOT
- Reducing abandonment is hard, shifting clicks is easy
- Avoid complex designs: iterate
- Have enough users
The fourth rule is an area we are passionate about: speed.
Rules four and six contain important messages with wide impact across the board: simplicity and performance are both really important!
Small changes can have a big impact on key metrics
The message here is not to ignore what seem to be small changes, as sometimes they really can make a big impact. For example, opening search result links in new tabs (once the team had got over the puzzle of the apparent page load time increase) was a trivial coding change that ended up increasing clicks per user by 5%. That makes it one of the best features that MSN had ever implemented in terms of increasing user engagement.
Then there’s the colour example, the like of which the cynic in me is all too ready to dismiss. But moving from the colours on the left, to the colours on the right below ended up adding over $10M to the bottom line annually. The results were initially treated with skepticism, but they held during a much larger trial with 32 million users.

At Bing, two other small changes, which are confidential, took days to develop, and each increased ad revenues by about $100M annually.
So breakthroughs from small changes can happen, but they’re rare. The risk of only focusing on small changes is incrementalism. Make some room for big bets too!
Changes rarely have a big positive impact on key metrics
Be suspicious when they do! (Twyman’s law). If you see improvements in a segment metric, dilute the effect by the segment size. For example, a 10% improvement to a 1% segment has an overall impact of approximately 0.1%.
Most of your seemingly good results will be false positives. You’ve probably seen the common textbook example working out the true chance you have some nasty medical condition given a positive test. It’s the same thing here, and you can use Bayes’ Rule in a similar way to estimate your true chances of having struck gold.
If the probability of a true positive effect is low, i.e., most ideas fail to move key metrics in a positive direction, then the probability of a true effect when the p-value is close to 0.05 is still low.
The true rate of breakthrough improvements at Bing is estimated to be about one in 500, which makes the chances of an apparent breakthrough being the real deal about 3.1%!
One cunning way of moving the odds in your favour is to observe deployed changes by statistically-savvy competitors and try them on your own site too:
If our success rate on ideas at Bing is about 10-20%, in line with other search engines, the success rate of experiments from the set of features that the competition has tested and deployed to all users is higher.
Your mileage WILL vary
Short version: just because someone else reported a great result elsewhere, it doesn’t mean it’s necessarily going to work in your own situation. Treat such case studies as idea generators, but always test for yourself.
Speed matters a LOT
How important is performance? Critical. At Amazon, 100msec slowdown decreased sales by 1% as shared by Greg Linden. A talk by speakers from Bing and Google showed the significant impact of performance on key metrics.
Performance is so important that when it improves, key metrics improve, and when it declines, key metrics decline. In this sense, it dominates many other factors.
Web site developers that evaluate features using controlled experiments quickly realize web site performance, or speed, is critical. Even a slight delay to the page performance may impact key metrics in the treatment.
Here’s one way this can bite you. You want to test a new feature, for example, adding personalised recommendations to a page to try and increase engagement. Since you’re just experimenting at the moment, the initial implementation might not be fully optimised. Let’s say it adds 200ms to the page load time. Contrary to expectation, when you run the experiment engagement goes down! Does that mean personalisation is a bad idea? Not necessarily. The page load time increase may be having a bigger impact than the effect your actually trying to measure. (We assume here that an faster implementation is indeed possible, but takes more effort). So how can you untangle the impact of the performance change from experiment?
The authors have a cunning suggestion: run an experiment injecting a delay in order to measure the performance impact contribution!
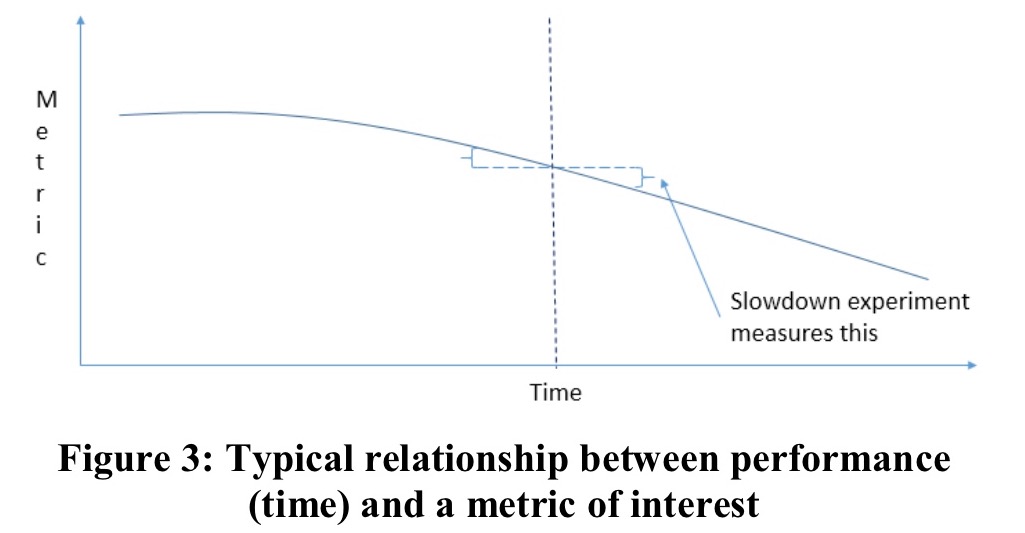
The best way to quantify the impact of performance is to isolate just that factor using a slowdown experiment, i.e., add a delay. Figure 3 shows a graph of depicting a common relationship between time (performance) and a metric of interest (e.g., clickthrough-rate per page, success rate per session, or revenue per user). Typically, the faster the site, the better (higher in this example) the metric value.
Using this information, for each experiment that introduces a delay we can now isolate the contribution from the performance change to see the true underlying impact.
Another observation here is that clearly you need to be continuously monitoring site performance to know when it changes, and if treatments effect it.
Of course, sometimes site performance improves as well. Is it worth investing in such efforts?
We can assess the impact to key metrics if the site were faster, helping us evaluate the ROI (Return-On-Investment) of such efforts. Using a linear approximation (1st-order Taylor expansion), we can assume the impact of the metric is similar in both directions (slowdown and speedup). As shown in Figure 3 (above), we assume that the vertical delta on the right is similar to that on the left. By running slowdown experiments with different slowdown amounts, we have confirmed that a linear approximation is very reasonable for Bing.
As an engineer at heart, it’s very satisfying to me that something like site performance matters so much. It’s nice that e.g., changing CSS colours can help, but knowing that solid engineering likely makes a bigger and much more predictable impact feels good. In fact, if you look at the experiment success rates as e.g., reported by Microsoft, then we have an overall success rate of just under 1 in 3 after accounting for false positives. So if you want to move the needle on key metrics, by far the most certain thing you can invest in is improving your site performance. Nothing else seems to come close to the success from that. If you’ve run any of your own slowdown experiments or have data on the performance effect in your own organisations that you’re able to share I’d love to hear about it.
Disclaimer time: Accel is an investor in Skipjaq, and I’m a personal investor as well. Skipjaq improves your site performance by optimising the configuration of the stack (no code changes required). Run your own slowdown experiments and see what a performance improvement might mean in your own business. If it looks promising, why not give Skipjaq a try!
Here are some collected data points from the paper about the importance of performance:
- Slowdown experiments at Bing showed a 250ms delay at the server impacts revenue at about 1.5%, and clickthrough rate by 0.25%. “This is a massive impact.” 500ms would impact revenue by about 3%.
- An experiment at Google showed a 100-400ms delay caused searches per user to decline 0.2% to 0.6%.
A slowdown experiment at Bing slowed 10% of users by 100ms, and another 10% by 250ms for two weeks. The results of this controlled experiment showed that every 100ms speedup improves revenue by 0.6%. The following phrasing resonated extremely well in our organization (based on translating the above to profit): an engineer that improves server performance by 10ms (than’s 1/30 of the speed that our eyes blink) more than pays for his fully-loaded annual costs. Every millisecond counts.
If you drill down further, you’ll find that beyond baseline improvements, you can get bigger bang for your buck by improving performance of the most important parts of the page. This is the whole ‘what is a good page-load time metric?‘ discussion. Bing’s key time-related metric is Time-to-Success (TTS) which sidesteps some of these issues. Success is considered to be a clicked search result link from which the user does not return within 30 seconds.
Reducing abandonment is hard, shifting clicks is easy
I’ll keep this one brief as well, since we looked at it yesterday. It’s relatively easy to find improvements that make one part of your page/site better, but often these come at the expense of other parts of the page. Whether or not the results should then be considered positive needs to be evaluated in the global context.
This rule of thumb is extremely important because we have seen many experiments (at Microsoft, Amazon, and reported by others) where a module or widget was added to the page with relatively good click-through rates. The claim is made that new module is clearly good for users because users are clicking. But if the module simply cannibalized other areas of the page, as shown in the examples above, it is only useful if those clicks are better, however “better” is defined for the site (e.g., they lead to higher success or purchases, etc.). Phrased differently: local improvements are easy; global improvements are much harder.
Avoid complex designs: iterate
This one is simple, but it’s an important point in the world of data-driven companies.
Good experimental design is vital to getting the best results from experiments… Our experience is that simple designs are best in the online world and given the many pitfalls, they are easier to understand, run sanity checks, and thus more trustworthy. A complex design is usually not only unnecessary, but can hide bugs. [Emphasis mine]
Beyond simple site design, simple experiment design also wins. The authors give several examples of situations were too much was changed / tested at once, and when the results tanked, it was really hard to unpick why.
While the literature on Multi-Variable Testing (MVT) is rich, and commercial products tout their MVT capabilities, we usually find it more beneficial to run simple univariable (e.g., A/B/C/D variant of a feature) or bi-variable designs.
At Microsoft, teams are encouraged to deploy new code quickly, and use experiments control the rollout, starting from 1% increments.
Have enough users
We looked at this one yesterday as well. You need big enough samples! The authors provide a rule of thumb for assessing the number of users needed to make a distribution of the mean be well approximated by a normal distribution (a common assumption in experiment methodologies, per the Central Limit Theorem). I’m out of space to do it justice, so if you’re interested, do check out the full paper!