Dhalion: Self-regulating stream processing in Heron Floratou et al., VLDB 2017
Dhalion follows on nicely from yesterday’s paper looking at the modular architecture of Heron, and aims to reduce the “complexity of configuring, managing, and deploying” streaming applications. In particular, streaming applications deployed as Heron topologies, although the authors are keen to point out the principles could be applied in other engines too.
Dhalion is a system that essentially allows stream processing frameworks to become self-regulating. Dhalion has been implemented and evaluated on top of Twitter Heron and we are in the process of releasing it to open-source as a contributed to the Heron code base. However, its architecture and basic abstractions are also applicable to other streaming engines as well.
And does self-regulating mean exactly? Floratou et al. break it down into three components:
- The system should be able to self-tune: given a topology and a desired SLO, it should be able to automatically tune configuration parameters to achieve the stated objective.
- The system should then be able to self-stabilise to continue to maintain that SLO in the face of changing workload (e.g., a sudden surge of tweets). (This functionality is more commonly referred to as auto-scaling).
- The system should be able to detect service degradations (gray failures?), diagnose the internal faults causing them, and take actions to recover from them. (Self-healing).
Let’s pause for a moment and think about what might be necessary to achieve those goals. Clearly there has to be some kind of monitoring to observe the system status (perhaps from multiple perspectives), with alerts/events generated when an abnormal situation is detected or SLOs are not being met. Then we’ll need a way to map from alert conditions back to causes, and finally given a determined cause or cause(s) we’ll need a way to take corrective action to address the situation. While we’re doing all this, we’ll need to be careful about feedback loops too in case our interventions themselves cause the system to become unstable or to oscillate between configurations degrading performance.
The first three of those requirements are satisfied by Dhalion’s symptom detectors, diagnosers, and resolvers. Dhalion has only rudimentary mechanisms to control feedback though: actions shown not to help can be blacklisted (“if it hurts, stop doing it!”), and after taking an action, the system waits for a reasonable period of time before considering any further interventions. In the evaluation, these two measures seem to be enough to exhibit desirable behaviours, but it would have been nice to have some reference to control theory, which is a whole branch of science dedicated to achieving stability around a setpoint.
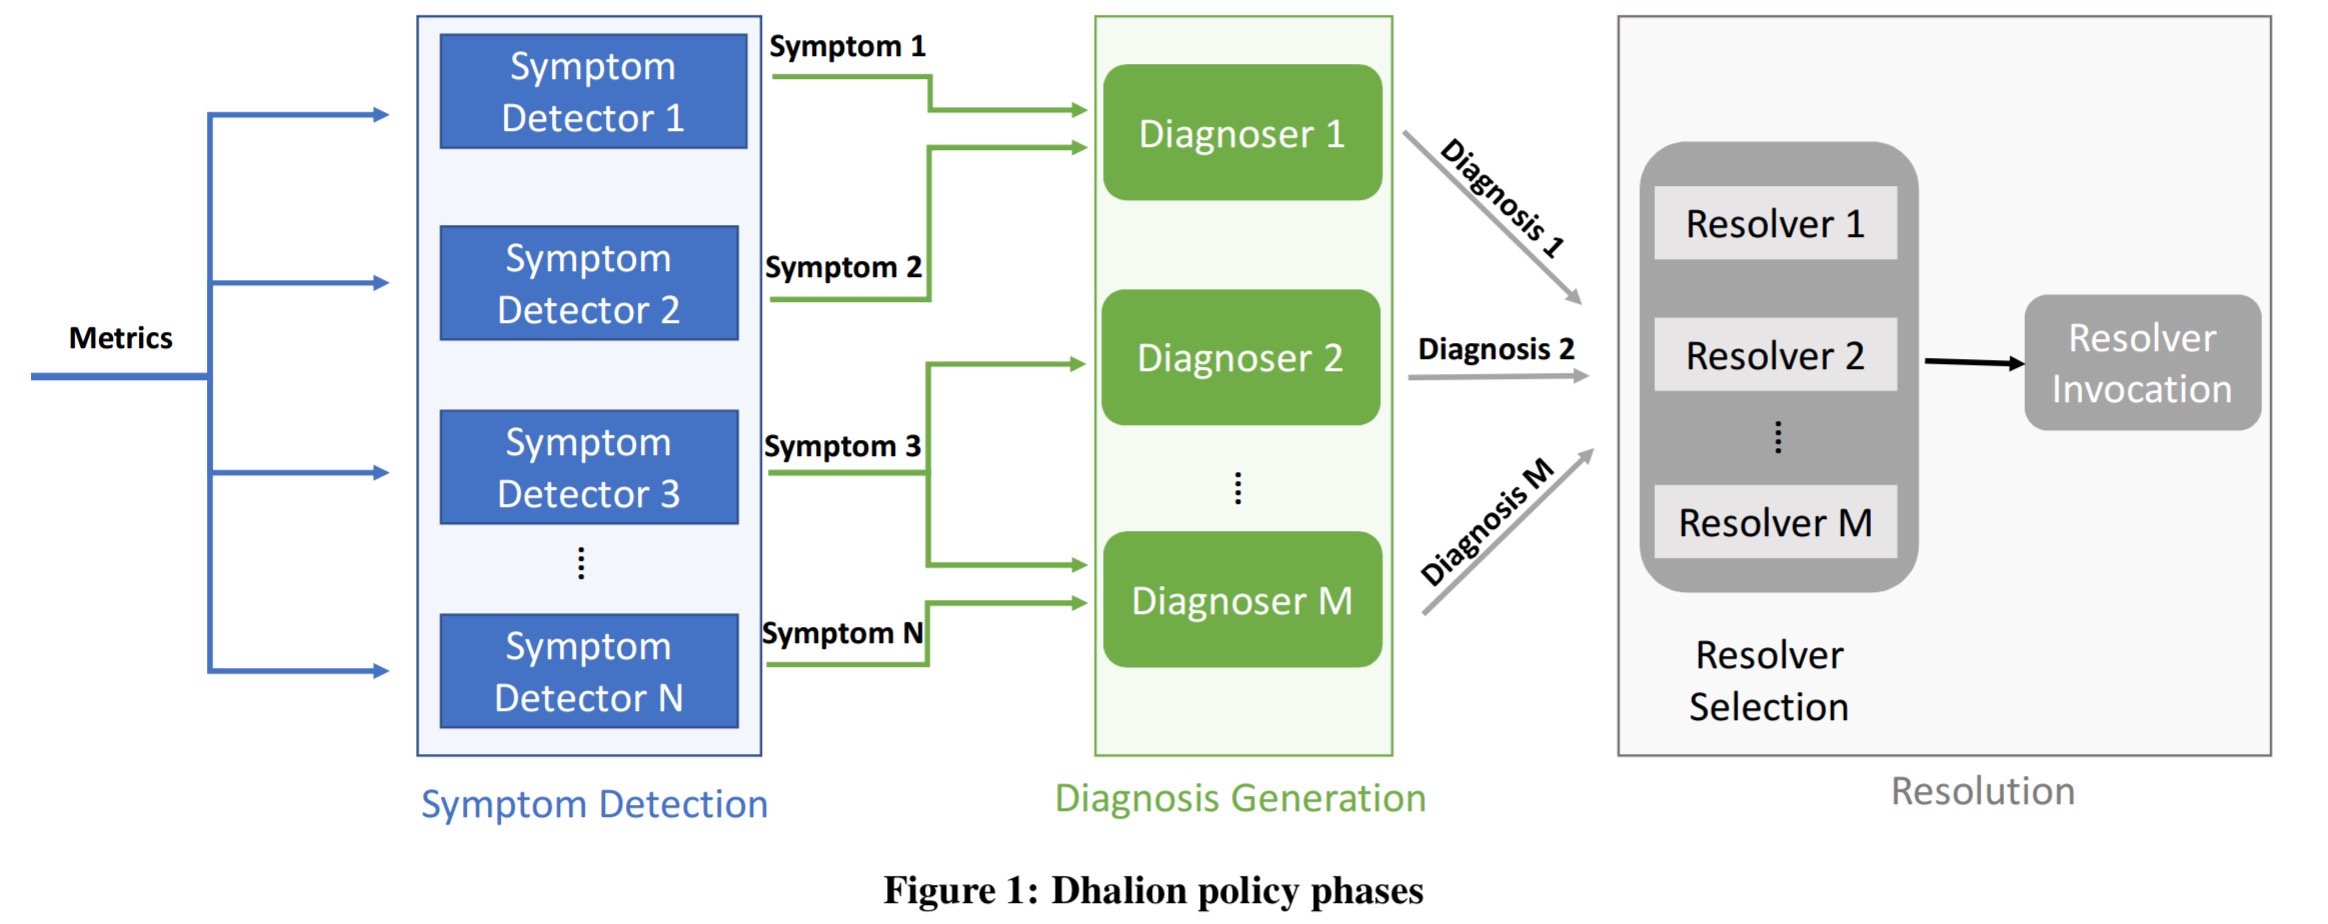
Symptom detectors collect metrics from the underlying streaming system (for example, tuple processing rates, and number of packets pending). From these metrics Dhalion looks for symptoms that may be evidence of a problem – for example, is the system having to apply backpressure, or is there processing skew across the tasks of a particular pipeline stage? A symptom description contains a compact representation of the symptom together with the metric values used to identify it.
Detected symptoms are passed to the diagnosers which seek to find explanations for the symptoms. Such
For example, the existence of backpressure can be attributed to various reasons such as resource underprovisioning at a particular stage, slow hosts/machines or data skew. Dhalion produces all the possible diagnoses that can explain the observed symptoms.
In the examples given in the paper, the diagnosers all look to be hand-coded rules, but you could in theory plug in machine learned classifiers or other such trickery.
Given a set of (possible) diagnoses, resolver selection explores possible actions to resolve the situation, which are then carried out by the resolvers. Typically there is a one-to-one mapping between diagnoses and resolvers. Major topology changes such as scaling up and down resources or restarting containers are typically invoked through the Heron Scheduler component.
… after every action is performed, Dhalion evaluates whether the action was able to resolve the problem or brought the system to a healthier state. If an action does not produce the expected outcome then it is blacklisted and it is not repeated again.
(Strictly, Dhalion tracks the ratio of unsuccessful interventions to invocations for a given action and diagnosis, and blacklists the action for that diagnosis when the ratio crosses a given threshold).
Let’s see how this all comes together for a couple of use cases: dynamic resource provisioning, and SLO maintenance.
Dynamic resource provisioning (autoscaling)
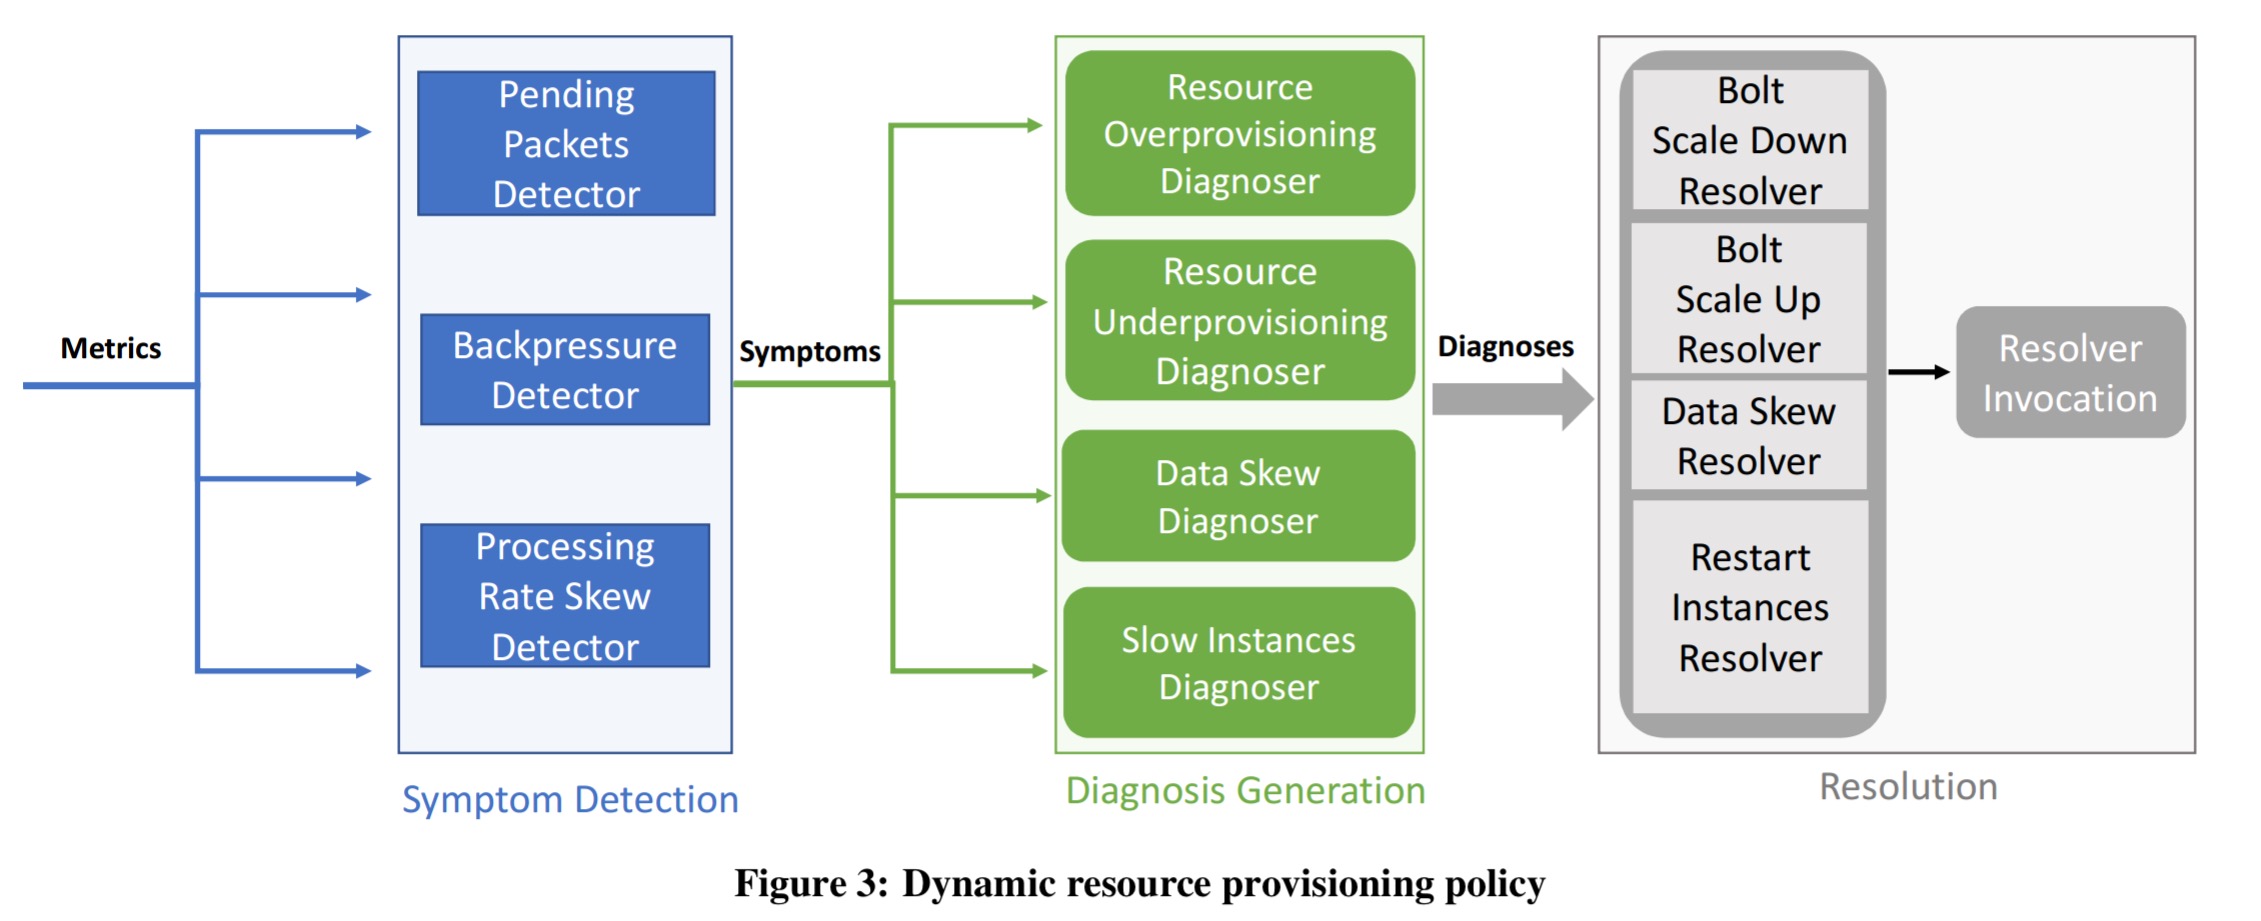
The Dhalion Dynamic Resource Provisioning Policy tries to maximise throughput while also avoiding under-utilisation. There are three different symptom detectors, four diagnosers, and four possible resolution.
Detectors
- The pending packets detector monitors the number of pending packets in Heron instance queues for bolts. It looks to see whether all of the instances have a similar queue size or whether there are outliers.
- The backpressure detector generates a symptom description whenever backpressure is being applied. This description includes the bolt that is the source of the backpressure and the amount of time input data consumption was suspended during the 300 second measurement period.
- The processing rate skew detector looks for mismatches in the number of tuples processed by each Heron instance.
Diagnosers.
- The resource overprovisioning diagnoser looks at the symptoms from the pending packets and backpressure detectors and considers. If there is no backpressure and the average number of pending packets across instances of a bolt is almost zero, then it is possible the resources assigned to the bolt are over-provisioned.
- The resource underprovisioning diagnoser considers whether observed backpressure could be the result of of underprovisioned resources. It attributes the cause when all the instances of a bolt have similar processing rates and queue sizes.
- The slow instance diagnoser attributes observed backpressure to a slow instance when the instances initiating backpressure have a much higher number of pending packets than their peers and the similar processing rates. (The processing rates are similar because all instances operate at the speed of the slow instance).
- The data skew diagnoser attributes observed backpressure to data skew when the instances initiating backpressure have a higher processing rate and a higher number of pending packets than their peers.
Resolution
- If a resource overprovisioning diagnosis is made, then the bolt scale down resolver decreases the number of Heron instances associated with the bolt. The scale down factor is a configuration option. If the action results in backpressure the operation will be blacklisted and a subsequent scale up operation will bring the topology back to a healthy state.
- The restart instance resolver moves slow instances to new containers (i.e., kills the slow one and restarts it?).
- The data skew resolver adjusts the hash function used to distributed data to the bolts.
- The scale up resolver scales up the resources dedicated to a bolt initiating an underprovisioning diagnosis. “To determine the scale up factor, the Resolver computes the percentage of the total amount of time that the Heron Instances spent suspending the input data over the amount of time where backpressure was not observed.”
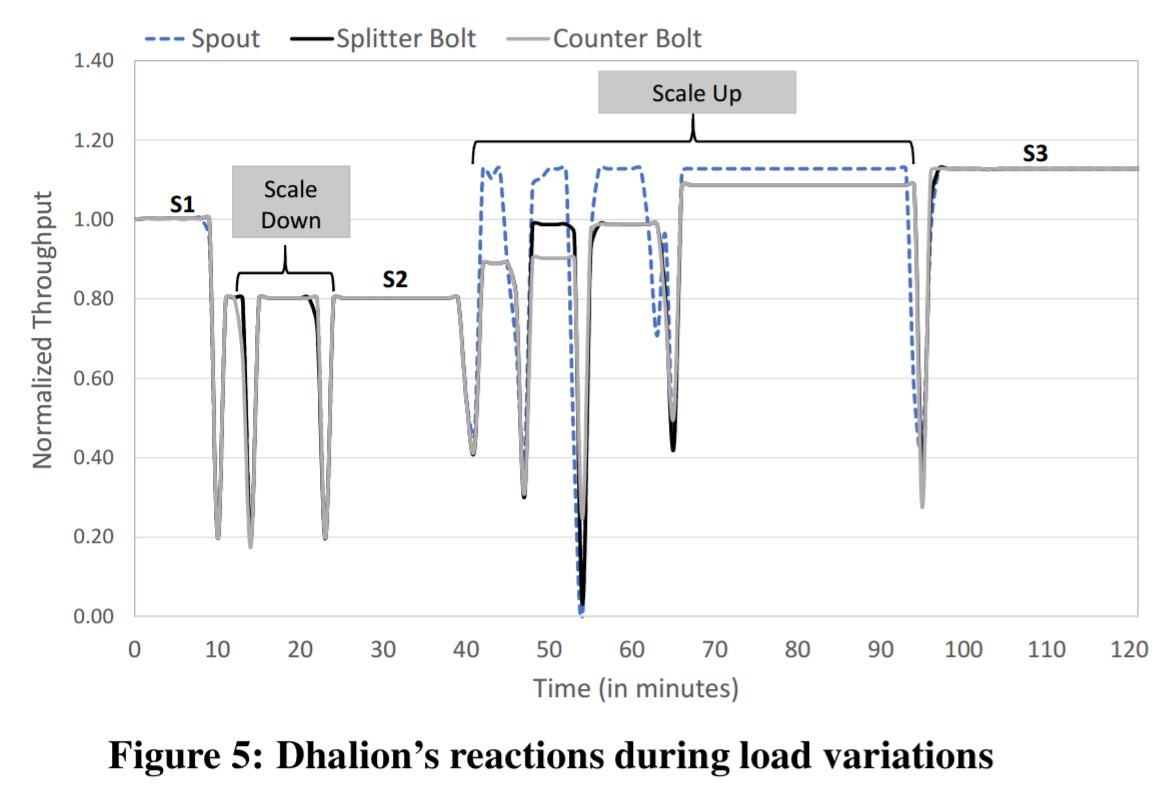
Here’s an example of dynamic resource provisioning at work while the workload is manipulated:
SLO maintenance
We observe that in a large number of streaming applications, users spend a significant amount of time tuning the topology to meet the requirement of a throughput above a certain threshold.
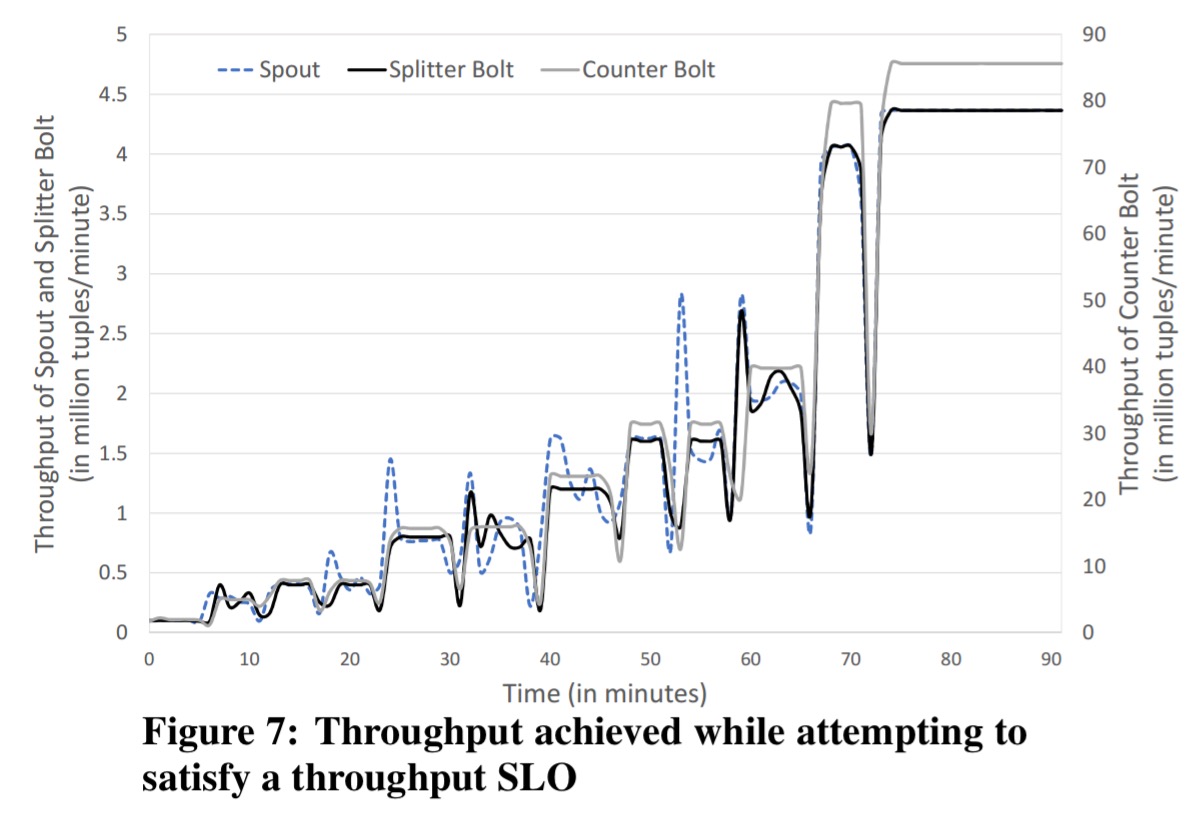
In their experiment, the authors simply submit a topology with a single Heron instance provisioned for each spout and bolt, and provide an SLO asking for at least 4 million tuples a minute at steady state. Dhalion is able to figure out a configuration that meets this objective as you can see in the figure below – although it does take about 70 minutes to do so!
The Dynamic Resource Provisioning Policy that we previously presented, assumes that the input data rate is given and attempts to allocate resources so that the system can handle the input data load as it varies over time. The Throughput SLO Policy goes a step further by attempting to adjust the input data rate by increasing the number of Heron Instances that belong to the spouts, in order to meet the performance SLO.
It uses an additional symptom detector, diagnoser, and resolver:
- The emit count detector computes the total rate at which a spout emits data and forwards it to the throughput SLO violation diagnoser.
- The diagnoser checks whether the topology is in a healthy state. If it is healthy, and the throughput doesn’t meet the required SLO, it emits a diagnosis that is forwarded the spout scale up resolver.
- You can probably guess what the spout scale up resolver does: it scales up the resources associated with the spout.
The last word
Note that although Dhalion has been implemented on top of Heron, its architecture and basic policy abstractions can be adopted by other streaming engines as long as they provide a metrics collection API and potentially a scaling API.