The Mystery Machine: End-to-end performance analysis of large-scale internet services – Chow et al. 2014
Google’s Dapper paper is very well known, but Facebook’s Mystery Machine seems to be much less well known – and that’s a shame because I have a hunch the approach could be very relevant to many people.
Current debugging and optimization methods scale poorly to deal with the complexity of modern Internet services, in which a single request triggers parallel execution of numerous heterogeneous software components over a distributed set of computers. The Achilles’ heel of current methods is the need for a complete and accurate model of the system under observation: producing such a model is challenging because it requires either assimilating the collective knowledge of hundreds of programmers responsible for the individual components or restricting the ways in which components interact.
Facebook’s Mystery Machine can measure end-to-end performance from the initiation of a page load in a web browser, all the way through the server-side infrastructure, and back out to the point where the page has finished rendering. Doing this requires a causal model of the relationships between components (happens-before). How do you get that? And especially, how do you get that if you can’t assume a uniform environment for instrumentation?
Many prior systems assume that one can generate such a model by comprehensively instrumenting all middleware for communication, scheduling, and/or synchronization to record component interactions. This is a reasonable assumption if the software architecture is homogeneous; for instance, Dapper instruments a small set of middleware components that are widely used within Google.
Facebook isn’t like that. And nor are many other companies internal systems….
… many systems are like the Facebook systems we study; they grow organically over time in a culture that favors innovation over standardization (e.g., “move fast and break things” is a well-known Facebook slogan). There is broad diversity in programming languages, communication middleware, execution environments, and scheduling mechanisms. Adding instrumentation retroactively to such an infrastructure is a Herculean task. Further, the end-to-end pipeline includes client software such as Web browsers, and adding detailed instrumentation to all such software is not feasible.
So instead, Facebook infer causal relationships from the regular logs produced by application components:
Our key observation is that the sheer volume of requests handled by modern services allows us to gather observations of the order in which messages are logged over a tremendous number of requests. We can then hypothesize and confirm relationships among those messages. We demonstrate the efficacy of this technique with an implementation that analyzes over 1.3 million Facebook requests to generate a comprehensive model of end-to-end request processing.
And this is quite handy because pretty much everything already generates logs. Facebook relies on a minimum of common content for log messages: a request identifier, a host identifier, a host-local timestamp, and a unique event label. The output from all logs is aggregated into a UberTrace service.
We made minimal changes to existing logging systems in order to map existing log messages to the UberTrace schema. We modified log messages to use the same global identifier, and we made the event or task name more human-readable. We added no additional log messages. Because we reused existing component logging and required only a minimal schema, these logging changes required approximately one person-month of effort.
UberTrace consistently samples a small fraction of requests for end to end tracing. Trace data is written to Scribe, Facebook’s distributed logging service, and the logs are stored in tables in a data-warehousing infrastructure called Hive. The Mystery Machines runs batch Hadoop jobs over the data to infer causal relationships.
The Mystery Machine uses the traces generated by UberTrace to create a causal model of how software components interact during the end-to-end processing of a Facebook request. It then uses the causal model to perform several types of distributed systems performance analysis: finding the critical path, quantifying slack for segments not on the critical path, and identifying segments that are correlated with performance anomalies. The Mystery Machine enables more targeted analysis by exporting its results through a relational database and graphical query tools.
The Mystery Machine
The Mystery Machine (TMM) pre-processes log records to turn them into segments – the execution interval between two separate log records for the same task. Then TMM begins the process of identifying causal relationships. It starts by assuming that everything causes everything, by generating all possible hypotheses for casaul relationships among segments. Then it works through the corpus of traces and rejects a hypothesis if it finds a counterexample in any trace.
There are three types of relationship that TMM infers:
- Happens-before – if the start time of segment B is after the start time of segment A in all requests. (I.e., we can reject a happens-before hypothesis the moment we see a single overlapping pair of trace segments).
- Mutual exclusion – segments A and B never overlap. (In contrast to happens-before, which only allows the ordering [A,B], mutual exclusion allows both [A,B] and [B,A]).
- Pipeline – two tasks t1 and t2 have a pipeline dependency such that if t1 processes data elements in the order d1,d2,d3, then so does t2, and for each pair the processing of the data item in t1 happens-before the processing of the same data item in t2.
This of course all relies on some global understanding of time, whereas log records will have been written using local time:
Since all log timestamps are in relation to local clocks, UberTrace translates them to estimated global clock values by compensating for clock skew. UberTrace looks for the common RPC pattern of communication in which the thread of control in an individual task passes from one computer (called the client to simplify this explanation) to another, executes on the second computer (called the server), and returns to the client. UberTrace calculates the server execution time by subtracting the latest and earliest server timestamps (according to the server’s local clock) nested within the client RPC. It then calculates the client-observed execution time by subtracting the client timestamps that immediately succeed and precede the RPC. The difference between the client and server intervals is the estimated network round-trip time (RTT) between the client and server. By assuming that request and response delays are symmetric, UberTrace calculates clock skew such that, after clock-skew adjustment, the first server timestamp in the pattern is exactly 1/2 RTT after the previous client timestamp for the task.
UberTrace makes multiple estimates in this manner, and uses the one that yields the lowest observed RTT.
Figure 2 in the paper shows a nice illustration of TMM at work. It is in essence a sieve-based algorithm.
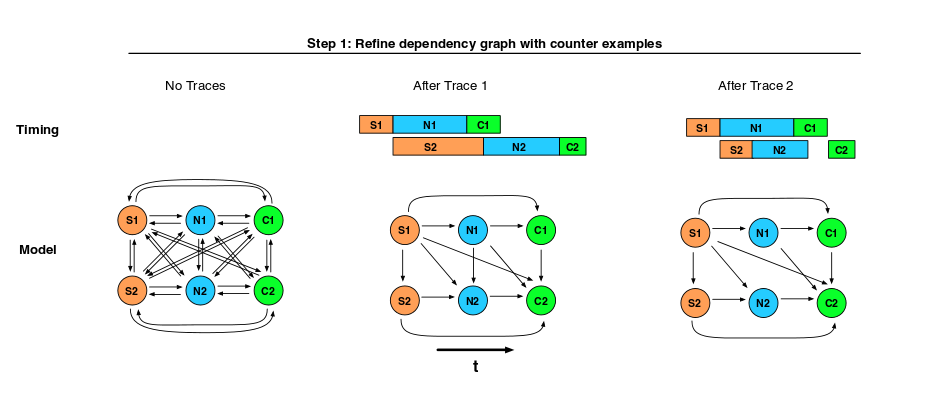
The Mystery Machine assumes that the natural variation in timing that arises over large numbers of traces is sufficient to expose counterexamples for incorrect relationships.
1.3 million requests gathered over 30 days confirm this hypothesis: “As the number of traces analyzed increases, the observation of new counterexamples diminishes, leaving behind only true relationships. Note that the number of total relationships changes over time because developers are continually adding new segments to the pipeline.”
To validate the causal model produced by the Mystery Machine, we confirmed several specific relationships identified by the Mystery Machine. Although we could not validate the entire model due to its size, we did substantial validation of two of the more intricate components: the interplay between JavaScript execution on the client and the dependencies involved in delivering data to the client. These components have 42 and 84 segments, respectively, as well as 2,583 and 10,458 identified casual relationships.
It took about 2 hours on a Hadoop cluster to analyse 1.3M requests sampled over a 30 day period. The computation was parallelized to make it feasible to run every night as a batch job. This allows the inferred causal dependencies to evolve alongside the deployed system:
A key characteristic of The Mystery Machine is that it discovers dependencies automatically, which is critical because Facebook’s request processing is constantly evolving. As described previously, The Mystery Machine assumes a hypothesized relationship between two segments until it finds a counterexample. Over time, new segments are added as the site evolves and new features are added. The Mystery Machine automatically finds the dependencies introduced by the new segments by hypothesizing new possible relationships and removing relationships in which a counterexample is found….To account for segments that are eliminated and invariants that are added, one can simply run a new Hadoop job to generate the model over a different time window of traces.
Given the inferred casual model, TMM performs three different types of performance analysis: critical path, slack, and anomaly detection.
Critical Path
The critical path is defined to be the set of segments for which a differential increase in segment execution time would result in the same differential increase in end-to-end latency. The Mystery Machine calculates the critical path on a per-request basis. It represents all segments in a request as a directed acyclic graph in which the segments are vertices with weight equal to the segment duration. It adds an edge between all vertices for which the corresponding segments have a causal relationship. Then, it performs a transitive reduction in which all edges A → C are recursively removed if there exists a path consisting of A →B and B → C that links the two nodes. Finally, The Mystery Machine performs a longest-path analysis to find the critical path from the first event in the request (the initiation of the request) to the last event (which is typically the termination of some JavaScript execution). The length of the critical path is the end-to- end latency of the entire request. If there are equal-length critical paths, the first discovered path is chosen.
In normal operation TMM is asked to calculate the critical path for large numbers of traces and aggregate the results. “For instance, we might ask how often a given segment falls on the critical path or the average percentage of the critical path represented by each segment.”
Slack
Slack is what you get when you are not on the critical path…
We define slack to be the amount by which the duration of a segment may increase without increasing the end-to-end latency of the request, assuming that the duration of all other segments remains constant. By this definition, segments on the critical path have no slack because increasing their latency will increase the end-to-end latency of the request.
Slack results are typically aggregated over a large number of traces.
Anomaly Detection
One special form of aggregation supported by The Mystery Machine is anomaly analysis. To perform this analysis, it first classifies requests according to end-to-end latency to identify a set of outlier requests. Currently, outliers are defined to be requests that are in the top 5% of end-to-end latency. Then, it performs a separate aggregation of critical path or slack data for each set of requests identified by the classifiers. Finally, it performs a differential comparison to identify segments with proportionally greater representation in the outlier set of requests than in the non-outlier set. For instance, we have used this analysis to identify a set of segments that correlated with high latency requests. Inspection revealed that these segments were in fact debugging components that had been returned in response to some user requests
The Mystery Machine in Action
The paper closes with two extended examples of using the analyses performed by TMM to gain improved understanding of Facebook systems. Firstly for critical path analysis of the Facebook home page on the web, and secondly for reducing latency.
The global view provided by TMM helps to focus effort in the right places:
The comparison of the total delay and critical path bars reveals the importance of The Mystery Machine—by examining only the total latency breakdown (e.g., if an engineer were profiling only one system component), one might overestimate the importance of network latency and JavaScript processing on end-to-end performance. In fact, the server and other client processing segments are frequently critical, and the overall critical path is relatively balanced across server, client, and network.
The second case study is interesting because it uses The Mystery Machine to perform early exploration of a potential performance optimization—differentiated service—without undertaking the expense of implementing the optimization.
Intuitively, small slack implies that server latency is strongly correlated to end-to-end latency; indeed, with a slack of zero we expect any increase in server latency to delay end-to-end latency by the same amount. Conversely, when slack is large, we expect little correlation between server latency and end-to-end latency; increases in server latency are largely hidden by other concurrent delays. We validate our notion of slack by directly measuring the correlation of server and end-to-end latency.
Slack reported on previous requests turns out to be a good predictor of slack on future requests (a hypothesis also validated using TMM). Given this prediction, it’s possible to improve average latency:
By using predicted slack as a scheduling deadline, we can improve average response time in a manner similar to the earliest deadline first real-time scheduling algorithm. Connections with considerable slack can be given a lower priority without affecting end-to-end latency. However, connections with little slack should see an improvement in end-to-end latency because they are given scheduling priority. Therefore, average latency should improve. We have also shown that prior slack values are a good predictor of future slack. When new connections are received, historical values can be retrieved and used in scheduling decisions. Since calculating slack is much less complex than servicing the actual Facebook request, it should be feasible to recalculate the slack for each user approximately once per month.