PerfBlower: Quickly Detecting Memory-Related Performance Problems via Amplification – Fang et al. 2015
Another ECOOP ’15 paper, and definitely something with immediate pragmatic utility. PerfBlower finds heap-related performance problems during regular test runs (not exhaustive performance tests) by amplifying the effects of small issues to make them visible. The user provides details of classes of problems (not necessarily specific to any one application) that PerfBlower should look for, and optionally application specific information as well. PerfBlower then compiles these definitions to produce an instrumented JVM (not as scary as it sounds!) which is used to run your tests. The results are very impressive.
Performance problems are notoriously difficult to find and fix because visible performance degradation is often an accumulation of the effects of a great number of invisible problems that scatter all over the program. These problems all seem harmless unless they are triggered together under a large workload, wherein their effects multiply and manifest, preventing the program from reaching its performance/scalability goals.
…
In this paper, we propose a general performance testing framework, called PerfBlower, that can “blow up” the effect of small performance problems so that they can be easily captured during testing. Finding general performance problems is infeasible, as it requires finding an alternative, more efficient computation in a possibly infinite solution space. We first narrow our focus onto a class of performance problems that have observable symptoms; their symptoms can be expressed by logical statements over a history of heap updates. These problems include, to name a few, memory leaks, inefficiently-used collections, unused return values, or loop-invariant data structures. One common axis that centers around these problems is that they manifest in the form of inefficient data usage, and their symptoms can be identified by capturing and comparing heap snapshots. Many performance problems are caused by redundant computations; although they are not directly data-related, data inefficiencies can still be seen as a result of redundant computations.
The Instrumentation Specification Language (ISL) provides amplify and deamplify commands that developers to add memory penalties to an object upon observing a symptom, and remove them on observing counter-evidence. ISL has the feel of a domain-specific aspect language.
Our amplification is on a per-object basis: a memory penalty is created and associated with each object that satisfies the symptom specified in ISL (i.e., at the moment the object becomes “suspicious”). Instead of requesting actual memory as penalties, which would incur significant space overhead, we create virtual penalties by maintaining a penalty counter (PC) inside each object to track the size of the penalty created for the object. During each garbage collection (GC), we identify the real heap usage of the program and then compute a virtual heap consumption by adding up the PC for each object and the real heap consumption. The virtual heap consumption is then compared to the real heap consumption to compute a virtual space overhead (VSO). VSO provides an automated test oracle: our experimental results show that the overall VSOs for benchmarks with and without real performance problems are, respectively, 20+ times and 1.5 times. The gap is sufficiently large so that test runs triggering bugs can be easily identified.
How well does PerfBlower work?
To implement the proposed technique, we have modified both the baseline compiler and the optimizing compiler in the Jikes Research Virtual Machine (RVM), version 3.1.3, which uses the MarkSweep GC. PerfBlower is now available on BitBucket for download. Using ISL, we have implemented three different amplifiers that target, respectively, memory leaks, under-utilized containers, and over-populated containers. In our evaluation, no application-related information was added into these descriptions, although a future user may describe a symptom in a way that is specific to an application. These ISL programs were easy to write and took us only a few hours.
Programs tested include antlr, eclipse, jython, hsqldb, xalan, and mysql. These were exercised using the small workload setting from the DaCapo benchmark suite.
We make no assumption about test inputs – real-world developers can enable amplification when executing a regular test suite; whenever a test case triggers a true problem, amplification will incur a large virtual overhead.
The virtual space overhead reports clearly and quickly show the sources of potential problems, see table 2 reproduced from the paper below:
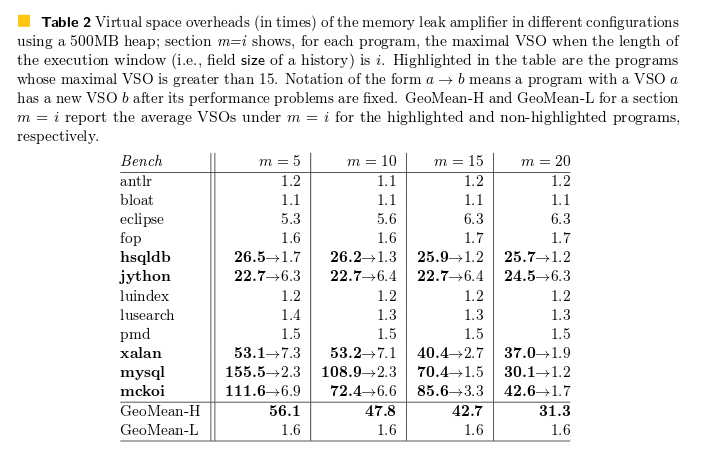
PerfBlower uses approximately 1.25x the space and 2-3x the execution time of an uninstrumented run.
We have manually inspected our reference path report for each highlighted program in Table 1 and Table 2. We have not found any highlighted program to be mistakenly amplified, that is, real performance problems are identified in all of them. We have studied a total of 10 amplification reports and found 8 unknown problems that have never been reported in any prior work. Furthermore, all of these problems are uncovered under small workloads; their executions do not exhibit any abnormal behavior without amplification.
- The leak found and fixed in Xalan resulted in a 25.4% reduction in memory consumption and a 14.6% reduction in execution time.
- A leak fixed in jython led to a 24.3% peak memory reduction
- Fixing an hsqldb leak led to a 15.6% memory reduction
- Reducing allocation for over-allocated maps in hsqldb led to a 17.4% space reduction
- Taming aggressive string buffer expansion in jython led to a 19.1% space reduction
- Tuning initial capacity allocations in xalan led to 5.4% memory reduction, and 34.1% execution time reduction
- Fixing a problem with unused object creation in hsqldb gives a 14.9% space reduction
Not a bad haul for simply running the regular test suites!
Our amplifiers are able to find bugs in all of the highlighted programs, but do they miss bugs? To answer this question, we performed an additional experiment. In this experiment, the benchmark set includes 14 programs (shown in Table 4), which contain known performance problems reported in the literature…
PerfBlower finds them all, bar one which is not exercised at all by the program’s test suite.
A quick look at the ISL
Let’s disect an ISL program designed to find memory leaks caused by unneccessary strings held in object arrays.
Context ArrayContext {
  sequence = "*.main,*";
  type = Object[];
}
A context construct is designed for the developer to express the scope of the objects of interest. Context has three properties: sequence, type, and path, each of which defines a constraint in a different aspect. They can be used to specify, respectively, the calling context, the type, and the reference path for the objects to be tracked. For example, context ArrayContext narrows the scope of the heap to objects of type Object[] created under calling contexts that match string “.main, *”, where * is used as a wildcard. This string matches all call chains that start with an invocation of method “.main”.
Context TrackingContext {
  sequence = "*.main,*";
  path = ArrayContext;
  type = "String";
}
TrackingContext describes the constraint that we are only interested in the String objects that are (1) created under context “*.main, *” (i.e., defined by sequence), and (2) reachable directly from the array objects created under the same calling context in the object graph (i.e., defined by path).
History UseHistory {
  type = "boolean";
  size = HISTORY_SIZE;
}
A History construct is such an abstraction that models the heap update history (i.e., in an execution window) that needs to be tracked on the objects of interest. A history has two important properties: the type of a history element (i.e., type) and the length of the execution window tracked by the history (i.e., size). The element type has to be a primitive type because tracking a program execution often requires collaborative work between the mutator and the collector; creating tracking objects during a GC would not be allowed. The length of the execution window specifies how many user-defined state updates can be recorded in the history. The recorded updates will be used to determine whether a symptom is seen.
Partition P {
  kind = all;
  history = UseHistory;
}
A Partition construct can be used to define the partitioning of the heap needed by an analysis. Properties kind and history specify, respectively, how the heap should be partitioned and what history should be attached to each heap partition. In other words, one history instance (as defined in History) will be created and maintained for each partition of the heap defined by kind. kind can have five different values—all, context[i], alloc, type, and single—which specify heap abstractions with increasing levels of granularity.
In this instance partition = all says that we want a separate history for each individual object.
TObject MyObj {
  include = TrackingContext;
  partition = P;
  instance boolean useFlag = false;
}
TObject defines the type of objects to be tracked, using two properties, include and partition, that specify the tracking context and the heap partitioning, respectively. In our example, the system tracks objects under the context TrackingContext and creates a history for each tracked object… The keyword
instance can be used to declare (primitive-typed) per-object metadata information.
Event on_rw(Object o, Field f, Word w1, Word w2) {
  o.useFlag = true;
  deamplify(o);
}
At the center of an ISL program is a set of event constructs that define what to do when important events occur on tracked objects. ISL supports seven different events: alloc, read, write, rw, call, reached, and reachedOnce.
Event on_reachedOnce(Object o) {
  UseHistory h = getHistory(o);
  h.update(o.useFlag);
  if (h.isFull() && !h.contains(true)) {
    amplify(o);
  }
}
In our example, the events rw and reachedOnce specify the symptom of a memory leak and when to amplify its effect. Once a tracked object o is used (i.e., read or written), we set its useFlag true. Since we see a use of the object, we call a library method deamplify to cancel all the space penalty previously added to o. When o is reached in a reachedOnce event, we update the history associated with o’s partition with o.useFlag. Since the history is defined to track only the most recent HISTORY_SIZE updates, the update operation will add the current boolean value and discard the oldest value from the history if it is full. Finally, if the history has a full record of HISTORY_SIZE updates (i.e., isFull returns true) and the record does not contain any true value, object o is stale and thus we add space penalty to amplify the staleness effect by calling method amplify.