Declarative Interaction Design for Data Visualization – Satyanarayan et al. 2015
We’ve looked at the power of declarative approaches before when it comes to data and distribution (The Declarative Imperative, Bloom, Edelweiss, and of course let’s not forget SQL itself!); today’s paper applies a declarative approach to interactive data visualizations. With thanks to Dion Almaer for bringing this paper to my attention via twitter.
Declarative languages decouple specification (the what) from execution (the how). Popular in domains ranging from web design (e.g., HTML/CSS) to database queries (e.g., SQL), declarative languages are now widely used to design custom data visualizations as well. Designers describe mappings between data values and properties of graphical primitives; a language runtime then determines appropriate control flows for data processing, rendering, and animation… However, these languages provide little support for declarative design of interactions.
And that’s pretty interesting, because this is the point at which it is normal to bail out to an imperative callback / event-handler…
These callbacks undo the benefits of declarative design by exposing execution details, forcing users to manually maintain state and coordinate interleavings — a complex and error-prone task colloquially referred to as “callback hell”.
Satyanarayan et al. show us how to extend the declarative approach to cover these interaction use cases, and as a bonus also enable declarative interaction specifications that are reusable across viualisations. We’re talking about things such as interactive selections, panning, zooming, and other visual transformations.
The approach is modelled on Functional Reactive Programming and treats event streams as first class citizens. The key concepts are streams, signals, predicates, scale inversion, and production rules.
- Input event streams (e.g. mouseDown, mouseMove, …) are first class citizens and can be filtered, aggregated, summarized etc.
- When an event enters a stream, it propagates to dependent signals – reactive expressions – which are automatically re-evaluated.
- Signals can be used to construct intensional (e.g. brushing over a range) or extensional (explicit point selection) predicates that define membership in a selection.
- Scale inversion matches ‘visual values’ (i.e. pixels) to data values
- Predicates are then used to modify visual representations using production rules.
There is a simple, CSS-inspired language for selecting and composing event streams:
Our model adopts the semantics of Event-Driven Functional Reactive Programming (E-FRP). Low-level input events (e.g., mouse events and keystrokes) are captured through streams, rather than event callbacks. Abstracting event handling as streams reduces the burden of combining and sequencing events—operations that would require callbacks to coordinate external states. To this end, we introduce a syntax for selecting and composing event streams, as shown in Figure 2. While prior work has formulated regex-based symbols for event selection, we instead draw inspiration from CSS selectors. As a result, our syntax operators are likely to be more familiar to visualization designers.
Here are some examples:
- “mousemove” – the stream of mousemove events
- “rect:mousemove” – stream of mousemove events that occur on rect marks
- “mousedown, mouseup” – single stream merging both event types
- “click[event.pageY >= 300][data.price mouseup” – bounded streams, in this example selecting all mouseup events that occur inbetween a mousedown and a mouseup
- “mousemove{3ms,5ms}” – a stream of mousemove events that occur at least 3ms and at most 5ms apart.
These operators are composable: [mousedown, mousemove] > [keydown, keyup] > mousemove{5ms,10ms} is a stream of mousemove events occurring at least 5ms apart and at most 10ms apart, between keydown and keyup events, which in turn occur between mousedown and mouseup events.
Scale inversion is fairly straightforward for continuous values….
The semantics of inverting discrete categorical or ordinal scales, however, are more complex. To mask this complexity from the user, our model provides a special range predicate. This predicate calculates range extents in pixel space using either constants or signal values and, if a scale inversion is specified, produces a corresponding query: intensional for quantitative scales, extensional for categorical data.
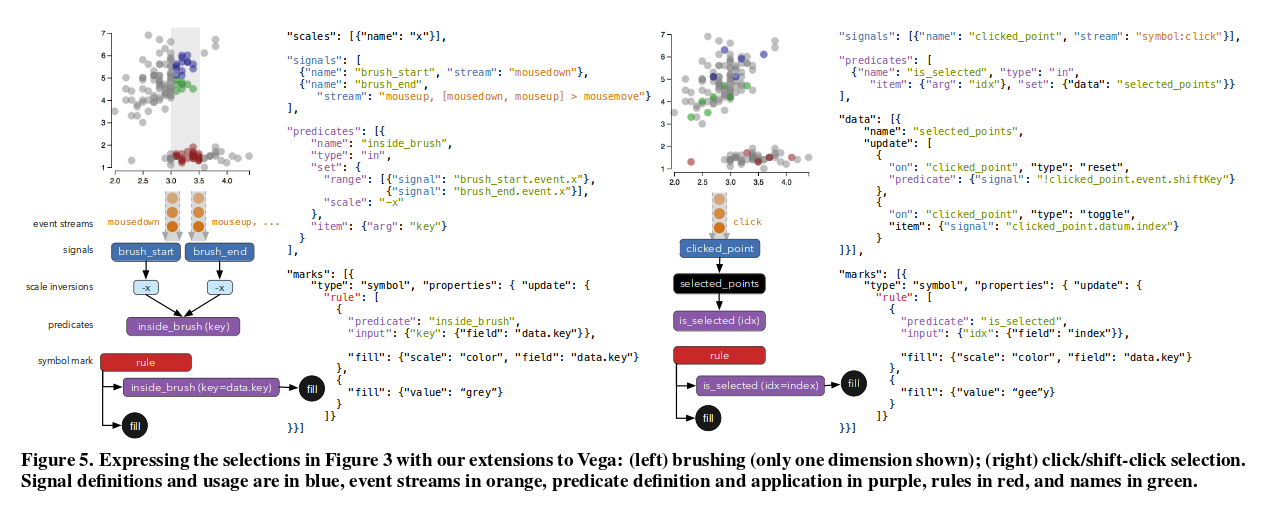
I wish I could reproduce all of the figures from the paper here – it’s a very visual subject matter after all – but for that you’ll have to browse the full paper (link at the top of this post). Here’s Figure 5, which shows the declarative specification (as an extension to the Vega visualisation language) for intensional and extensional selections:
In order to handle the wide range of possible functions that a user may wish to express, the authors borrow the concept of user-defined functions:
It is not feasible for a declarative language to natively support all possible functions, yet custom operations must still be expressible. Following the precedent of languages such as SQL, we provide user-defined functions. These functions can be declaratively invoked within the specification, akin to applying predicates, but must be registered and defined at runtime. User-defined functions ensure that the language remains concise and domain-specific, while ensuring extensibility to idiosyncratic operations.
Through the examples and evaluation, we are also introduced to Yi et al.’s seven categories of interaction based on user intent (an interaction taxonomy), and the 14 Cognitive Dimensions of Notations.
Yi et al. identify seven categories based on user intent: select, to mark items of interest; explore, to examine a different subset of data; reconfigure, to show a different arrangement of data; encode, to use a different visual encoding; abstract/elaborate, to show more or less detail; filter, to show something conditionally; and, connect, to show related items. It is important to note that these categories are not mutually exclusive, and an interaction technique can be classified under several categories. We choose example interactive visualizations to demonstrate that our model can express interactions across all seven categories and how, through composition of its primitives, supports the accretive design of richer interactions.
The Cognitive Dimensions of Notation “provides a set of heuristics for evaluating the efficacy of notational systems such as programming languages and interfaces.”
… our model introduces some hidden dependencies and decreases visibility. However, we believe these are outweighed by the increase in specification consistency of visual encoding and interaction, and the decrease in viscosity by supporting abstraction mechanisms.
There are many advantages to declarative approaches, so it’s great to see Satyanarayan et al. pushing the boundaries.